


The COVID-19 pandemic had a significant impact in population health worldwide, and particularly in people with pre-existing chronic diseases. Early risk identification and stratification is essential to reduce the impact of future outbreaks of pandemic potential. This study aimed to comprehensively examine factors associated with COVID-19 mortality across the pandemic waves in Spain.
MethodsA retrospective study analyzed the characteristics of 13,974 patients admitted to Spanish hospitals due to SARS-CoV-2 infection from 2020-01-28 to 2022-12-31. The demographic and clinical features of patients during hospitalization on each pandemic waves were analyzed.
Main findingsThe findings highlight the heterogeneity of patient characteristics, comorbidities and outcomes, across the waves. The high prevalence of cardiometabolic diseases (53.9%) among COVID-19 patients emphasizes the importance of controlling these risk factors to prevent severe COVID-19 outcomes.
ConclusionsIn summary, the study associate hospital mortality with factors such as advanced age and comorbidities. The decline in mortality after the 4th wave indicates potential influences like vaccination, viral adaptation, or improved treatments. Notably, dementia and cancer metastases emerge as critical factors linked to higher mortality, highlighting the importance of addressing these conditions in COVID-19 management and preparing for future challenges.
La pandemia de COVID-19 tuvo un impacto significativo en la salud de la población a nivel mundial, especialmente en personas con enfermedades crónicas preexistentes. La identificación temprana de riesgos y la estratificación son esenciales para reducir el impacto de futuros brotes con potencial pandémico. Esta investigación tuvo como objetivo examinar de manera integral los factores asociados con la mortalidad por COVID-19 a lo largo de las olas pandémicas en España.
MétodosSe llevó a cabo un estudio retrospectivo para analizar las características de 13.974 pacientes ingresados en hospitales españoles debido a infección por el virus SARS-CoV-2, desde el 28 de enero de 2020 hasta el 31 de diciembre de 2022. Se analizaron las características demográficas y clínicas de los sujetos durante la hospitalización en cada una de las olas pandémicas.
Principales hallazgosLos resultados resaltan la heterogeneidad en las características de los pacientes, comorbilidades y resultados a lo largo de las olas. La alta prevalencia de enfermedades cardiometabólicas (53,9%) e hipertensión (30,3%) entre aquellos con COVID-19, subraya la importancia de controlar estos factores de riesgo para prevenir resultados graves por COVID-19.
ConclusionesEl estudio asocia la mortalidad hospitalaria con factores como la edad avanzada y comorbilidades. La disminución en la mortalidad después de la cuarta ola indica posibles influencias como la vacunación, la adaptación viral o tratamientos mejorados. Notablemente, la demencia y las metástasis del cáncer surgen como factores de riesgo vinculados a una mayor mortalidad, lo que resalta la importancia de abordar estos trastornos en la gestión de la COVID-19 y prepararse para futuros desafíos.
The outbreak of coronavirus disease 2019 (COVID-19) that started in December 2019 in China1 has had a significant impact worldwide. As of May 2023,2 there have been over 765 million confirmed cases globally, an around a total of 13 billion of vaccine doses, and 10–20% of patients developing severe COVID-19 and approximately 5% requiring intensive care.3,4 In response, many countries have adopted unprecedented public health measures to prevent the spread of the virus, which has imposed significant costs on the health sector in those countries. Despite intensive control measures and the availability of vaccines, the number of daily cases and deaths remain concerning, as it is the number of patients recovered presenting sequelae also referred post COVID condition.5
Although the mortality rate from COVID-19 is currently relatively low,6 the wide spread of the epidemic across all population groups made patients’ risk stratification a key public health strategy7 and the greater vulnerability of the elderly and those living with pre-existing chronic diseases was apparent early on in the outbreak. Given the expected spread of the virus, it is crucial to identify and prioritize high-risk patients for appropriate medical care and to implement effective preventive measures to protect vulnerable populations.8 For example, patients undergoing anti-cancer therapies such as chemotherapy, radiotherapy or immunosuppressive drugs are highly vulnerable to the virus, due to immune system dysfunction.8 Despite extensive research on COVID-19,9 detailed information on the causes of death and the contribution of pre-existing comorbidities to mortality is still lacking due to the relatively short period of time we have had to study this novel disease. Therefore, further studies and analysis are necessary to gain a better understanding of the impact of comorbidities on COVID-19 mortality.10–12 The limited literature that has analyzed the clinical and epidemiological data from COVID-19 suggests that specific comorbidities have an increased risk of infection13 with worse lung injury and death. For instance, some studies have indicated the association of COVID-19 with some comorbidities, such as hypertension, diabetes, chronic obstructive pulmonary disease (COPD), malignancy and human immunodeficiency viruses (HIV), among others.10
Among all European countries, Spain has been one of the most affected by the pandemic.12
Based on confirmed cases, deaths and seroprevalence studies, within all regions of Spain, Madrid was one of the most affected regions,6 since after the 1st wave it has adopted less restrictive measures against COVID-19 compared to other regions in the country.14 During the peak of the 1st wave, COVID-19 hospital admissions overwhelmed most hospitals in the Madrid region.
The present study assesses the clinical characteristics and mortality-associated factors in COVID-19 patients admitted to Spanish hospitals throughout successive pandemic periods. This initial step aims to identify risk factors associated with mortality among patients hospitalized in Spain due to SARS-CoV-2 infection across the pandemic.
Patients and methodsHospitals and electronic health recordsThe University Hospital La Princesa (HULP) is a reference public hospital located in the city of Madrid. While, HM Hospitals (HM) is a network of 21 private University Hospitals with presence across Spain in the regions of Madrid (8 hospitals), Galicia (4), Andalusia (4), Catalonia (3), and Castilla Leon (2). Specifically, 13 HM Hospitals with a total of 1532 beds have been considered for this study: Madrid (7 hospitals; 815 beds), Galicia (3; 305), Catalonia (2; 282) and Castilla Leon (1; 130), while HULP comprises a total of 584 beds. The information used on this secondary data analysis was retrieved from electronic health records (EHR) of 13,974 adult patients (age≥18 years) admitted to HM or HULP hospitals upon COVID-19 positive clinical diagnosis, confirmed either by positive antigen or polymerase tests between 2020-01-28 and 2022-12-31. Information retrieved include demographics (age, and sex) at admission, prevalence of comorbidities (cardiometabolic and pulmonary diseases, neoplasms, mental disorders, infections, and others) under the frame of unCoVer protocol.15 Charlson Comorbidity Index (CCI) at admission was also calculated ranging from 0 to 14 and further classified into four groups: Group 1: no comorbidities, including score 0; Group 2: mild or moderate disease, including scores 1–2; Group 3: severe illness or mild to moderate impairment, including scores 3–5; Group 4: very severe illness or severe failure, including scores 6–14. Length of hospital stay was retrieved from all patients, and hospital outcomes (ICU transfer, death or recovery) were recorded for a maximum of 90 days after admission. Databases were analyzed both individually and combined. Data were extracted and anonymised from the local EHRs and combined into a single harmonised dataset. First, Hospital data were mapped to common variable names using in both hospitals the recorded ICD-10 code for comorbidities. Then, data were enriched by calculating the CCI and finally data validation were performed according to the values of the variables selection.
Research protocol was approved by the Ethics Committee for Medical and Drug Research of HULP on May 20, 2021, acta CEIm 10/21 with No. 4468 and HM on May 12, 2021, acta CEIm No. 222 and CEIm Ref No. 21.04.1841-GHM.
Definition of COVID-19 epidemic wavesAccording to the latest report of the Spanish National Center for Epidemiology and the National Network of Epidemiological Surveillance (RENAVE),16 until March 28, 2022, six epidemic waves of COVID-19 were identified in Spain by analysing the evolution of incidence rates in the entire population. A 1st wave was defined from the beginning of the pandemic until June 21, 2020, date on which the state of emergency in Spain ended once the epidemic numbers declined. A 2nd (June 22, 2020–December 6, 2020), 3rd (December 7, 2020–March 14, 2021), 4th (March 15, 2021–June 19, 2021), 5th (June 20, 2021–October 13, 2021), 6th (October 14, 2021–March 27, 2022) waves were defined according to the inflection point of the accumulated incidence at 14 days of COVID-19 cases between epidemic waves. The pandemic period covered the period until a new surveillance strategy establishing the diagnosis of all suspected cases in people aged 60 or over and of hospitalised cases of any age came into effect (March 28, 2022).16
ICD codesIn this study, we employed the ICD-10 coding algorithm for cardiometabolic diseases (10 distinct diagnoses), pulmonary diseases (4 diagnoses), neoplasms (6 diagnoses), mental disorders (3 diagnoses), infections (4 diagnoses), and others (8 diagnoses). The specific ICD-10 codes utilized in this study are documented in eTable 1.
Statistical analysisFirst, a descriptive and comparative analysis of sociodemographic and clinical variables across each SARS-CoV-2 waves in Madrid was performed. For continuous variables results were expressed as mean and standard deviation (SD). Normality of continuous variables was tested using Shapiro–W Kolmogorov–Smirnov test and homocedasticity was assessed using Levene's test. Parametric or non-parametric tests were performed based on the fulfilment of these assumptions. Categorical variables were compared using Chi-square test or Fisher's exact test, as appropriate. To identify potential associations of patient's information with an increased risk of in-hospital death, first a backward stepwise regression was used to identify possible predictors of patient outcome based on p-values, and the Bayesian Information Criterion (BIC). Further Kaplan–Meier survival curves of up to 90 days from hospital admission were calculated and Cox regression models were used to calculate hazard ratios accounting for the variables obtained from the backward stepwise regression for HM network and La Princesa hospital together, and for independently. The multicollinearity of the variables previously to conduct the Cox regression models was assessed measuring the correlation and strength of correlation between the predictor variables in each regression model by using the variance inflation factor (VIF).17 In the scenario that any variable reaches a potentially severe correlation (≥5),17 that variable will be dropped and will not be used for the model. In all analyses, a p value below 0.05 was considered to indicate statistical significance. All data processing and statistics were performed using R.
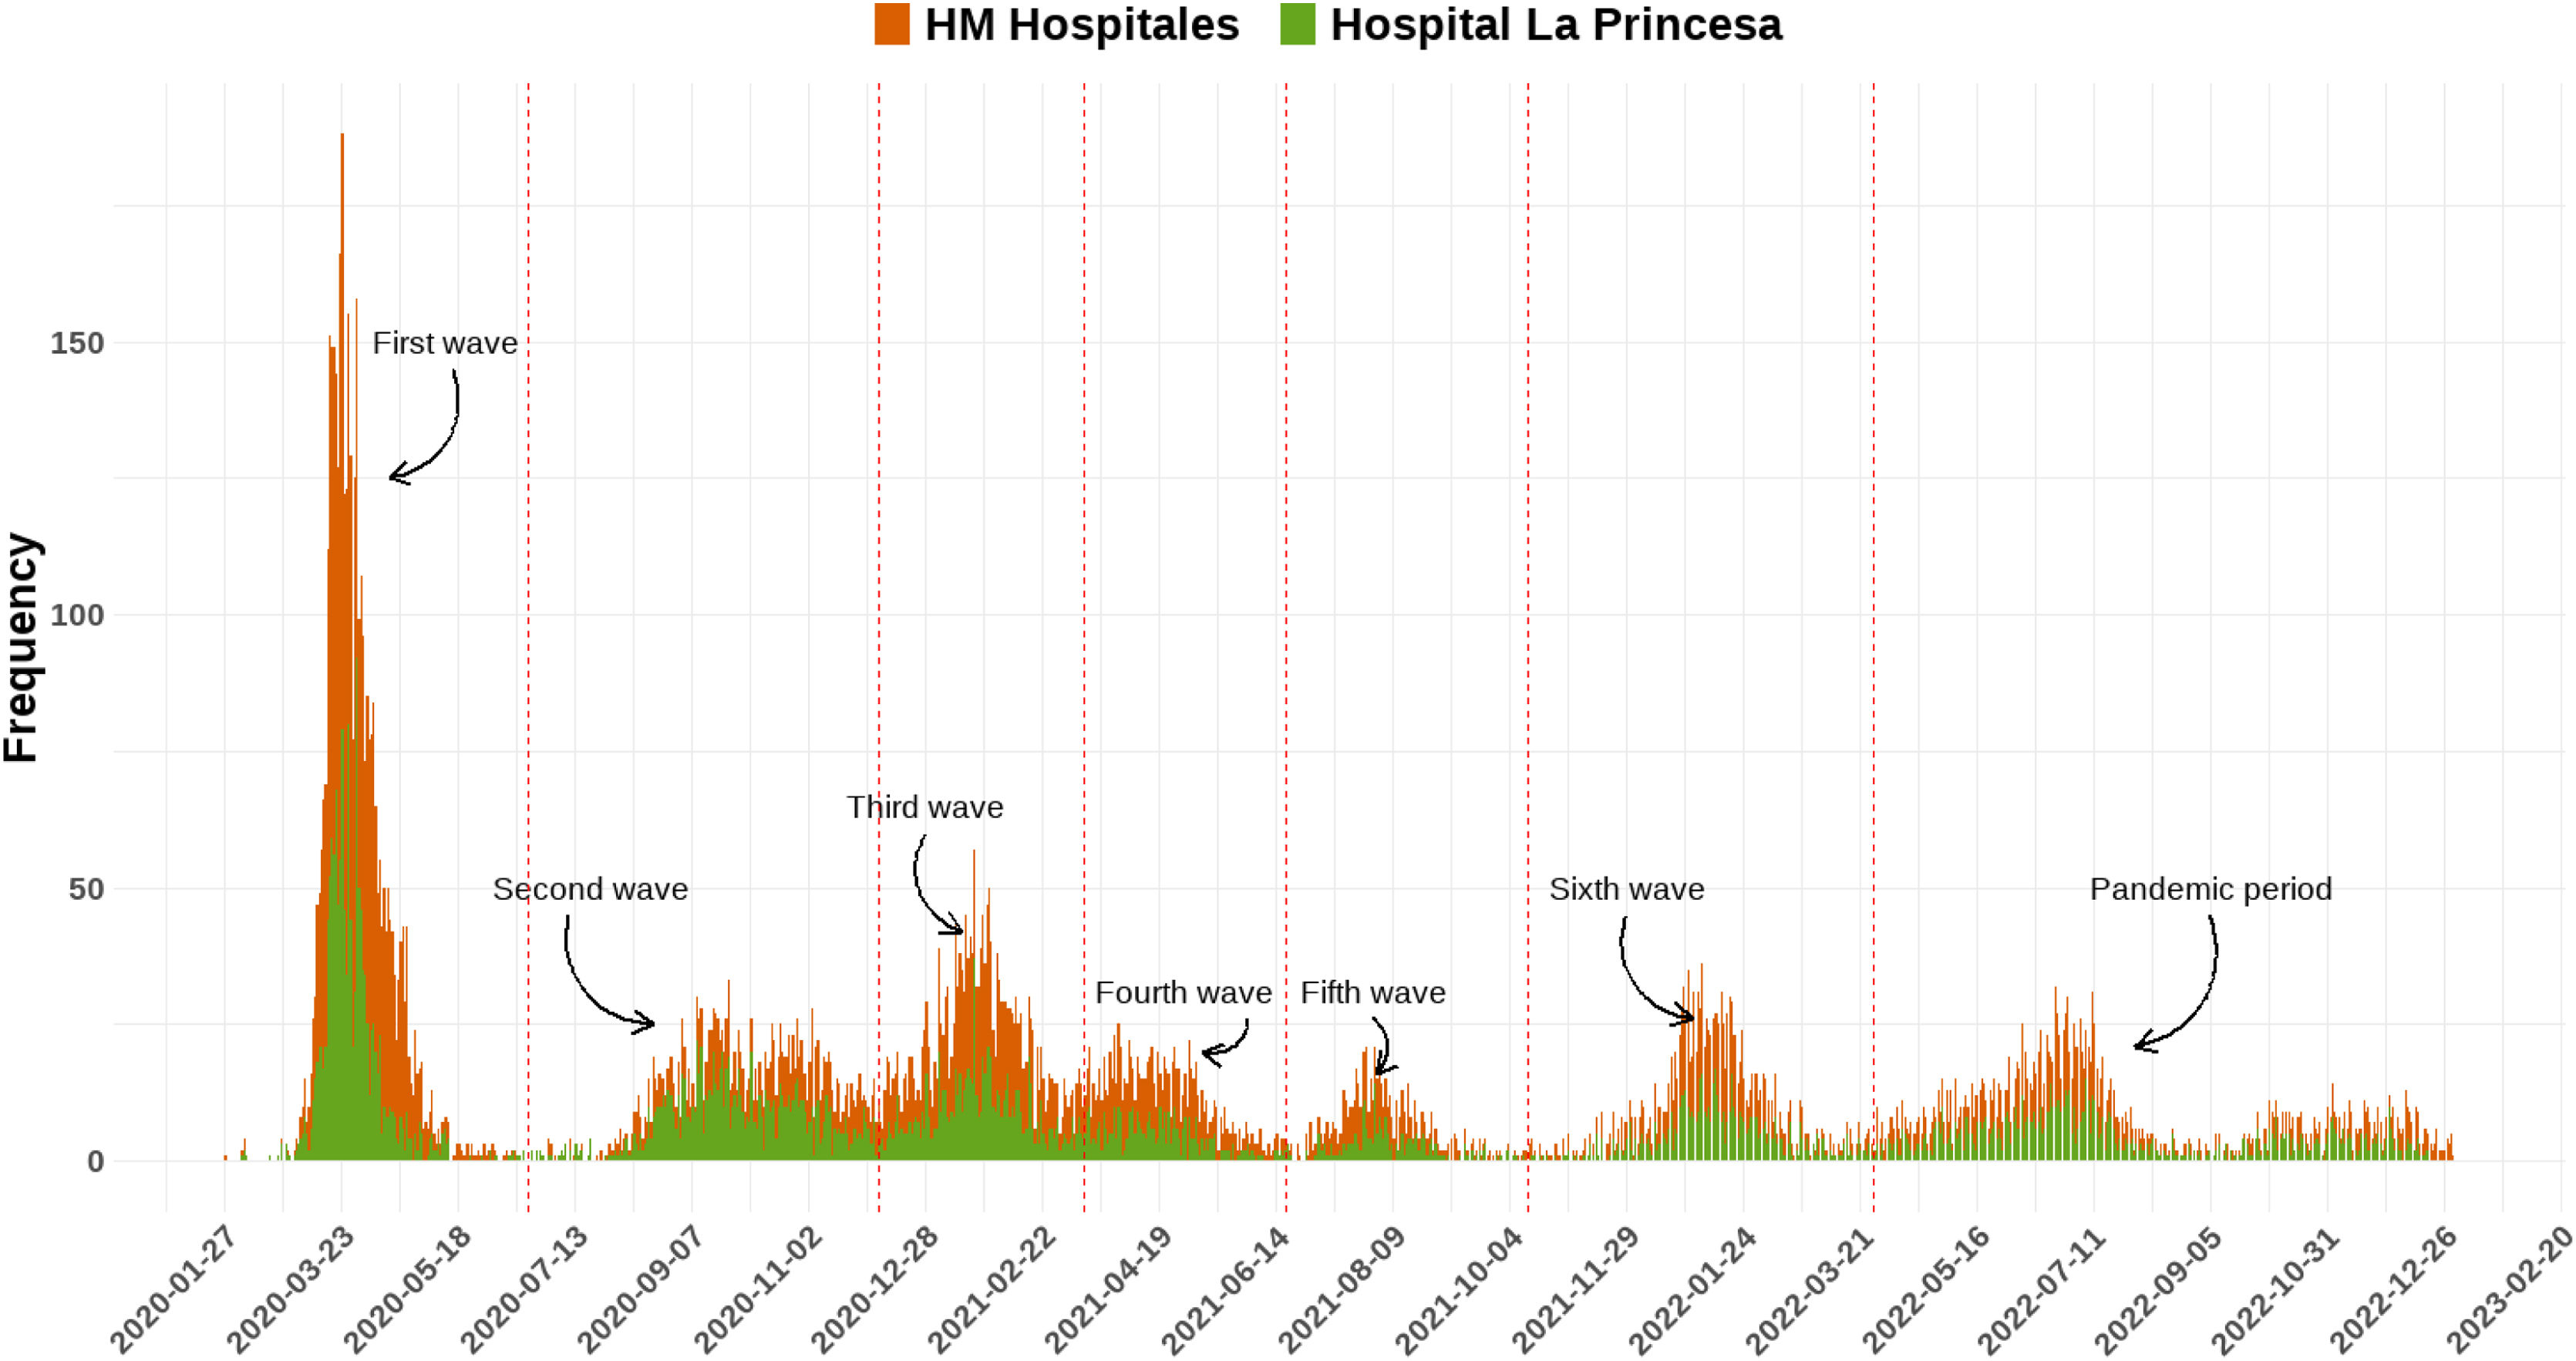
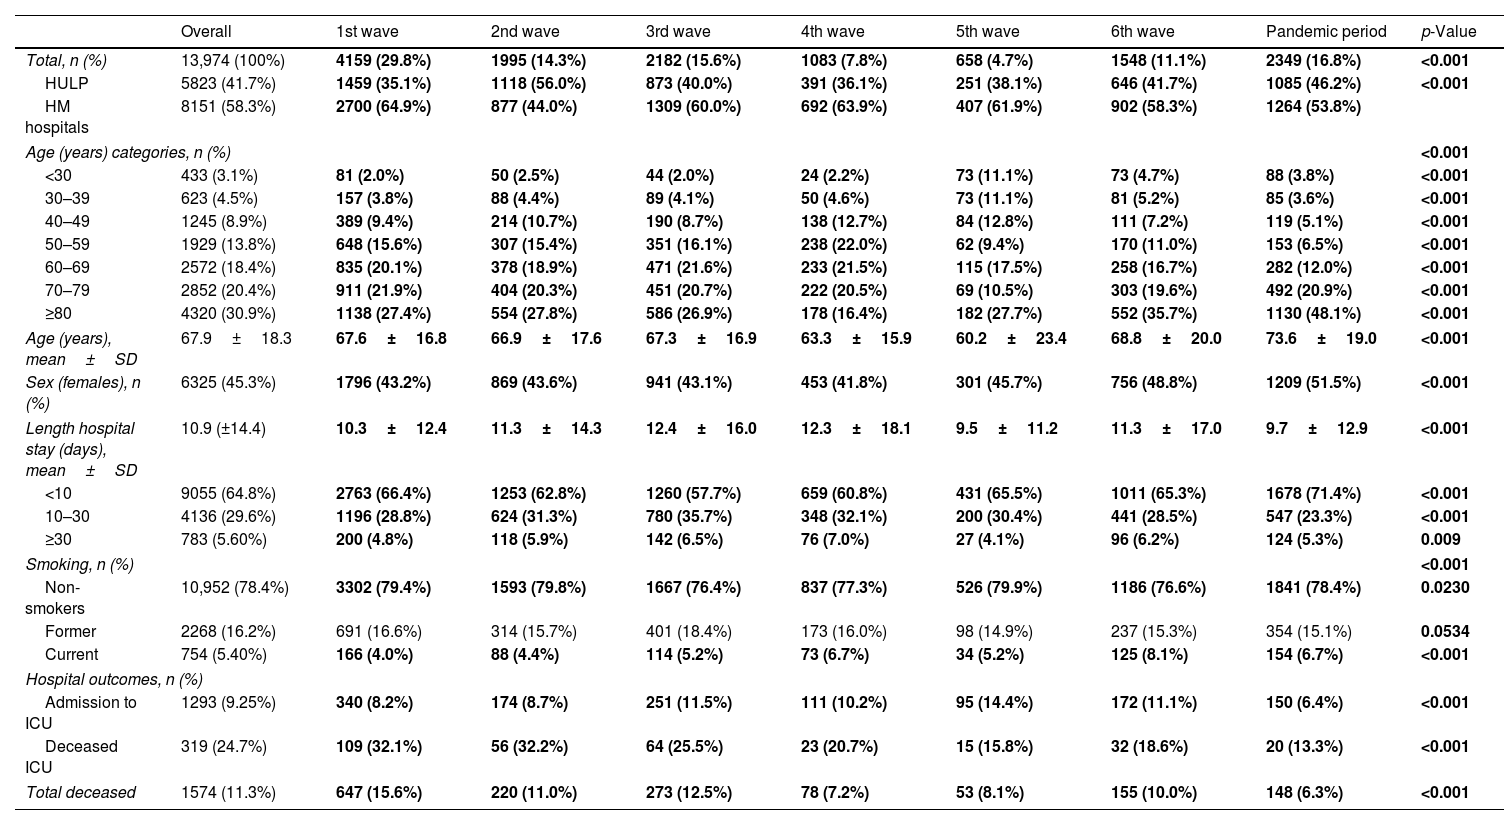
ResultsPatient's demographicsWe studied 13,974 COVID-19 patients at HM network (58.3%) and HULP (41.7%) (Fig. 1, Table 1). The mean age was 67.9 years (±18.3), with 30.9% aged≥80 and 3.1% under 30. Mean age varied significantly across waves, peaking in the pandemic period (73.6 years±19.0) and lowest in the 5th (60.2 years±23.4). Predominantly, age 80 and older led, except in the 4th wave (50–59 years). The reverse was true for under 30, except in the 5th wave (50–59 years).

Description of patients’ demographic characteristics and hospital outcomes across the seven pandemic waves in Spain.
| Overall | 1st wave | 2nd wave | 3rd wave | 4th wave | 5th wave | 6th wave | Pandemic period | p-Value | |
|---|---|---|---|---|---|---|---|---|---|
| Total, n (%) | 13,974 (100%) | 4159 (29.8%) | 1995 (14.3%) | 2182 (15.6%) | 1083 (7.8%) | 658 (4.7%) | 1548 (11.1%) | 2349 (16.8%) | <0.001 |
| HULP | 5823 (41.7%) | 1459 (35.1%) | 1118 (56.0%) | 873 (40.0%) | 391 (36.1%) | 251 (38.1%) | 646 (41.7%) | 1085 (46.2%) | <0.001 |
| HM hospitals | 8151 (58.3%) | 2700 (64.9%) | 877 (44.0%) | 1309 (60.0%) | 692 (63.9%) | 407 (61.9%) | 902 (58.3%) | 1264 (53.8%) | |
| Age (years) categories, n (%) | <0.001 | ||||||||
| <30 | 433 (3.1%) | 81 (2.0%) | 50 (2.5%) | 44 (2.0%) | 24 (2.2%) | 73 (11.1%) | 73 (4.7%) | 88 (3.8%) | <0.001 |
| 30–39 | 623 (4.5%) | 157 (3.8%) | 88 (4.4%) | 89 (4.1%) | 50 (4.6%) | 73 (11.1%) | 81 (5.2%) | 85 (3.6%) | <0.001 |
| 40–49 | 1245 (8.9%) | 389 (9.4%) | 214 (10.7%) | 190 (8.7%) | 138 (12.7%) | 84 (12.8%) | 111 (7.2%) | 119 (5.1%) | <0.001 |
| 50–59 | 1929 (13.8%) | 648 (15.6%) | 307 (15.4%) | 351 (16.1%) | 238 (22.0%) | 62 (9.4%) | 170 (11.0%) | 153 (6.5%) | <0.001 |
| 60–69 | 2572 (18.4%) | 835 (20.1%) | 378 (18.9%) | 471 (21.6%) | 233 (21.5%) | 115 (17.5%) | 258 (16.7%) | 282 (12.0%) | <0.001 |
| 70–79 | 2852 (20.4%) | 911 (21.9%) | 404 (20.3%) | 451 (20.7%) | 222 (20.5%) | 69 (10.5%) | 303 (19.6%) | 492 (20.9%) | <0.001 |
| ≥80 | 4320 (30.9%) | 1138 (27.4%) | 554 (27.8%) | 586 (26.9%) | 178 (16.4%) | 182 (27.7%) | 552 (35.7%) | 1130 (48.1%) | <0.001 |
| Age (years), mean±SD | 67.9±18.3 | 67.6±16.8 | 66.9±17.6 | 67.3±16.9 | 63.3±15.9 | 60.2±23.4 | 68.8±20.0 | 73.6±19.0 | <0.001 |
| Sex (females), n (%) | 6325 (45.3%) | 1796 (43.2%) | 869 (43.6%) | 941 (43.1%) | 453 (41.8%) | 301 (45.7%) | 756 (48.8%) | 1209 (51.5%) | <0.001 |
| Length hospital stay (days), mean±SD | 10.9 (±14.4) | 10.3±12.4 | 11.3±14.3 | 12.4±16.0 | 12.3±18.1 | 9.5±11.2 | 11.3±17.0 | 9.7±12.9 | <0.001 |
| <10 | 9055 (64.8%) | 2763 (66.4%) | 1253 (62.8%) | 1260 (57.7%) | 659 (60.8%) | 431 (65.5%) | 1011 (65.3%) | 1678 (71.4%) | <0.001 |
| 10–30 | 4136 (29.6%) | 1196 (28.8%) | 624 (31.3%) | 780 (35.7%) | 348 (32.1%) | 200 (30.4%) | 441 (28.5%) | 547 (23.3%) | <0.001 |
| ≥30 | 783 (5.60%) | 200 (4.8%) | 118 (5.9%) | 142 (6.5%) | 76 (7.0%) | 27 (4.1%) | 96 (6.2%) | 124 (5.3%) | 0.009 |
| Smoking, n (%) | <0.001 | ||||||||
| Non-smokers | 10,952 (78.4%) | 3302 (79.4%) | 1593 (79.8%) | 1667 (76.4%) | 837 (77.3%) | 526 (79.9%) | 1186 (76.6%) | 1841 (78.4%) | 0.0230 |
| Former | 2268 (16.2%) | 691 (16.6%) | 314 (15.7%) | 401 (18.4%) | 173 (16.0%) | 98 (14.9%) | 237 (15.3%) | 354 (15.1%) | 0.0534 |
| Current | 754 (5.40%) | 166 (4.0%) | 88 (4.4%) | 114 (5.2%) | 73 (6.7%) | 34 (5.2%) | 125 (8.1%) | 154 (6.7%) | <0.001 |
| Hospital outcomes, n (%) | |||||||||
| Admission to ICU | 1293 (9.25%) | 340 (8.2%) | 174 (8.7%) | 251 (11.5%) | 111 (10.2%) | 95 (14.4%) | 172 (11.1%) | 150 (6.4%) | <0.001 |
| Deceased ICU | 319 (24.7%) | 109 (32.1%) | 56 (32.2%) | 64 (25.5%) | 23 (20.7%) | 15 (15.8%) | 32 (18.6%) | 20 (13.3%) | <0.001 |
| Total deceased | 1574 (11.3%) | 647 (15.6%) | 220 (11.0%) | 273 (12.5%) | 78 (7.2%) | 53 (8.1%) | 155 (10.0%) | 148 (6.3%) | <0.001 |
Data are shown as n (%), mean±standard deviation (SD). Significant comparisons (p<0.05) among all the waves are marked in bold.
Females comprised 45.3%, and the proportion varied significantly by waves, peaking in the pandemic period (51.5%) and lowest in the 4th (41.8%). Across waves, men dominated all age ranges except for 80 and older.
Hospital outcomesThe mean hospital stay was 10.9 days (±14.4). ICU admissions were 9.3%, deaths 11.3%, with 20.3% also in ICU, varying by waves (Table 1). Highest admissions were in the 1st wave (29.8%), lowest in the 5th wave (4.7%) (eFig. 1). The mean hospital stay varied significantly across waves (Table 1). It was shortest during the 5th wave (9.5 days±11.2) and longest in the 3rd wave (12.4 days±16.0). In all waves, the majority had a length of stay less than 10 days. ICU admission and the number of deaths showed significant variation in each wave (eFig. 2). The 5th wave had the highest percentage of ICU admissions (14.4%), and the 1st wave had the highest percentage of deceased patients (32.1%). In terms of ICU admissions, the majority (50.7%) of patients recovered. The 2nd wave had the highest mortality (32.2%), while the pandemic period had the lowest (13.3%). Patient outcomes also differed significantly among waves, with the 1st wave having the highest proportion of deceased patients (15.6%) and the pandemic period the lowest (6.3%).
Mean hospital stay was significantly different between waves, being the lowest for the 5th wave (9.5 days±11.2) and then highest for the 3rd wave (12.4 days±16.0). In all waves the predominant length of stay lower to 10 days, and the minority greater than or equal to 30 days. ICU admission and number of deaths varied significantly for each wave (eFig. 2), reaching in the 5th wave the highest percentage of admitted ICU patients (14.4%) and in the 1st wave of deceased/exitus patients (32.1%). For ICU admission most of them (50.7%) were recovered, being in the 2nd wave when a significantly higher number of patients died (32.2%) and in the pandemic period the lowest (13.3%). The outcome result of the patients was also significantly heterogeneous among the waves, being the highest proportion of deceased patients in the 1st wave (15.6%) and the pandemic period the lowest (6.3%).
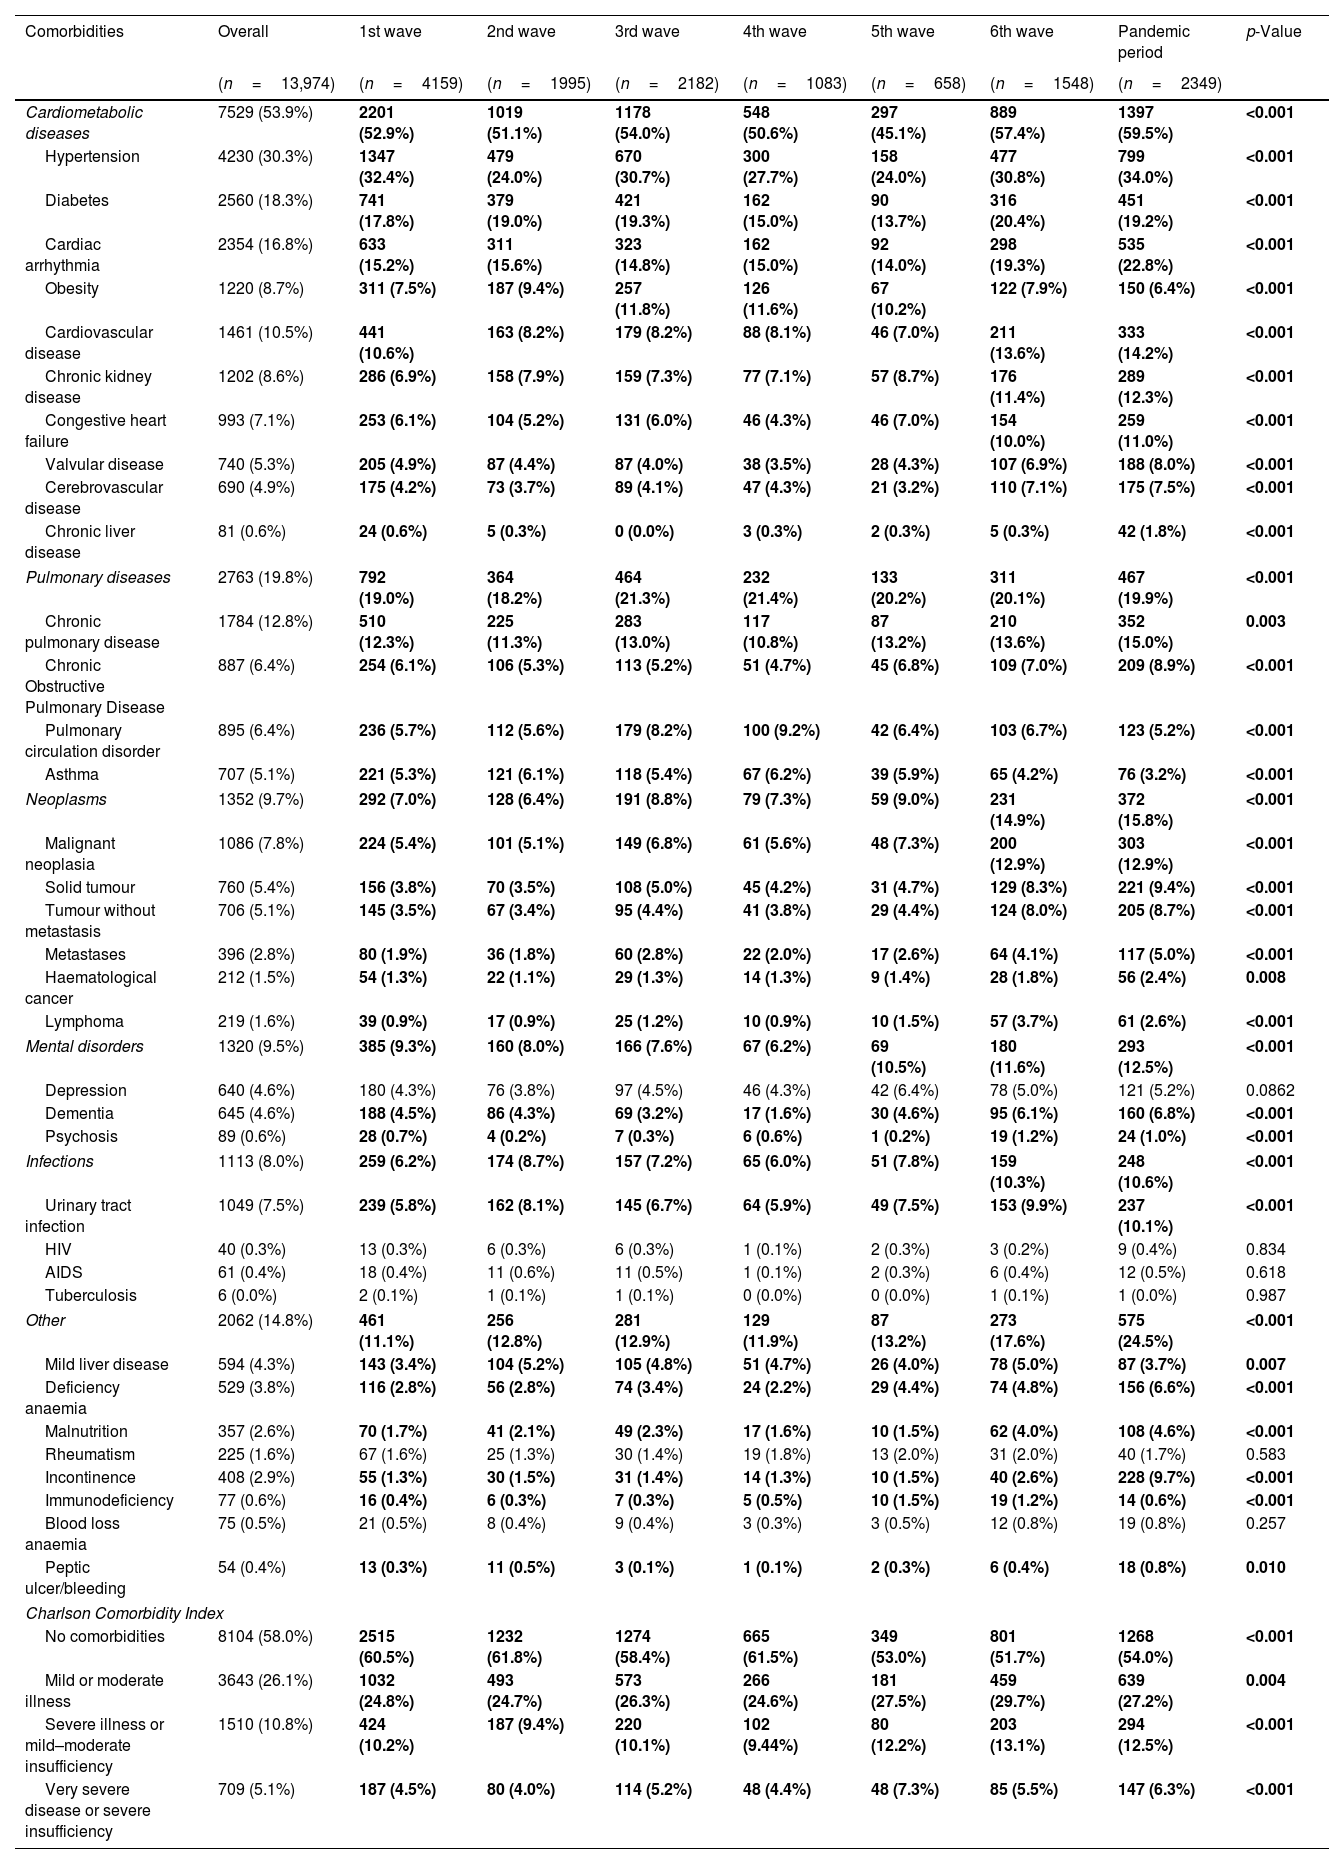
Patients’ comorbiditiesCardiometabolic diseases was the comorbidity group that had the highest prevalence (53.9%), followed by pulmonary diseases (19.8%), other comorbidities (14.8%), neoplasms (9.7%), mental disorders (9.5%) and infections (8.0%) (Table 2). The top three most prevalent comorbidities were hypertension (30.3%), diabetes (18.3) and cardiac arrhythmia (16.8). While the lowest were tuberculosis (<0.1%), HIV (0.3%) and peptic ulcer/bleeding (0.4%). Within cardiometabolic diseases, hypertension (maximum reported in the pandemic period: 34.0%), diabetes (6th wave: 20.4%), cardiac arrhythmia (pandemic period: 23.0%), obesity (3rd wave: 11.8%), cardiovascular disease (pandemic period: 14.2%), congestive heart failure (pandemic period: 11.0%), valvular disease (pandemic period: 8.0%) and chronic liver disease (pandemic period: 1.8%) varied significantly among the waves. Among pulmonary-related comorbidities, pulmonary circulation disorder (9.2%) and asthma (6.2%), varied significantly between waves, being the maximum in the 4th wave. On the other hand, most of comorbidities analyzed of the neoplasms group showed a significant higher proportion in the pandemic period (neoplasia (12.9%), solid tumour (9.4%), tumour without metastasis (8.7%), metastases (5.0%) and lymphoma (2.6%)). For mental disorders and infections, only dementia (4.6%) and urinary tract infection (7.5%) showed significantly higher proportion, reaching in the pandemic period the maximum. Finally, the remaining group of comorbidities, mild liver disease (4.3%), deficiency anaemia (3.8%), incontinence (2.9%), malnutrition (2.6%), and immunodeficiency (0.6%) showed a significant variation among the waves, with the maximum in the 2nd, pandemic period and 5th waves, respectively.
Description (n,%) of comorbidities admission in COVID-19 hospitalized patients across pandemic.
| Comorbidities | Overall | 1st wave | 2nd wave | 3rd wave | 4th wave | 5th wave | 6th wave | Pandemic period | p-Value |
|---|---|---|---|---|---|---|---|---|---|
| (n=13,974) | (n=4159) | (n=1995) | (n=2182) | (n=1083) | (n=658) | (n=1548) | (n=2349) | ||
| Cardiometabolic diseases | 7529 (53.9%) | 2201 (52.9%) | 1019 (51.1%) | 1178 (54.0%) | 548 (50.6%) | 297 (45.1%) | 889 (57.4%) | 1397 (59.5%) | <0.001 |
| Hypertension | 4230 (30.3%) | 1347 (32.4%) | 479 (24.0%) | 670 (30.7%) | 300 (27.7%) | 158 (24.0%) | 477 (30.8%) | 799 (34.0%) | <0.001 |
| Diabetes | 2560 (18.3%) | 741 (17.8%) | 379 (19.0%) | 421 (19.3%) | 162 (15.0%) | 90 (13.7%) | 316 (20.4%) | 451 (19.2%) | <0.001 |
| Cardiac arrhythmia | 2354 (16.8%) | 633 (15.2%) | 311 (15.6%) | 323 (14.8%) | 162 (15.0%) | 92 (14.0%) | 298 (19.3%) | 535 (22.8%) | <0.001 |
| Obesity | 1220 (8.7%) | 311 (7.5%) | 187 (9.4%) | 257 (11.8%) | 126 (11.6%) | 67 (10.2%) | 122 (7.9%) | 150 (6.4%) | <0.001 |
| Cardiovascular disease | 1461 (10.5%) | 441 (10.6%) | 163 (8.2%) | 179 (8.2%) | 88 (8.1%) | 46 (7.0%) | 211 (13.6%) | 333 (14.2%) | <0.001 |
| Chronic kidney disease | 1202 (8.6%) | 286 (6.9%) | 158 (7.9%) | 159 (7.3%) | 77 (7.1%) | 57 (8.7%) | 176 (11.4%) | 289 (12.3%) | <0.001 |
| Congestive heart failure | 993 (7.1%) | 253 (6.1%) | 104 (5.2%) | 131 (6.0%) | 46 (4.3%) | 46 (7.0%) | 154 (10.0%) | 259 (11.0%) | <0.001 |
| Valvular disease | 740 (5.3%) | 205 (4.9%) | 87 (4.4%) | 87 (4.0%) | 38 (3.5%) | 28 (4.3%) | 107 (6.9%) | 188 (8.0%) | <0.001 |
| Cerebrovascular disease | 690 (4.9%) | 175 (4.2%) | 73 (3.7%) | 89 (4.1%) | 47 (4.3%) | 21 (3.2%) | 110 (7.1%) | 175 (7.5%) | <0.001 |
| Chronic liver disease | 81 (0.6%) | 24 (0.6%) | 5 (0.3%) | 0 (0.0%) | 3 (0.3%) | 2 (0.3%) | 5 (0.3%) | 42 (1.8%) | <0.001 |
| Pulmonary diseases | 2763 (19.8%) | 792 (19.0%) | 364 (18.2%) | 464 (21.3%) | 232 (21.4%) | 133 (20.2%) | 311 (20.1%) | 467 (19.9%) | <0.001 |
| Chronic pulmonary disease | 1784 (12.8%) | 510 (12.3%) | 225 (11.3%) | 283 (13.0%) | 117 (10.8%) | 87 (13.2%) | 210 (13.6%) | 352 (15.0%) | 0.003 |
| Chronic Obstructive Pulmonary Disease | 887 (6.4%) | 254 (6.1%) | 106 (5.3%) | 113 (5.2%) | 51 (4.7%) | 45 (6.8%) | 109 (7.0%) | 209 (8.9%) | <0.001 |
| Pulmonary circulation disorder | 895 (6.4%) | 236 (5.7%) | 112 (5.6%) | 179 (8.2%) | 100 (9.2%) | 42 (6.4%) | 103 (6.7%) | 123 (5.2%) | <0.001 |
| Asthma | 707 (5.1%) | 221 (5.3%) | 121 (6.1%) | 118 (5.4%) | 67 (6.2%) | 39 (5.9%) | 65 (4.2%) | 76 (3.2%) | <0.001 |
| Neoplasms | 1352 (9.7%) | 292 (7.0%) | 128 (6.4%) | 191 (8.8%) | 79 (7.3%) | 59 (9.0%) | 231 (14.9%) | 372 (15.8%) | <0.001 |
| Malignant neoplasia | 1086 (7.8%) | 224 (5.4%) | 101 (5.1%) | 149 (6.8%) | 61 (5.6%) | 48 (7.3%) | 200 (12.9%) | 303 (12.9%) | <0.001 |
| Solid tumour | 760 (5.4%) | 156 (3.8%) | 70 (3.5%) | 108 (5.0%) | 45 (4.2%) | 31 (4.7%) | 129 (8.3%) | 221 (9.4%) | <0.001 |
| Tumour without metastasis | 706 (5.1%) | 145 (3.5%) | 67 (3.4%) | 95 (4.4%) | 41 (3.8%) | 29 (4.4%) | 124 (8.0%) | 205 (8.7%) | <0.001 |
| Metastases | 396 (2.8%) | 80 (1.9%) | 36 (1.8%) | 60 (2.8%) | 22 (2.0%) | 17 (2.6%) | 64 (4.1%) | 117 (5.0%) | <0.001 |
| Haematological cancer | 212 (1.5%) | 54 (1.3%) | 22 (1.1%) | 29 (1.3%) | 14 (1.3%) | 9 (1.4%) | 28 (1.8%) | 56 (2.4%) | 0.008 |
| Lymphoma | 219 (1.6%) | 39 (0.9%) | 17 (0.9%) | 25 (1.2%) | 10 (0.9%) | 10 (1.5%) | 57 (3.7%) | 61 (2.6%) | <0.001 |
| Mental disorders | 1320 (9.5%) | 385 (9.3%) | 160 (8.0%) | 166 (7.6%) | 67 (6.2%) | 69 (10.5%) | 180 (11.6%) | 293 (12.5%) | <0.001 |
| Depression | 640 (4.6%) | 180 (4.3%) | 76 (3.8%) | 97 (4.5%) | 46 (4.3%) | 42 (6.4%) | 78 (5.0%) | 121 (5.2%) | 0.0862 |
| Dementia | 645 (4.6%) | 188 (4.5%) | 86 (4.3%) | 69 (3.2%) | 17 (1.6%) | 30 (4.6%) | 95 (6.1%) | 160 (6.8%) | <0.001 |
| Psychosis | 89 (0.6%) | 28 (0.7%) | 4 (0.2%) | 7 (0.3%) | 6 (0.6%) | 1 (0.2%) | 19 (1.2%) | 24 (1.0%) | <0.001 |
| Infections | 1113 (8.0%) | 259 (6.2%) | 174 (8.7%) | 157 (7.2%) | 65 (6.0%) | 51 (7.8%) | 159 (10.3%) | 248 (10.6%) | <0.001 |
| Urinary tract infection | 1049 (7.5%) | 239 (5.8%) | 162 (8.1%) | 145 (6.7%) | 64 (5.9%) | 49 (7.5%) | 153 (9.9%) | 237 (10.1%) | <0.001 |
| HIV | 40 (0.3%) | 13 (0.3%) | 6 (0.3%) | 6 (0.3%) | 1 (0.1%) | 2 (0.3%) | 3 (0.2%) | 9 (0.4%) | 0.834 |
| AIDS | 61 (0.4%) | 18 (0.4%) | 11 (0.6%) | 11 (0.5%) | 1 (0.1%) | 2 (0.3%) | 6 (0.4%) | 12 (0.5%) | 0.618 |
| Tuberculosis | 6 (0.0%) | 2 (0.1%) | 1 (0.1%) | 1 (0.1%) | 0 (0.0%) | 0 (0.0%) | 1 (0.1%) | 1 (0.0%) | 0.987 |
| Other | 2062 (14.8%) | 461 (11.1%) | 256 (12.8%) | 281 (12.9%) | 129 (11.9%) | 87 (13.2%) | 273 (17.6%) | 575 (24.5%) | <0.001 |
| Mild liver disease | 594 (4.3%) | 143 (3.4%) | 104 (5.2%) | 105 (4.8%) | 51 (4.7%) | 26 (4.0%) | 78 (5.0%) | 87 (3.7%) | 0.007 |
| Deficiency anaemia | 529 (3.8%) | 116 (2.8%) | 56 (2.8%) | 74 (3.4%) | 24 (2.2%) | 29 (4.4%) | 74 (4.8%) | 156 (6.6%) | <0.001 |
| Malnutrition | 357 (2.6%) | 70 (1.7%) | 41 (2.1%) | 49 (2.3%) | 17 (1.6%) | 10 (1.5%) | 62 (4.0%) | 108 (4.6%) | <0.001 |
| Rheumatism | 225 (1.6%) | 67 (1.6%) | 25 (1.3%) | 30 (1.4%) | 19 (1.8%) | 13 (2.0%) | 31 (2.0%) | 40 (1.7%) | 0.583 |
| Incontinence | 408 (2.9%) | 55 (1.3%) | 30 (1.5%) | 31 (1.4%) | 14 (1.3%) | 10 (1.5%) | 40 (2.6%) | 228 (9.7%) | <0.001 |
| Immunodeficiency | 77 (0.6%) | 16 (0.4%) | 6 (0.3%) | 7 (0.3%) | 5 (0.5%) | 10 (1.5%) | 19 (1.2%) | 14 (0.6%) | <0.001 |
| Blood loss anaemia | 75 (0.5%) | 21 (0.5%) | 8 (0.4%) | 9 (0.4%) | 3 (0.3%) | 3 (0.5%) | 12 (0.8%) | 19 (0.8%) | 0.257 |
| Peptic ulcer/bleeding | 54 (0.4%) | 13 (0.3%) | 11 (0.5%) | 3 (0.1%) | 1 (0.1%) | 2 (0.3%) | 6 (0.4%) | 18 (0.8%) | 0.010 |
| Charlson Comorbidity Index | |||||||||
| No comorbidities | 8104 (58.0%) | 2515 (60.5%) | 1232 (61.8%) | 1274 (58.4%) | 665 (61.5%) | 349 (53.0%) | 801 (51.7%) | 1268 (54.0%) | <0.001 |
| Mild or moderate illness | 3643 (26.1%) | 1032 (24.8%) | 493 (24.7%) | 573 (26.3%) | 266 (24.6%) | 181 (27.5%) | 459 (29.7%) | 639 (27.2%) | 0.004 |
| Severe illness or mild–moderate insufficiency | 1510 (10.8%) | 424 (10.2%) | 187 (9.4%) | 220 (10.1%) | 102 (9.44%) | 80 (12.2%) | 203 (13.1%) | 294 (12.5%) | <0.001 |
| Very severe disease or severe insufficiency | 709 (5.1%) | 187 (4.5%) | 80 (4.0%) | 114 (5.2%) | 48 (4.4%) | 48 (7.3%) | 85 (5.5%) | 147 (6.3%) | <0.001 |
Data are shown as n (%), mean±standard deviation (SD). Significant comparisons (p<0.05) are marked in bold.
Finally, Charlson Comorbidity Index (CCI) were grouped into four groups: Group 1: no comorbidities (58.0%), including score 0; Group 2: mild or moderate disease (26.1%), including scores 1–2; Group 3: severe illness or mild to moderate impairment (10.8%), including scores 3–5; Group 4: very severe illness or severe failure, including scores 6–14 (5.1%). Throughout the waves the non-comorbidities group was predominant, although it has been reduced.
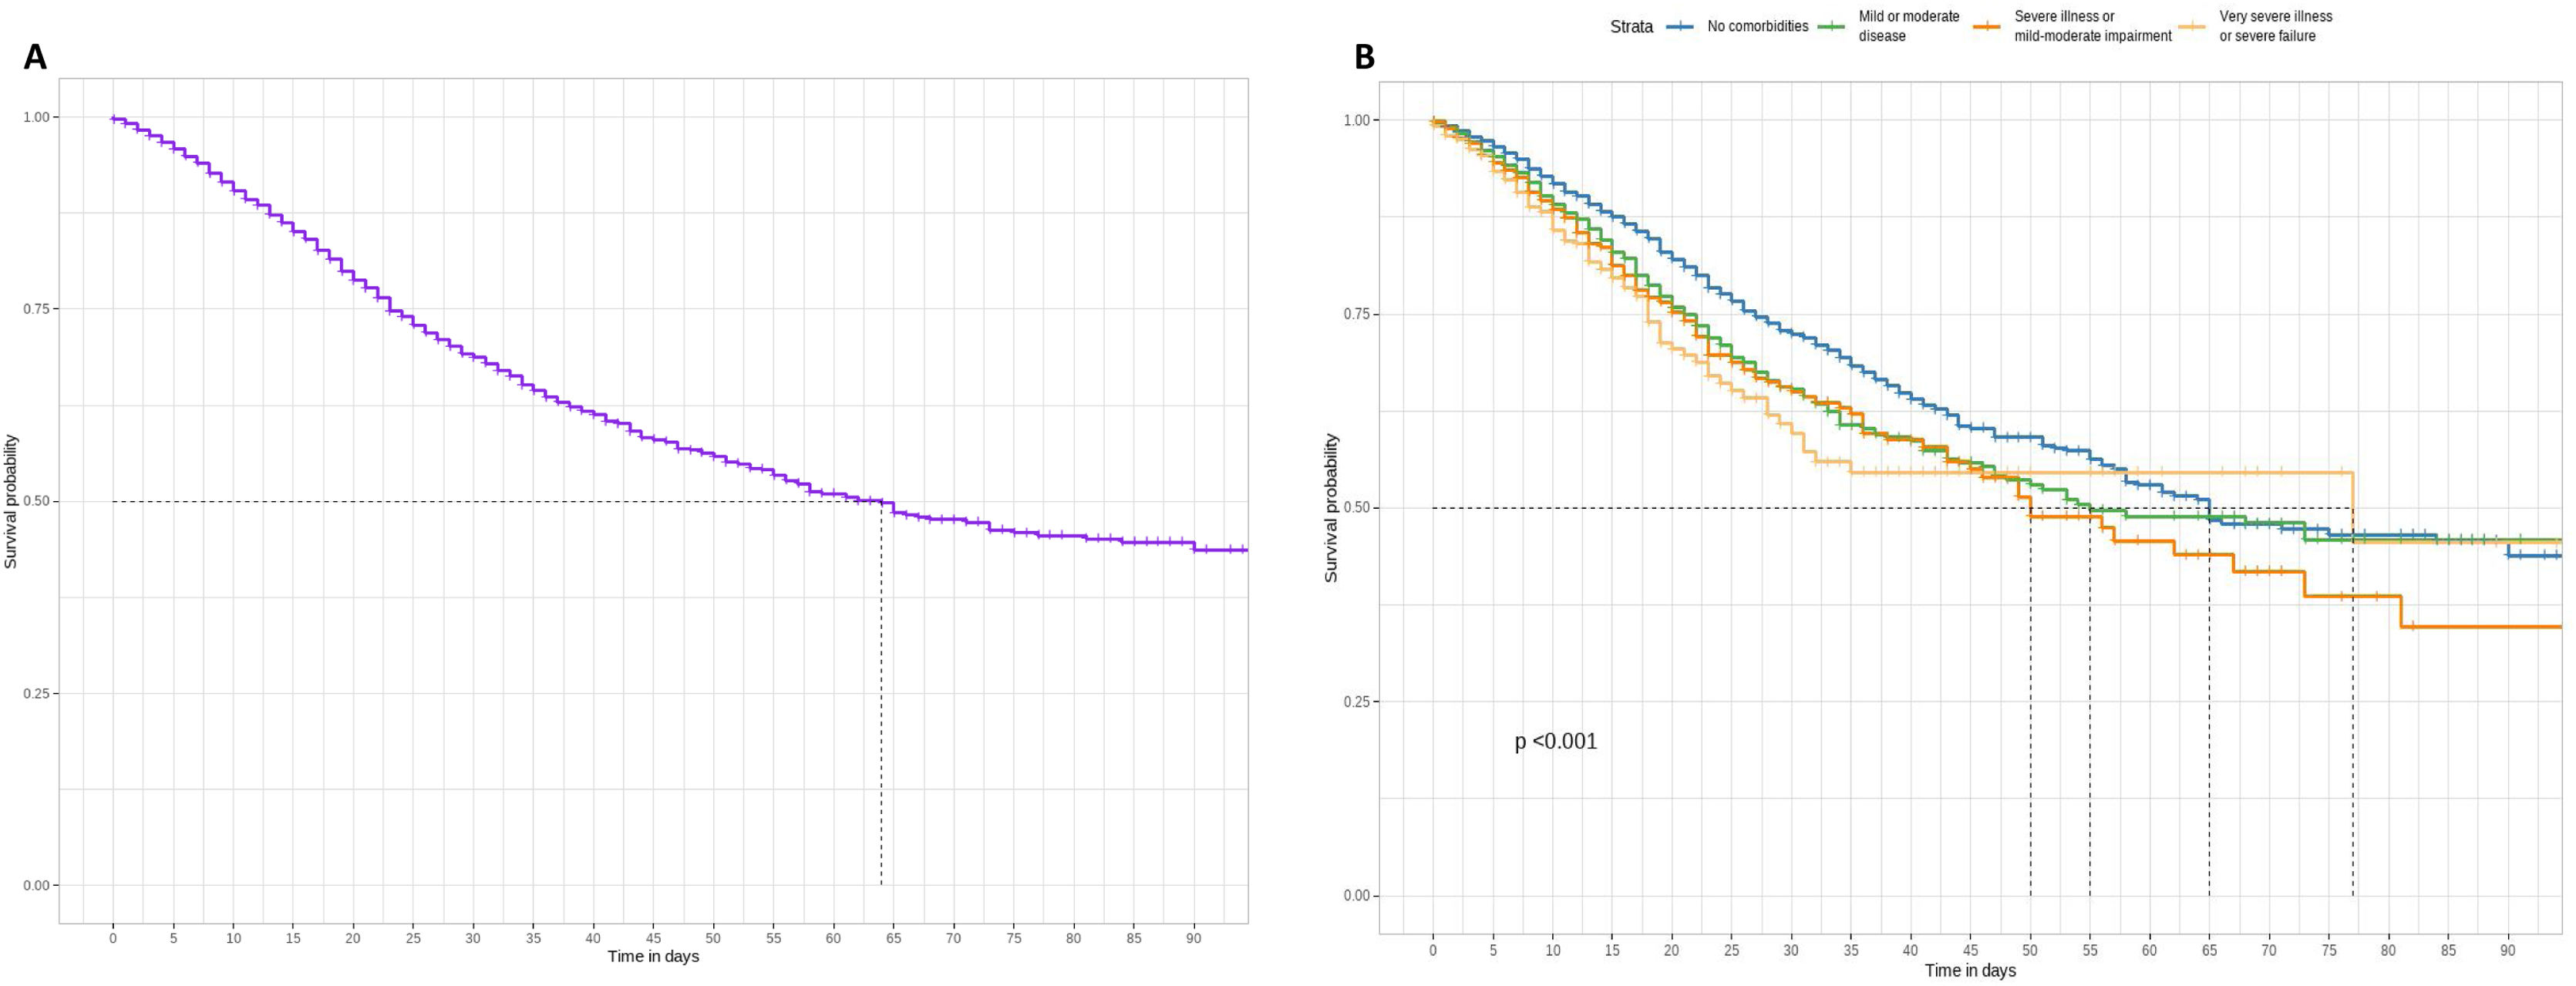
Patients’ survival according to comorbiditiesThe Kaplan–Meier estimate curve assessed the overall survival probability of patients (Fig. 2A) and those with varying severity levels according to the Charlson Comorbidity Index (CCI) (Fig. 2B). At day 64, the survival probability for all individuals is 50%, with a decline to approximately 40% survival until day 90. Stratifying by groups revealed significant differences in survival probability. Individuals without comorbidities exhibited notably higher survival probability for 90 days compared to the remaining groups (mild or moderate disease, severe illness or mild–moderate impairment, and very severe illness or severe failure). Conversely, the other groups (mild or moderate disease, severe illness or mild–moderate impairment, and very severe illness or severe failure) did not exhibit a significant difference over time compared to the patients. Up to day 57, the survival of the no comorbidities group surpassed all others except for severe illness or mild–moderate impairment, which showed a slightly smaller difference from the other groups at day 57. Beyond 90 days, the survival probability remains at 50% for individuals without comorbidities, mild or moderate diseases, or very severe illness or severe failure.
 and according to the Charlson index groups (B): no comorbidities (score 0), mild or moderate disease (scores 1–2), severe disease or mild–moderate failure (scores 3–5), very severe disease or severe failure (scores 6–14). Log-rank test was used to compare the different survival curves (significant levels: NS p≥0.05; *p<0.05; **p<0.01; ***p<0.001).")
Kaplan–Meier survival curve of whole individuals (A) and according to the Charlson index groups (B): no comorbidities (score 0), mild or moderate disease (scores 1–2), severe disease or mild–moderate failure (scores 3–5), very severe disease or severe failure (scores 6–14). Log-rank test was used to compare the different survival curves (significant levels: NS p≥0.05; *p<0.05; **p<0.01; ***p<0.001).
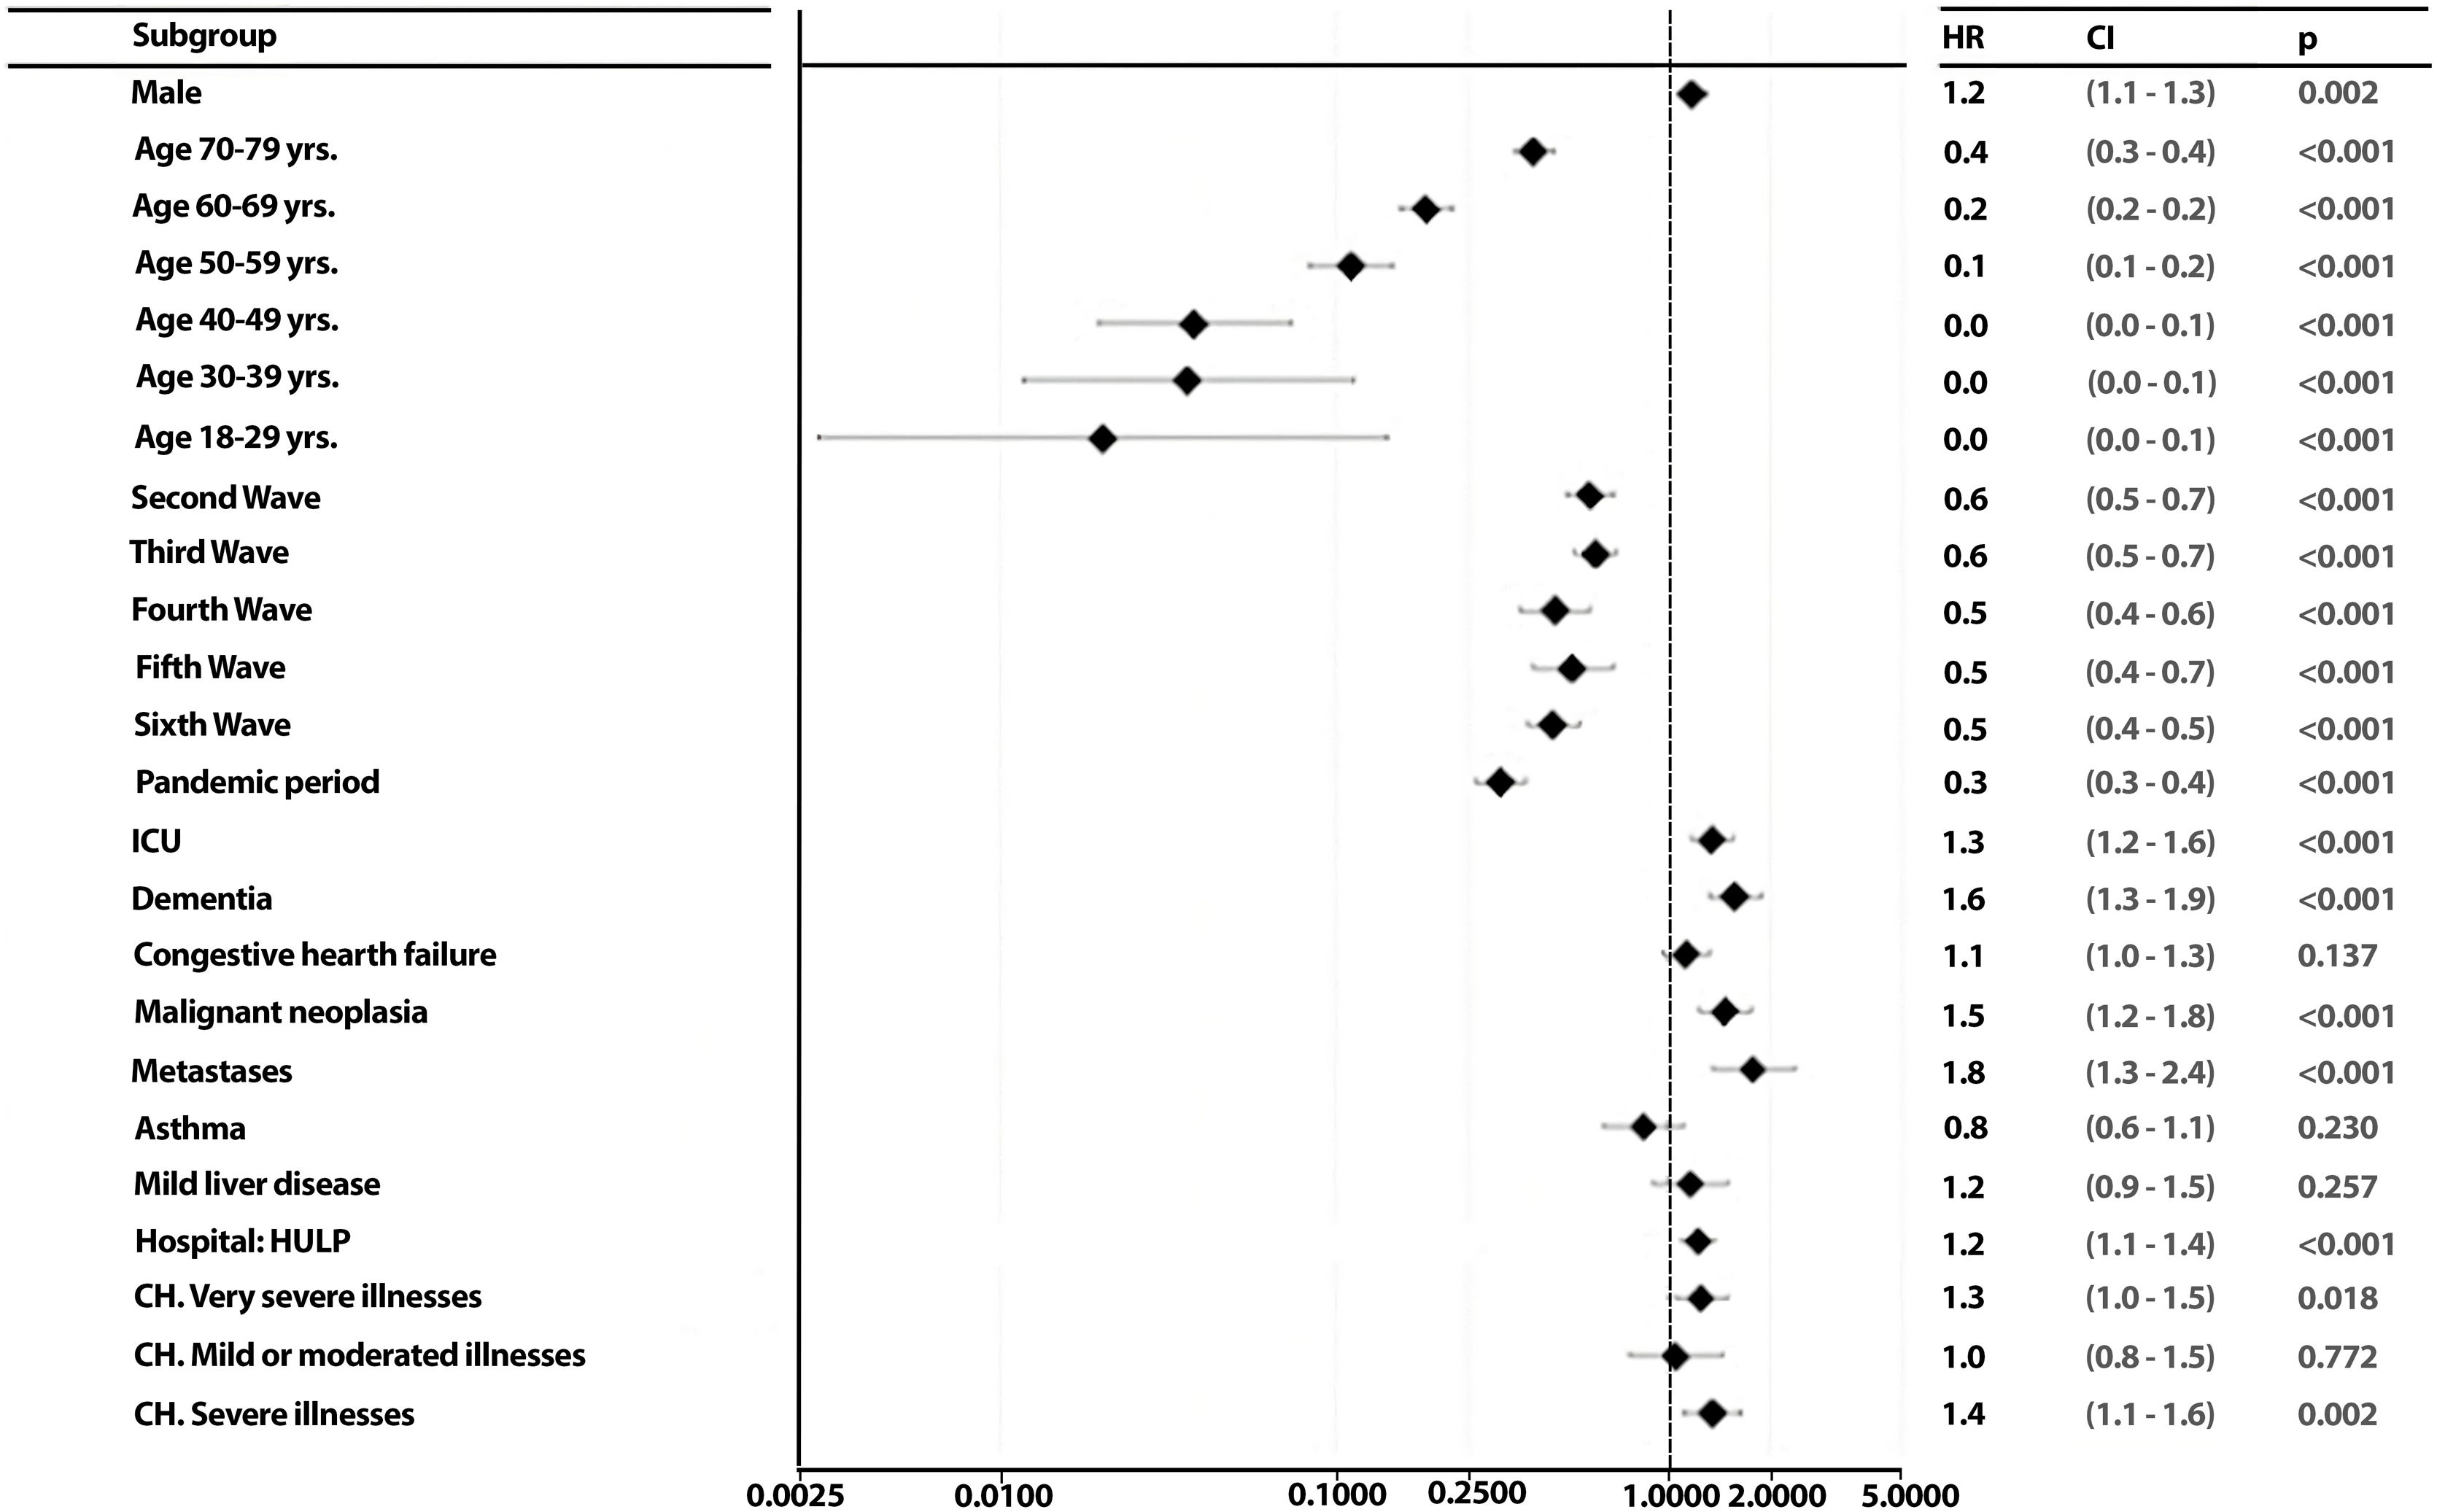
To identify the possible predictors of patient outcome and to assess whether these predictors change for each wave, a backward stepwise regression was conducted. Starting with 44 variables that might theoretically be good predictors of patient death, a backward stepwise regression model reduced them to 23 that were significant for at least one of the two hospitals or both together (HM network and La Princesa Hospital). Once the relevant variables in patient death were identified, the effects of the independent variables associated with patient death by calculating the hazard ratios through Cox regression models (Fig. 3). In multivariate analysis, gender, age range, wave, ICU, comorbidities (dementia, congestive heart failure, malignant neoplasia, metastases), hospital of origin and CCI group were good predictor of patient death (Fig. 3). Within these, the variables gender, ICU, dementia, congestive heart failure, malignant neoplasm and metastasis, and the category of having severe or very severe illnesses (in the Charlson index) were risk factors associated with death. While younger age ranges, waves 2–7 were protective factors against COVID death. Upon conducting an individualized analysis for each group, it was noted that the HM network exhibited a higher number of predictor variables for mortality. It was observed that nearly all factors maintained a consistent directionality as those identified for the HM network. The exception was observed in the CH groups, where having mild or moderate illnesses emerged as a risk factor in this hospital, contrasting with the protective nature associated with severe or very severe illnesses groups (eFigs. 3 and 4).
Discussion of in-hospital mortality according to patients’ characteristics.")
As the pandemic evolves, the emergence of new variants and the continued spread of the virus underscore the persistent uncertainties surrounding clinical risk factors associated with SARS-CoV-2 infection.11 A comprehensive review of our experiences becomes crucial for refining strategies to better navigate future pandemics and the emergence of new virus variants.18,19 In our study, spanning from January 28, 2020, to December 31, 2022, we present data on factors influencing in-hospital mortality among COVID-19 patients in two Spanish hospitals.
Analysing 13,974 COVID-19 patients, our study reveals demographic and outcome variations across pandemic waves (Table 1; Fig. 1). After the 1st wave, where the frequency of hospital admissions doubled that of subsequent waves, the mean number of days of admitted patients have increased until the 4th wave, decreasing from the 5th waves, which can be explained by the decreasing percentage of ICU patients finally dead from the 5th wave among ICU patients (Table 1). Patients’ mean age peaked in the pandemic period and declined in the 5th wave. Females comprised 45.3%, with varying proportions across waves. Hospital outcomes exhibited a mean stay of 10.9 days, 9.3% ICU admissions, and 11.3% deaths, with significant variations by wave. Notably, the 5th wave had the highest ICU admissions (14.4%), while the 1st wave had the highest mortality (32.1%) (Fig. 2). These findings suggest potential factors such as vaccination progress, virus adaptation, or improved treatment efficacy influencing outcomes.
The results showed that the proportion of men admitted was consistently higher than that of women, agreeing with previous studies,20 which reflects the higher proportion of women over 80 years old in Madrid's population.18 Our study also showed worse disease prognosis among older adults likely as a result of a higher frequency of their comorbidities at an older age.21
Comorbidities were prevalent, with cardiometabolic and pulmonary diseases leading the list. These comorbidities varied significantly across waves, with hypertension and diabetes consistently prevailing within each group. The prevalence of hypertension and diabetes among hospitalised COVID-19 patients was consistent with previous studies.22–24 In addition, survival analysis underscored lower survival for patients with very severe comorbidities. Predictors of patient outcomes included gender, age range, wave, ICU, specific comorbidities, hospital of origin, and Charlson Comorbidity Index group. Risk factors for death included gender, ICU admission, dementia, congestive heart failure, malignant neoplasm, metastasis, and the presence of severe or very severe comorbidities.
Notably, the identification of dementia as a potential predictor for mortality aligns with previous studies highlighting it as a risk factor for in-hospital mortality.25 Dementia patients are typically elderly and vulnerable individuals who require assistance from others for their daily living activities. In addition, they often have multiple comorbidities, which places them at a higher risk of hospitalization and mortality due to viral and bacterial infections, as compared to individuals with other diseases.9,26 Nevertheless, dementia was not the comorbidity most associated with mortality, but metastatic cancer was the disease with the greatest impact on patient's mortality. This result may be due to the metastases itself and/or its therapy, as these patients are more likely to develop bacterial co-infections.26
Conversely, younger age ranges and waves 2–7 were protective factors. Notably, the HM network exhibited more predictor variables for mortality. These findings underscore the dynamic nature of COVID-19 outcomes and emphasize the importance of considering demographic and clinical factors in predicting patient mortality.
When interpreting our study outcomes, it is crucial to acknowledge their limitation to events during the inpatient period (up to 90 days). Our study population comprises patients from a major public hospital in Madrid, along with several smaller private hospitals. In the HM hospital network, there's potential bias in reported outcomes due to the size and services offered, impacting the representation of patient admissions and outcomes. It is important to note that this mixture of hospital settings introduces a potential limitation in our study. The public-private dichotomy, coupled with variations in bed capacity, may pose challenges in direct comparability. While we have strived to ensure a representative sample and conducted separate analyses for each hospital to account for their unique characteristics (eFigs. 3 and 4), the inherent differences in these healthcare settings could still influence the generalizability of our findings. These limitations underscore the necessity for a cautious interpretation and the consideration of the diverse healthcare contexts encompassed in our study.
Considering the differences in profile between different pandemic waves, beyond the presented explanations (vaccination, host adaptation, or new treatments), there are other justifications to consider. These include advances in knowledge about the disease, varying patient profiles among regions or reference populations (especially in the early waves), changes in patient profiles in subsequent waves (lower average age from the 4th wave onward), differences between centres in hospital admission criteria (particularly significant in the Community of Madrid, where the majority of reference hospital beds in the study are located). All of these factors contribute to the complexity of our findings and should be acknowledged when interpreting the study's implications.
In conclusion, our study successfully identifies risk factors linked to COVID-19 mortality among patients in Spanish hospitals, such as advanced age, comorbidities, and specific conditions. These insights provide valuable information for healthcare practitioners and policymakers, assisting in the development of targeted strategies to mitigate mortality risks in future waves of the pandemic.
Ethical considerationsNot applicable as we only use administrative, anonymised official data.
FundingThis project is funded by the European Union's Horizon 2020 Research and Innovation Programme (Grant Agreement No. 101016216).
Conflict of interestThe authors declare there are no conflicts on interest to report related with this research.
We thank the UnCoVer team for their invaluable contributions to this project.
The following are the supplementary data to this article:
