


To assess the diagnostic significance of prostate-specific antigen (PSA), density (PSAD) accuracy, and PSAD adjusted by transition zone volume (PSATZD) in men with PSA levels between 2.0 and 4.0ng/ml.
MethodsBetween 2000 and 2010, 138 men with PSA levels between 2 and 4.0ng/ml underwent transrectal ultrasonography (TRUS) and 12-core prostate biopsy. Diagnostic accuracies for various cut-offs of PSAD and PSATZD were investigated according to subdivided PSA levels of 2.0–3.0ng/ml and 3.1–4.0ng/ml.
ResultsThe detection rate of prostate cancer was 23, 8% (32/134). The percentage of patients with extracapsular disease was 28.1% (10/32) and primary Gleason grade 4 or 5 was obtained in 8/32 cases (25%) patients. The transition zone volume and PSATZD in cancer cases were significantly different in comparison with those in non-cancer cases. The area under the receiver operating characteristic curve for PSATZD was significantly higher in comparison with that for PSAD in the same subdivided PSA ranges. The diagnostic efficiency for PSATZD was higher than that for PSAD. The diagnostic efficiency showed the highest value at the cut-off level for PSATZD of 0.23 and 0.28 in men with PSA levels of 2.0–3.0ng/ml and 3.1–4.0ng/ml, respectively.
ConclusionsThe use of PSATZD cut-offs as a biopsy indication may reduce many unnecessary biopsies without missing most prostate cancer cases in the PSA range of 2.0–4.0ng/ml.
Evaluar la significancia diagnóstica del PSA, de su densidad (PSAD) y de la PSAD ajustada por el volumen de la zona de transición (PSATZD) en hombres con niveles de PSA entre 2,0 y 4,0 ng/ml.
MétodosEntre el 2000 y el 2010, 138 hombres con niveles de PSA entre 2,0 y 4,0 ng/ml fueron sometidos a ultrasonografía transrectal (TRUS) y biopsia prostática de 12 fragmentos. Se investigó la precisión diagnóstica de varios puntos de corte de la PSAD y de la PSATZD en rangos de PSA de 2,0 a 3,0 ng/ml y de 3,1 a 4,0 ng/ml.
ResultadosLa tasa de detección del cáncer de próstata fue de 23,9% (32/134). El porcentaje de pacientes con enfermedad extracapsular fue de 28,1% (10/32) y se obtuvo primarios de grado Gleason 4 o 5 en 8 de 32 casos (25%). El volumen de la zona de transición y la PSATZD en los casos de cáncer fueron significativamente diferentes en comparación con los obtenidos en los casos sin cáncer. El área bajo la curva de la característica operativa del receptor (ROC) de la PSATZD fue significativamente mayor que la de la PSAD en los mismos rangos de subdivisión del PSA. La eficiencia diagnóstica de la PSATZD fue mayor que la de la PSAD. La eficiencia diagnóstica fue mayor en los niveles de corte de PSATZD de 0,23 y 0,28 en hombres con valores de PSA de 2,0 a 3,0 ng/ml y de 3,1 a 4,0 ng/ml respectivamente.
ConclusionesEl uso de puntos de corte de la PSATZD como indicación para biopsias evitaría muchas biopsias innecesarias sin pasar por alto la mayor parte de cánceres de próstata en el rango de PSA de 2,0 a 4,0 ng/ml.
The cut-off point of 4.0ng/ml for the prostate specific antigen (PSA) has been and is the most important and widely used value in screening, detection, and monitoring of prostate cancer. However, Partin et al.1 showed an unexpectedly high percentage of cases with extracapsular disease despite having PSA levels between 2.0 and 4.0ng/ml, and they were maintained with a high probability of cure.2–6 A previous study also showed that 65% of the cases were multifocal and 34% already had a high potential for malignancy in prostate cancers detected with PSA levels of 4.0ng/ml or less.7
Due to the limited sensitivity and specificity of the PSA, we have used different approaches, such as the percentage of free PSA, PSA velocity, and PSA density, in order to improve the diagnostic validity of an elevated PSA level.3,8 However, the percentage of men with PSA levels greater than 2.0ng/ml is high, about 32% in a PSA-based screening for prostate cancer.9 The percentage of men with PSA levels greater than 2.0ng/ml was higher than that of the subjects who died of prostate cancer. Therefore, prostate biopsy should not be performed in all men with PSA levels between 2.0 and 4.0ng/ml. Catalona et al.3 showed that the use of the free/total PSA ratio could prevent unnecessary biopsies in subjects with PSA levels between 2.0 and 4.0ng/ml. However, further studies would be needed to improve the diagnostic accuracy of prostate cancer in the PSA ranges between 2.0 and 4.0ng/ml. In the present study, we investigated the usefulness of PSA parameters associated with prostate volume, PSA density (PSAD), and PSAD adjusted by the volume of the transition zone (PSATZD) to find a solution to this issue.
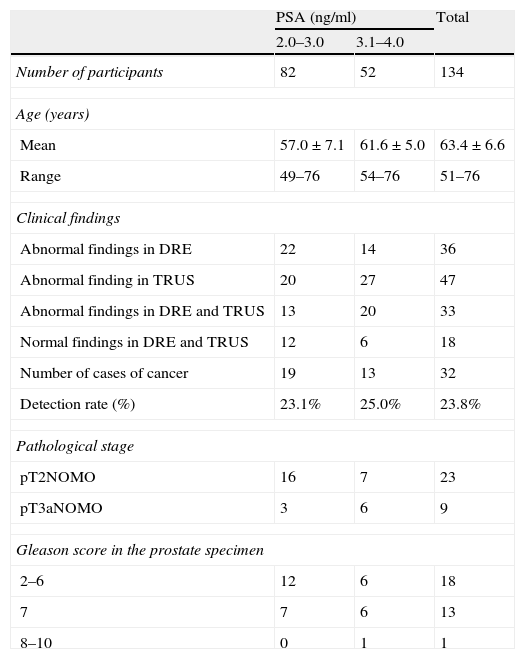
Material and methodsBetween June 2003 and March 2010, 839 men were subjected to PSA measurements, digital rectal examination (DRE) and transrectal ultrasonography (TRUS) in a mass screening for prostate cancer in medical centers or in the clinic of the Military University Hospital. A total of 134 men (16.3%) had PSA levels between 2.0 and 4.0ng/ml. Of these, we selected 69 men who were subjected to prostate biopsy because of abnormal findings on the DRE/TRUS or for exclusion of prostate cancer prior to radical cystectomy due to bladder cancer or transurethral resection of the prostate for clinical diagnosis of benign prostatic hyperplasia (BPH). All patients were biopsied for the first time. There were no cases with a previous or present history of prostate cancer screening or treatment for BPH. Of these 134 patients, 34 men (25.1%) had abnormal findings on the DRE or TRUS, and 100 (74.9%) had no suspicious findings of cancer in any of the two examinations (Table 1). The age was between 48 and 76. In the screening, the PSA levels were measured using Tosoh II PA equipment. All PSA values were converted to values of the Tandem R PSA equipment using the following formula: PSA (Tandem-R)=0.963×PSA (Tosoh)−0.123, PSA (Tandem-R)=3.303×PSA (Markit)−0.585 (data not shown). All the participants underwent systematic sextant needle biopsies and two additional biopsies in the transition zone. We also performed an additional biopsy guided by UTRS in the hypocycloid region and another additional biopsy guided by DRE in the nodular region. The total volume of the prostate was calculated by the method of the three axes (length×width×height×0.52) and the volume of the transition zone was calculated by the method of the two axes (width×width×height×0.52). All the prostate and transition zone volumes were calculated by the same urologist. The PSAD and PSATZD were calculated to divide the serum PSA levels between the total prostate volumes and the transition zone, respectively. All the TRUS procedures were performed using the Bruel and Kjaer model with a biplane endorectal probe of 7.5MHz. All the biopsies were performed with an 18-gauge biopsy needle and a spring-loaded biopsy instrument (Bard Urological, Covington, GA, U.S.A.). We used the 1997 VICC TNM classification of prostate carcinoma. The Gleason scores of all prostate cancer cases were reviewed again by a single urological pathologist for this study.
Clinical findings in all participants and clinicopathological features in patients with prostate cancer.
| PSA (ng/ml) | Total | ||
| 2.0–3.0 | 3.1–4.0 | ||
| Number of participants | 82 | 52 | 134 |
| Age (years) | |||
| Mean | 57.0±7.1 | 61.6±5.0 | 63.4±6.6 |
| Range | 49–76 | 54–76 | 51–76 |
| Clinical findings | |||
| Abnormal findings in DRE | 22 | 14 | 36 |
| Abnormal finding in TRUS | 20 | 27 | 47 |
| Abnormal findings in DRE and TRUS | 13 | 20 | 33 |
| Normal findings in DRE and TRUS | 12 | 6 | 18 |
| Number of cases of cancer | 19 | 13 | 32 |
| Detection rate (%) | 23.1% | 25.0% | 23.8% |
| Pathological stage | |||
| pT2NOMO | 16 | 7 | 23 |
| pT3aNOMO | 3 | 6 | 9 |
| Gleason score in the prostate specimen | |||
| 2–6 | 12 | 6 | 18 |
| 7 | 7 | 6 | 13 |
| 8–10 | 0 | 1 | 1 |
PSA: prostate specific antigen; DRE: digital rectal examination; TRUS: transrectal ultrasonography.
We divided the PSA levels from 2.0 to 3.0ng/ml and from 3.1 to 4.0ng/ml. Then, we investigated the usefulness of the PSAD and PSATZD as indicators for biopsy using ROC curves. The diagnostic efficiency was calculated using the following formula: diagnostic efficiency (%)=sensitivity (%)×specificity (%)/100. The differences were considered significant when p was <0.05 using the Mann–Whitney U test or the χ2 test.
ResultsThe overall detection rate of prostate cancer was high (23.8%; 32/134). The ages and clinical findings of all participants, as well as grading and pathological findings, are presented in Table 1. The detection rate was 23.1 and 25.0%, respectively, in men with PSA levels of 2.0–3.0 and 3.1–4.0ng/ml. The stage was T1c in 24/32 cases (75.0%) and T2a in 8 cases (25.0%). The clinical stage distribution was not significantly different between cases with PSA levels between 2.1 and 3.0 and those between 3.1 and 4.0ng/ml. We obtained primary Gleason grades 4 or 5 in prostate specimens of 26.7% of cases.
We compared the prostate volume, the PSAD, and the PSATZD between cases with and without prostate cancer. The mean PSA and PSAD were not significantly different between the cases with and without prostate cancer. On the other hand, the total prostate volumes, transition zone volumes, and PSATZD were significantly different between both groups.
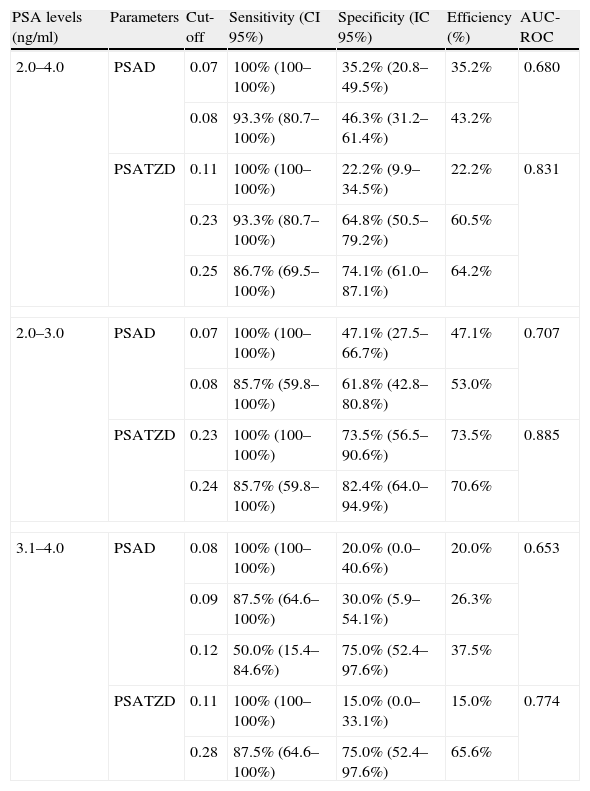
Table 2 shows the comparison on diagnostic reliability between PSAD and PSATZD. The area under the ROC curve (AUC-ROC) for the PSATZD was significantly higher than that for the PSAD in the PSA range between 2.0 and 4.0ng/ml (p<0.05). The diagnostic efficiency was highest at the cut-off level for PSAD between 0.08 and 0.12ng/ml in men with PSA levels between 2.1 and 3.0ng/ml, and between 3.1 and 4.0ng/ml, respectively. The diagnostic efficiency of the PSATZD was relatively high in comparison to that of the PSAD in the range of PSA 2.1–4.0ng/ml. The diagnostic accuracy was highest at the cut-off point for PSATZD of 0.23 and 0.28ng/ml in men with PSA levels of 2.0–3.0ng/ml and 3.1–4.0ng/ml, respectively. In men with PSA levels of 2.0–3.0ng/ml, the cut-off point for PSAD of 0.07ng/ml had 100% sensitivity and 47.1% (16/34) specificity. The cut-off point for PSATZD of 0.23ng/ml had 100% sensitivity and a relatively high specificity of 73.5% (27/34). In men with PSA levels between 3.1 and 4.0ng/ml, the cut-off point for PSAD of 0.09ng/ml resulted in 87.5% (7/8) sensitivity and high specificity of 75.0% (15/20). If the sensitivity were set at 100 and 93%, the number of unnecessary biopsies would decrease to 78 (42/54) and 35% (19/54), respectively, in combination with cut-off levels for PSATZD in men with PSA levels between 2.0 and 4.0ng/ml.
Sensitivity, specificity, and efficiency on the cut-off points of PSA parameters related to the prostate volume.
| PSA levels (ng/ml) | Parameters | Cut-off | Sensitivity (CI 95%) | Specificity (IC 95%) | Efficiency (%) | AUC-ROC |
| 2.0–4.0 | PSAD | 0.07 | 100% (100–100%) | 35.2% (20.8–49.5%) | 35.2% | 0.680 |
| 0.08 | 93.3% (80.7–100%) | 46.3% (31.2–61.4%) | 43.2% | |||
| PSATZD | 0.11 | 100% (100–100%) | 22.2% (9.9–34.5%) | 22.2% | 0.831 | |
| 0.23 | 93.3% (80.7–100%) | 64.8% (50.5–79.2%) | 60.5% | |||
| 0.25 | 86.7% (69.5–100%) | 74.1% (61.0–87.1%) | 64.2% | |||
| 2.0–3.0 | PSAD | 0.07 | 100% (100–100%) | 47.1% (27.5–66.7%) | 47.1% | 0.707 |
| 0.08 | 85.7% (59.8–100%) | 61.8% (42.8–80.8%) | 53.0% | |||
| PSATZD | 0.23 | 100% (100–100%) | 73.5% (56.5–90.6%) | 73.5% | 0.885 | |
| 0.24 | 85.7% (59.8–100%) | 82.4% (64.0–94.9%) | 70.6% | |||
| 3.1–4.0 | PSAD | 0.08 | 100% (100–100%) | 20.0% (0.0–40.6%) | 20.0% | 0.653 |
| 0.09 | 87.5% (64.6–100%) | 30.0% (5.9–54.1%) | 26.3% | |||
| 0.12 | 50.0% (15.4–84.6%) | 75.0% (52.4–97.6%) | 37.5% | |||
| PSATZD | 0.11 | 100% (100–100%) | 15.0% (0.0–33.1%) | 15.0% | 0.774 | |
| 0.28 | 87.5% (64.6–100%) | 75.0% (52.4–97.6%) | 65.6% | |||
PSA: prostate specific antigen; PSAD: PSA density; PSATZD: PSAD adjusted by volumen of the transition zone; CI: confidence interval; AUC-ROC: area under the curve of receptor operative characteristics.
The introduction of the PSA measurement in clinical practice has increased the possibilities of diagnosis of localized prostate cancer. The current dilemma is deciding whether to perform a prostate biopsy to all men with PSA levels between 2.0 and 4.0ng/ml. The prediction of a positive biopsy and its clinical stage is still far from being optimal and it requires the combination of different variables and PSA isoforms. This approach of multiple parameters is essential, since the PSA value taken uniquely is not sufficiently precise due to interference of age and the conditions that often coexist, such as BPH and histological prostate inflammation in asymptomatic patients.1,2 Density parameters, i.e., PSAD and PSATZD are ratios which are obtained by dividing the PSA level by the total volume of the prostate and the volume of the transition zone. The influence regarding the non-malignant portion of the gland, which is believed to be responsible for the majority of PSA which is in the serum, should be reduced by this method.1,5 Both parameters were initially introduced to improve the diagnostic accuracy of PSA in the detection of cancer and its aggressiveness, but with inconsistent results.
The clinical use of these parameters for both applications has been severely criticized because of the limitations inherent to the TRUS. In fact, the commonly used ellipsoid formula is not considered an optimal method for calculating the volume of the prostate and the results are not easily reproducible, since the calculation of the volume depends on the operator and experience. Furthermore, most reports have used ROC curves, while a few have examined how the PSA and density variables can be additionally related to positive biopsy and pathological features of cancer.2,6 In this study, we prospectively compared the PSA and density parameters to the rate of cancer and the pathological features of the tumor by logistic regression analysis to assess which the most accurate predictor is and if the formula used to calculate the PSAD and PSADTZ really represents the amount of PSA produced by the tumor. Our results show that both the PSA and density parameters are significantly associated with positive biopsy with local extension and lymph node involvement and with the final Gleason score of the prostate specimen. We see increased production of PSA per gram depending on the grade of the tumor, possibly due to a progressively larger tumor volume, as reported by several authors.3,9
As to the special features of prostate cancer with PSA levels below 4g/ml, Catalona et al. showed that cancer was detected in 22% (73 out of 332 biopsies) of men with PSA serum levels between 2.0 and 4.0ng/ml. Of these cancers detected, the vast majority showed medically important tumor characteristics. Schroder et al. also said that a PSA cut-off level of 4.0ng/ml would miss a great number of cancers and that about half of those tumors would have aggressive characteristics and would be confined to the organ.2,9 Furthermore, Ito et al.,10 investigated the correlation between the clinical stage of prostate cancer and the years until the cancer was diagnosed after PSA levels increased from 4.0ng/ml. They showed that the risk of T3, N1, or M1 disease was significantly higher in prostate cancer cases detected with a screening interval of 2 or more years after PSA levels had increased from 4.0ng/ml than in those detected in the year when the PSA levels exceeded 4.0ng/ml.10,11
According to Partin tables, in cases with PSA levels between 2.0 and 4.0ng/ml, clinical stage T2aN0M0 and Gleason score (Gleason score: primary+secondary) in a biopsy specimen of 7 (4+3), it is expected that 33% show disease confined to the organ.4,7 Therefore, there may be candidates for prostate biopsy in men with PSA levels between 2.0 and 4.0ng/ml.
On the other hand, the proportion of clinical stages in the cases of prostate cancer detected in the PSA range of 2.0–4.0ng/ml in this study was similar to that observed in cases of prostate cancer detected a year after screening with PSA levels above 4.0ng/ml. Moreover, the percentage of men with PSA levels greater than 2.0ng/ml was high (32%; 3360/10,523) in a prostate cancer screening based on PSA in Europe.8,12 The percentage of men with PSA levels greater than 2.0ng/ml could be about 8 times greater than that in patients who died from prostate cancer, which is around 4%.13,14 Therefore, prostate biopsy should be recommended to all men with PSA levels between 2.1 and 4.0ng/ml and with abnormal findings on DRE/TRUS or highly suspicious findings on PSA-related parameters, such as PSAD or PSATZD. Catalona and co-workers15 showed that using the free/total PSA cut-off, 90% of cancers would have been detected, 18% of benign biopsies would have been avoided, with a positive predictive value of 24% in men who underwent biopsy. Therefore, measurements of serum free PSA may be useful in deciding whether to recommend a prostate biopsy. In addition, we propose a new algorithm for screening, which recommends extensive use of TRUS in men with PSA levels between 2 and 4ng/ml and without abnormal findings on DRE.16 This algorithm would improve diagnostic sensitivity for clinically significant prostate cancer without increasing the cost of screening for prostate cancer diagnosis. Therefore, the TRUS might be among the useful screening modes for screening men with PSA levels between 2.0 and 4.0ng/ml.17
Several previous studies demonstrated the clinical significance of the PSATZD to improve prediction of prostate cancer within this intermediate range of PSA. Zlotta et al.15 also showed that the use of the PSATZD may have additional value to identify which patients with clinically localized prostate cancer and with PSA levels lower than 10.0ng/ml had a high risk of extracapsular disease. Recently, Djavan et al.16 investigated the usefulness of the PSATZD and PSAD, comparing them with free/total PSA and other parameters related to the PSA in men with PSA levels of 2.5–4.0ng/ml. They demonstrated by ROC curve analysis that the PSAD and PSATZD were more useful than other parameters related to the PSA. With 95% sensitivity for detection of prostate cancer, the cut-off for PSAD was 41% and for PSATZD 0.095ng/ml, which would prevent unnecessary biopsies in 29.3 and 17.2% of cases in the ranges of 2.0–4.0ng/ml, respectively. However, the PSAD and PSATZD did not keep their predictive power in patients with a prostate of less than 30ml. In this study, the diagnostic reliability of the PSATZD was maintained in men with a relatively small prostate volume (32.3ml). The number of unnecessary biopsies would decrease to 64.8% (35/54) with a sensitivity of 93.3%, if the 0.23ng/ml cut-off was used for PSATZD in men with PSA levels between 2.1 and 4.0ng/ml.
The innovation of this study is that, surprisingly, even though the density parameters are adjusted PSA ratios according to total and transitional volumes of the prostate, both maintained significant relations with the greater part of volume parameters. The PSAD and PSATZD can be used as a powerful diagnostic tool for differentiating prostate cancer from BPH because prostate cancer releases more PSA into circulation per unit volume than the BPH.18 However, the mathematical formula for PSAD and PSATZD is not effective enough to eliminate the contribution of the PSA provided by the non-malignant portion of the gland, although the amount produced by cancer continues exerting its effect.
In conclusion, the clinical use of cut-off points for PSATZD could reduce the number of unnecessary biopsies without missing the majority of cases of prostate cancer in the PSA range of 2.0–4.0ng/ml. Discrimination between cases with intra- or extracapsular disease might be carried out only taking into account the percentage of positive nuclear biopsies. The PSA is responsible for fewer false negatives when making the staging than the PSATZD, possibly because the contribution of the PSA produced by the non-malignant portion of the gland is not eliminated by mathematical correction of the formula. The main limitation of our study was that the number of cases in our series without abnormal findings in both the PSA and the DRE and the TRUS was small; therefore, more studies should be performed to have a better approach to the role of the PSA density adjusted according to the volume of the transition zone in less significant cancers.
Conflict of interestThe authors declare that they have no conflict of interest.
Please cite this article as: Janane A, et al. Utilidad y valor predictivo de la densidad de PSA ajustada por el volumen de la zona de transición en hombres con niveles de PSA entre 2 y 4ng/ml. Actas Urol Esp.2012;36:93–98.
