


Magnesium phosphate cement (MPC) is an attractive alternative to Portland cement (PC) since it can also be obtained using by-products and wastes as raw materials. This research uses low-grade MgO (LG-MgO) as a magnesium source to obtain MPC, reducing CO2 emissions related to MPC production. The obtained binder can be referred to as “sustainable MPC” (sust-MPC). Moreover, this investigation incorporates a by-product obtained in the aluminium recycling process, named PAVAL® (PV). The addition of PV (5, 17.5, and 35wt.%) and water to solid (W/S) ratio (0.23, 0.25, 0.28, and 0.31) were studied in terms of mechanical and fresh properties, leaching behaviour, and microstructure to evaluate the degree of PV inclusion in the K-struvite matrix. The addition of PV into sust-MPC improves the mechanical behaviour of the micromortars, indicating a good inclusion of PV. The mechanical and fresh behaviour of the formulations, and BSEM-EDS analysis revealed the potential chemical interaction between Al and K-struvite matrix. The addition of 17.5wt.% of PV with a W/S of 0.25 showed the best mechanical performance (∼40MPa of compressive strength at 28 days of curing). The amount of PV should be lower than 17.5wt.% to classify it as non-hazardous material at the end-of-life.
El cemento de fosfato de magnesio (MPC) puede obtenerse empleando residuos y subproductos como materias primas, siendo una alternativa atractiva al cemento Portland (PC). Este estudio desarrolla un cemento de fosfato (MPC), mediante un subproducto de MgO (LG-MgO), que permite reducir las emisiones de CO2 y llamarlo «MPC sostenible» (sust-MPC). Además, incorporamos un subproducto obtenido del proceso de reciclaje del aluminio, PAVAL® (PV). Para evaluar el grado de inclusión del PV en la matriz de K-estruvita, se han estudiado propiedades en estado fresco, mecánicas, el potencial de lixiviación, y la microestructura de formulaciones con PV (5, 17,5 y 35% en masa) y relación agua sólido (W/S) (0,23, 0,25, 0,28 y 0,31). La adición de PV mejora el comportamiento mecánico de los micromorteros de sust-MPC, indicando buena inclusión del PV. El análisis BSEM-EDS, el comportamiento en fresco y mecánico de las formulaciones revela una potencial interacción entre el Al y la K-estruvita. La adición de 17,5% de PV con W/S de 0,25 presentó las mejores propiedades mecánicas (∼40 MPa de resistencia a compresión a 28 días de curado). Para clasificarlo como no peligroso al final de su vida útil, la adición de PV debe ser menor de 17,5%.
The global materials production in the construction sector is in continuous growth due to the increase in the population's standard of living and the development of emerging economies [1]. This phenomenon causes serious environmental problems such as natural resource depletion, and the generation of tailings from extractive activities. In addition, manufacturing construction materials such as Portland cement (PC), considered the global reference cement because of its worldwide use, requires high energy consumption, obtained mainly from fossil fuels. In this sense, PC production is responsible for approximately 7–11% of global anthropogenic CO2 emissions [2–7] and 3% of global energy consumption [8]. The worldwide cement demand is forecasted to increase by over 4.2Gt per year up to 2050 [9,10]. Hence, it is necessary to seek new sustainable cementitious materials to mitigate the environmental issues generated by PC.
Magnesium phosphate cement (MPC) is one of the most promising cementitious alternatives to replace PC due to its lower carbon footprint [11]. MPC is produced through an acid-base reaction between MgO and phosphate salts such as ammonium dihydrogen phosphate (NH4H2PO4, ADP) or/and monopotassium phosphate (KH2PO4, MKP) [12]. When MPC is prepared using pure caustic MgO, it is necessary to reduce the MgO reactivity by an additional thermal process [13] for obtaining a hard burnt (1000–1400°C) or dead MgO (1400–2000°C) [14]. Moreover, several studies demonstrate that magnesium potassium phosphate cement (MKPC) has some advantages, such as better strength development and lower drying shrinkage than magnesium ammonium phosphate cement (MAPC) [15–17]. The main reaction products obtained are known as struvite (MgNH4PO4·6H2O) or K-struvite (MgKPO4·6H2O) [18,19], as shown in Eqs. (1) and (2), respectively.
In the last decades, MPC has been widely used as an alternative binder to PC in the building and civil engineering field [20] and hazardous waste stabilisation [21,22] due to its quick setting, high early strength, and low drying shrinkage [23]. Recently, these properties also attracted the attention of researchers to develop new applications in 3D printing additive manufacturing [24], especially in the bioceramic and dentistry fields [25,26]. However, the MPC also presents some drawbacks, which limit its applicability compared to PC. The vast heat dissipation during hydration and MPC stability in water [27] are the most relevant issues to sort out in MPC manufacturing. For this reason, many studies evaluated the incorporation of alumina-rich products (metakaolin [28], bauxite [29], fly ash from coal-fired power plants [30,31], bentonite [32], among others) to improve the mechanical performance and water resistance of MPC. In addition, the presence of aluminium sulphate can prevent the formation of efflorescence when MPCs are not well formulated [33]. Several researchers claimed that MPC can be used as environmental-friendly material [34], and as a green and low carbon binder [35]. Besides, this kind of cement can include some residues [36,37]. However, some researchers reported that MPC might not be a such low carbon binder, due to the 1.23kg of CO2·emissions per kg of MPC (0.6697kg from MKP and 1.6kg from MgO) [38].
Accordingly, the present work aims to investigate new sustainable MPC (sust-MPC) using low-grade magnesium oxide (LG-MgO) and PAVAL® (PV) as magnesium and aluminium raw materials, respectively. The authors have already used LG-MgO in previous studies, obtaining substantial improvements in the thermal [39] and mechanical [40] properties of this kind of sust-MPC [41]. The optimal relationship between MKP and LG-MgO is inverted in comparison to conventional MPC formulated with pure MgO [42]. In addition, LG-MgO presents the proper reactivity and no further calcination is needed. In this manner, it is possible to assume that considering the above-mentioned numbers, sust-MPC emissions are much lower than conventional MPC emissions. Moreover, PV is a by-product generated after treating the salt slag produced during the aluminium recycling process [43] and can become a potential aluminium source in the MPC formulation.
The novelty of this study mainly lies in the use of this aluminium by-product in MPC manufacturing, particularly in sust-MPC. Recent studies have shown the potential applications of PV in the cement, ceramic, refractory, and building industries [44–46]. PV is also used as a precursor source in alkali activation technology because of its high reactive aluminium content [45–47]. In this sense, its commercialisation is subject to its chloride content, which cannot be higher than 2%, otherwise, it could only dispose of in a landfill [48]. Using LG-MgO and PV instead of dead burnt MgO and other aluminium-rich products such as metakaolin or bauxite promotes a new sustainable cement production which reduces natural resources extractive activities through industrial by-products valorisation. However, the formation of MPCs only with waste and by-products as raw materials has not been investigated yet, and it is essential to study these new materials to achieve sustainable cement production.
The main goal of this study is to evaluate the effect of PV addition as a micro-aggregate in developing new sustainable magnesium phosphate cement – PAVAL® micromortars (Sust-MPC-PV), and to evaluate the leaching potential of the materials at their end-of-life for their landfill classification and disposal.
Materials and methodsRaw materialsLG-MgO is a by-product obtained from the company Magnesitas Navarras, S.A. (located in the north of Spain, Zubiri) during the calcination process of natural magnesite (MgCO3) to produce MgO, which is used as a refractory material in the steelmaking industry as well as in the agricultural and livestock sectors. LG-MgO is collected as a fine brown powder in the cyclone dust air pollution control system during the calcination process. Magnesitas Navarras, S.A. produces around 0.26–0.30Mt per year of MgO for refractory purposes and collects 40–50kt per year of LG-MgO by-product. The worldwide MgO production is around 9Mt per year, which could be 1.5Mt of similar by-products like LG-MgO around the world.
PV was supplied by the company Befesa S.A. (Spain) in the form of hydrated black dust. The company collects around 0.36Mt per year of PV. It is expected than more of 1 Mt per year of this kind of by-product are generated in Europe. It is mainly composed of aluminium-rich oxide and hydroxide phases [46,47].
Previously to the mixing of the micromortars, PV was dried at 80°C and then milled in an alumina ball mill and sieved through an 80μm sieve in order to increase the surface area of the by-product. Consequently, both by-products were homogenised and quartered to ensure a uniform chemical composition of the material. The phosphate used was KH2PO4 acquired from Norken S.L., with a purity of 99.8wt.%. The commercial product is catalogued as a food-grade chemical, typically used as a soil fertiliser. Boric acid (H3BO3, HB) Optibor® technical grade was used as a setting retarder, acquired from Borax España, S.A.
Raw materials characterisationLG-MgO and PV were characterised to study their chemical composition by using X-ray fluorescence (XRF) with a Philips PW2400 X-ray sequential spectrophotometer. Particle size and specific surface area were determined through particle size distribution (PSD), using a Beckman Coulter LS 13 320, and BET (Brunauer, Emmett and Teller) method, using a Micromeritics Tristar 3000, respectively. The reactivity of LG-MgO was evaluated using the citric acid reactivity test (CART) by acid neutralisation. The main crystalline phases of the raw materials were determined by X-ray diffraction (XRD) using a PANalytical X’Pert PRO MPD Alpha1 powder diffractometer. In addition, both by-products were analysed using thermogravimetric analysis with derivative thermogravimetry (TG/DTG) using a TA Instruments Q600 SDT equipment to evaluate thermal stability. The experiments were performed in a nitrogen atmosphere (50mLmin−1) from 30 to 1200°C and at a heating rate of 10°Cmin−1.
The composition of PV and LG-MgO was estimated by combining XRF, XRD and TG/DTG results. Thus, XRF provided elemental composition in the form of oxides, XRD was used to identify chemical compounds, and TG/DTG provided weight losses which were used to estimate the wt.% of the compounds in the solid by stoichiometric calculus. XRF results were used to adjust the elemental composition to the remaining unexplained wt.% of the solids. In addition, the environmental performance of the end-of-life material was assessed using a granular leaching test following EN 12457-2 standard [49]. The potential release of As, Ba, Cd, Cr, Cu, Hg, Mo, Pb, Ni, Sb, and Zn was determined using an Inductively coupled plasma – optical emission spectrometry (ICP-OES) with a Perkin Elmer Optima 8300 or using inductively coupled plasma – mass spectrometry (ICP-MS) with a Perkin Elmer Nexion 350D, depending on the concentration of elements in the leaching solution.
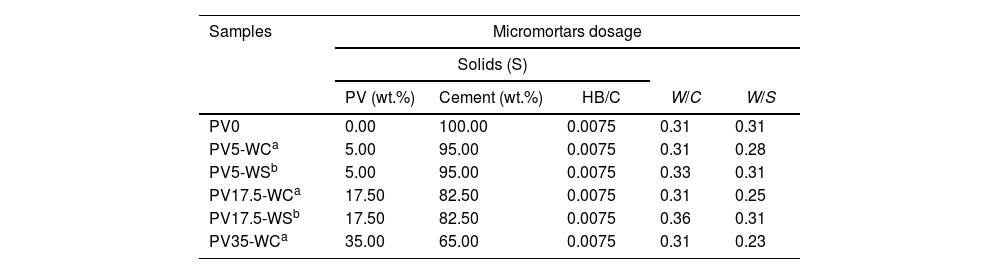
Sust-MPC-PV preparationThe micromortars formulations under study are presented in Table 1. For all the formulations the LG-MgO/KH2PO4 ratio of the cement precursors (C) was fixed as 60/40, and the HB/C ratio was also fixed to 0.0075 based on a previous study [41]. On the one hand, PV was added into cement precursors in additions of 5, 17.5 and 35wt.% with W/C=0.31 ensuring a workable state of the pastes based on preliminary experiments, from now on referred to as WC-formulations due to the constant W/C ratio. On the other hand, another experimental series were prepared to achieve the same workability range of PV0 formulation. In this manner, these other formulations were prepared by considering the same water/solid ratio (W/S) of PV0, where the solid (S) is the total amount of LG-MgO, KH2PO4, PV, and HB. Only PV5-WS and PV17.5-WS were considered in the present series because of the huge amount of water needed in the case of PV35-WS (W/C∼0.42). PV5-WS and PV17.5-WS were formulated with W/C ratios of 0.33 and 0.36, respectively. From now on referred to as WS-formulations due to the constant W/S ratio. It is noted that the abbreviations PV, WC, and WS stand for PV in sust-MPC micromortars, constant W/C ratio of 0.31, and constant W/S ratio of 0.31, respectively; and the numbers ‘0’, ‘5’, ‘17.5’, and ‘35’ for the wt.% of PV used in this series. WC-formulations present a significant linear trend decrease of W/S ratio in front of PV wt.%, and WS-formulations present a significant linear trend increase of W/C ratio in front of PV wt.%.
Sust-MPC-PV formulations.
All solid raw materials were added simultaneously and mixed in a planetary mixer until homogenised to obtain each micromortar sample. Afterwards, water was added, and the mixture was mixed for 90 s. Subsequently, the mixtures were poured into 40mm×40mm×160mm expanded polystyrene prismatic moulds in triplicate and vibrated for 10 s. The specimens were demoulded after 1 day and cured for 28 days at a temperature of 25±0.5°C and a R.H. of 50±3%.
Sust-MPC-PV characterisationFluidity (mini-slump test [50]) and setting time (Vicat needle test based on EN 196-3 [51]) were determined after pouring the mixtures into the prismatic moulds. Both properties were determined by using the remaining mixture of each formulation batch. In addition, micromortars fresh apparent density was evaluated from the same batches.
To evaluate the setting temperature new batches were prepared. The same mass of cement formulations was weighted and placed into adiabatic flasks, and then PV was added over the cement and homogenised. After adding the water, the formulations were mixed and a thermocouple was introduced to monitor in situ temperature during mixing and setting. The temperature during setting is an important parameter to consider for a real set-up scenario of these kinds of micromortars.
The apparent density and shrinkage of the Sust-MPC-PV were determined by measuring and weighing the prismatic samples after 28 days of curing. Modulus of Elasticity (MOE) was evaluated using the harmonic frequencies method [52]. Open porosity (OP) was determined following the EN 1936:2007 [53]. Flexural strength (FS) and Compressive Strength (CS) were determined at 28 days of curing using an Incotecnic MULTI-R1 universal test machine according to EN 196-1 [54]. The relation between the last mentioned physical properties is important to understand the overall mechanical behaviour of the micromortars [55]. In addition, leaching tests were performed following EN 12457-2 [49] using micromortars fragments under 4mm to evaluate the leaching potential of the materials at their end-of-life for landfilling classification and disposal. All tests were performed in triplicate. The specimen fragments derived from the CS test were adequately prepared and carbon-coated to observe the inner section of the micromortars using backscattered scanning electron microscopy (BSEM), and energy-dispersive X-ray spectroscopy (EDS, BSEM-EDS) to perform line scans in order to observe the degree of embedment of PV particles into K-struvite matrix.
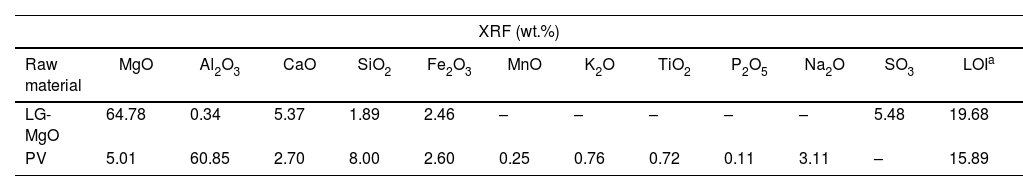
Results and discussionRaw materials characterisationElemental composition and particle size characterisationThe elemental composition of the raw materials was analysed by XRF, BET, PSD, and CART, as it is shown in Table 2. LG-MgO presents 64.78wt.% of MgO, being magnesium the most abundant element, followed by sulphur (5.48wt.% as SO3) and calcium (5.37wt.% as CaO). The sulphur comes from petroleum coke used as fuel in the combustion kiln during the MgO production process [56]. PV is mainly composed of aluminium (60.85wt.% as Al2O3) followed by magnesium (5.01wt.% as MgO) mainly in the form of spinel MgAl2O4 as it will be shown in XRD analysis (see Fig. 1). PSD results exhibit particle diameters below 100μm for both raw materials. The raw material with a higher specific surface area was PV (16.02m2g−1), followed by LG-MgO (12.90m2g−1). The CART was conducted just for LG-MgO, reaching pH 9 at 25min, which is characteristic of dead burned MgO [57]. In this manner, it can be concluded that the LG-MgO reactivity is suitable to develop K-struvite cements, and no thermal processes are required to achieve a proper setting of the micromortars [58]. Hence, the use of LG-MgO by-products instead of pure caustic MgO could reduce the cost and enhance the environmental and sustainable criteria.
Raw materials characterisation.
| XRF (wt.%) | ||||||||||||
|---|---|---|---|---|---|---|---|---|---|---|---|---|
| Raw material | MgO | Al2O3 | CaO | SiO2 | Fe2O3 | MnO | K2O | TiO2 | P2O5 | Na2O | SO3 | LOIa |
| LG-MgO | 64.78 | 0.34 | 5.37 | 1.89 | 2.46 | – | – | – | – | – | 5.48 | 19.68 |
| PV | 5.01 | 60.85 | 2.70 | 8.00 | 2.60 | 0.25 | 0.76 | 0.72 | 0.11 | 3.11 | – | 15.89 |
| Raw material | PSD | BET | CARTb | ||
|---|---|---|---|---|---|
| d10 (μm) | d50 (μm) | d90 (μm) | (m2g−1) | (min) | |
| LG-MgO | 0.89 | 16.92 | 92.83 | 12.90 | 25.00 |
| PV | 1.16 | 10.29 | 32.99 | 16.02 | – |
 and PV (b). (Colour in print and web).")
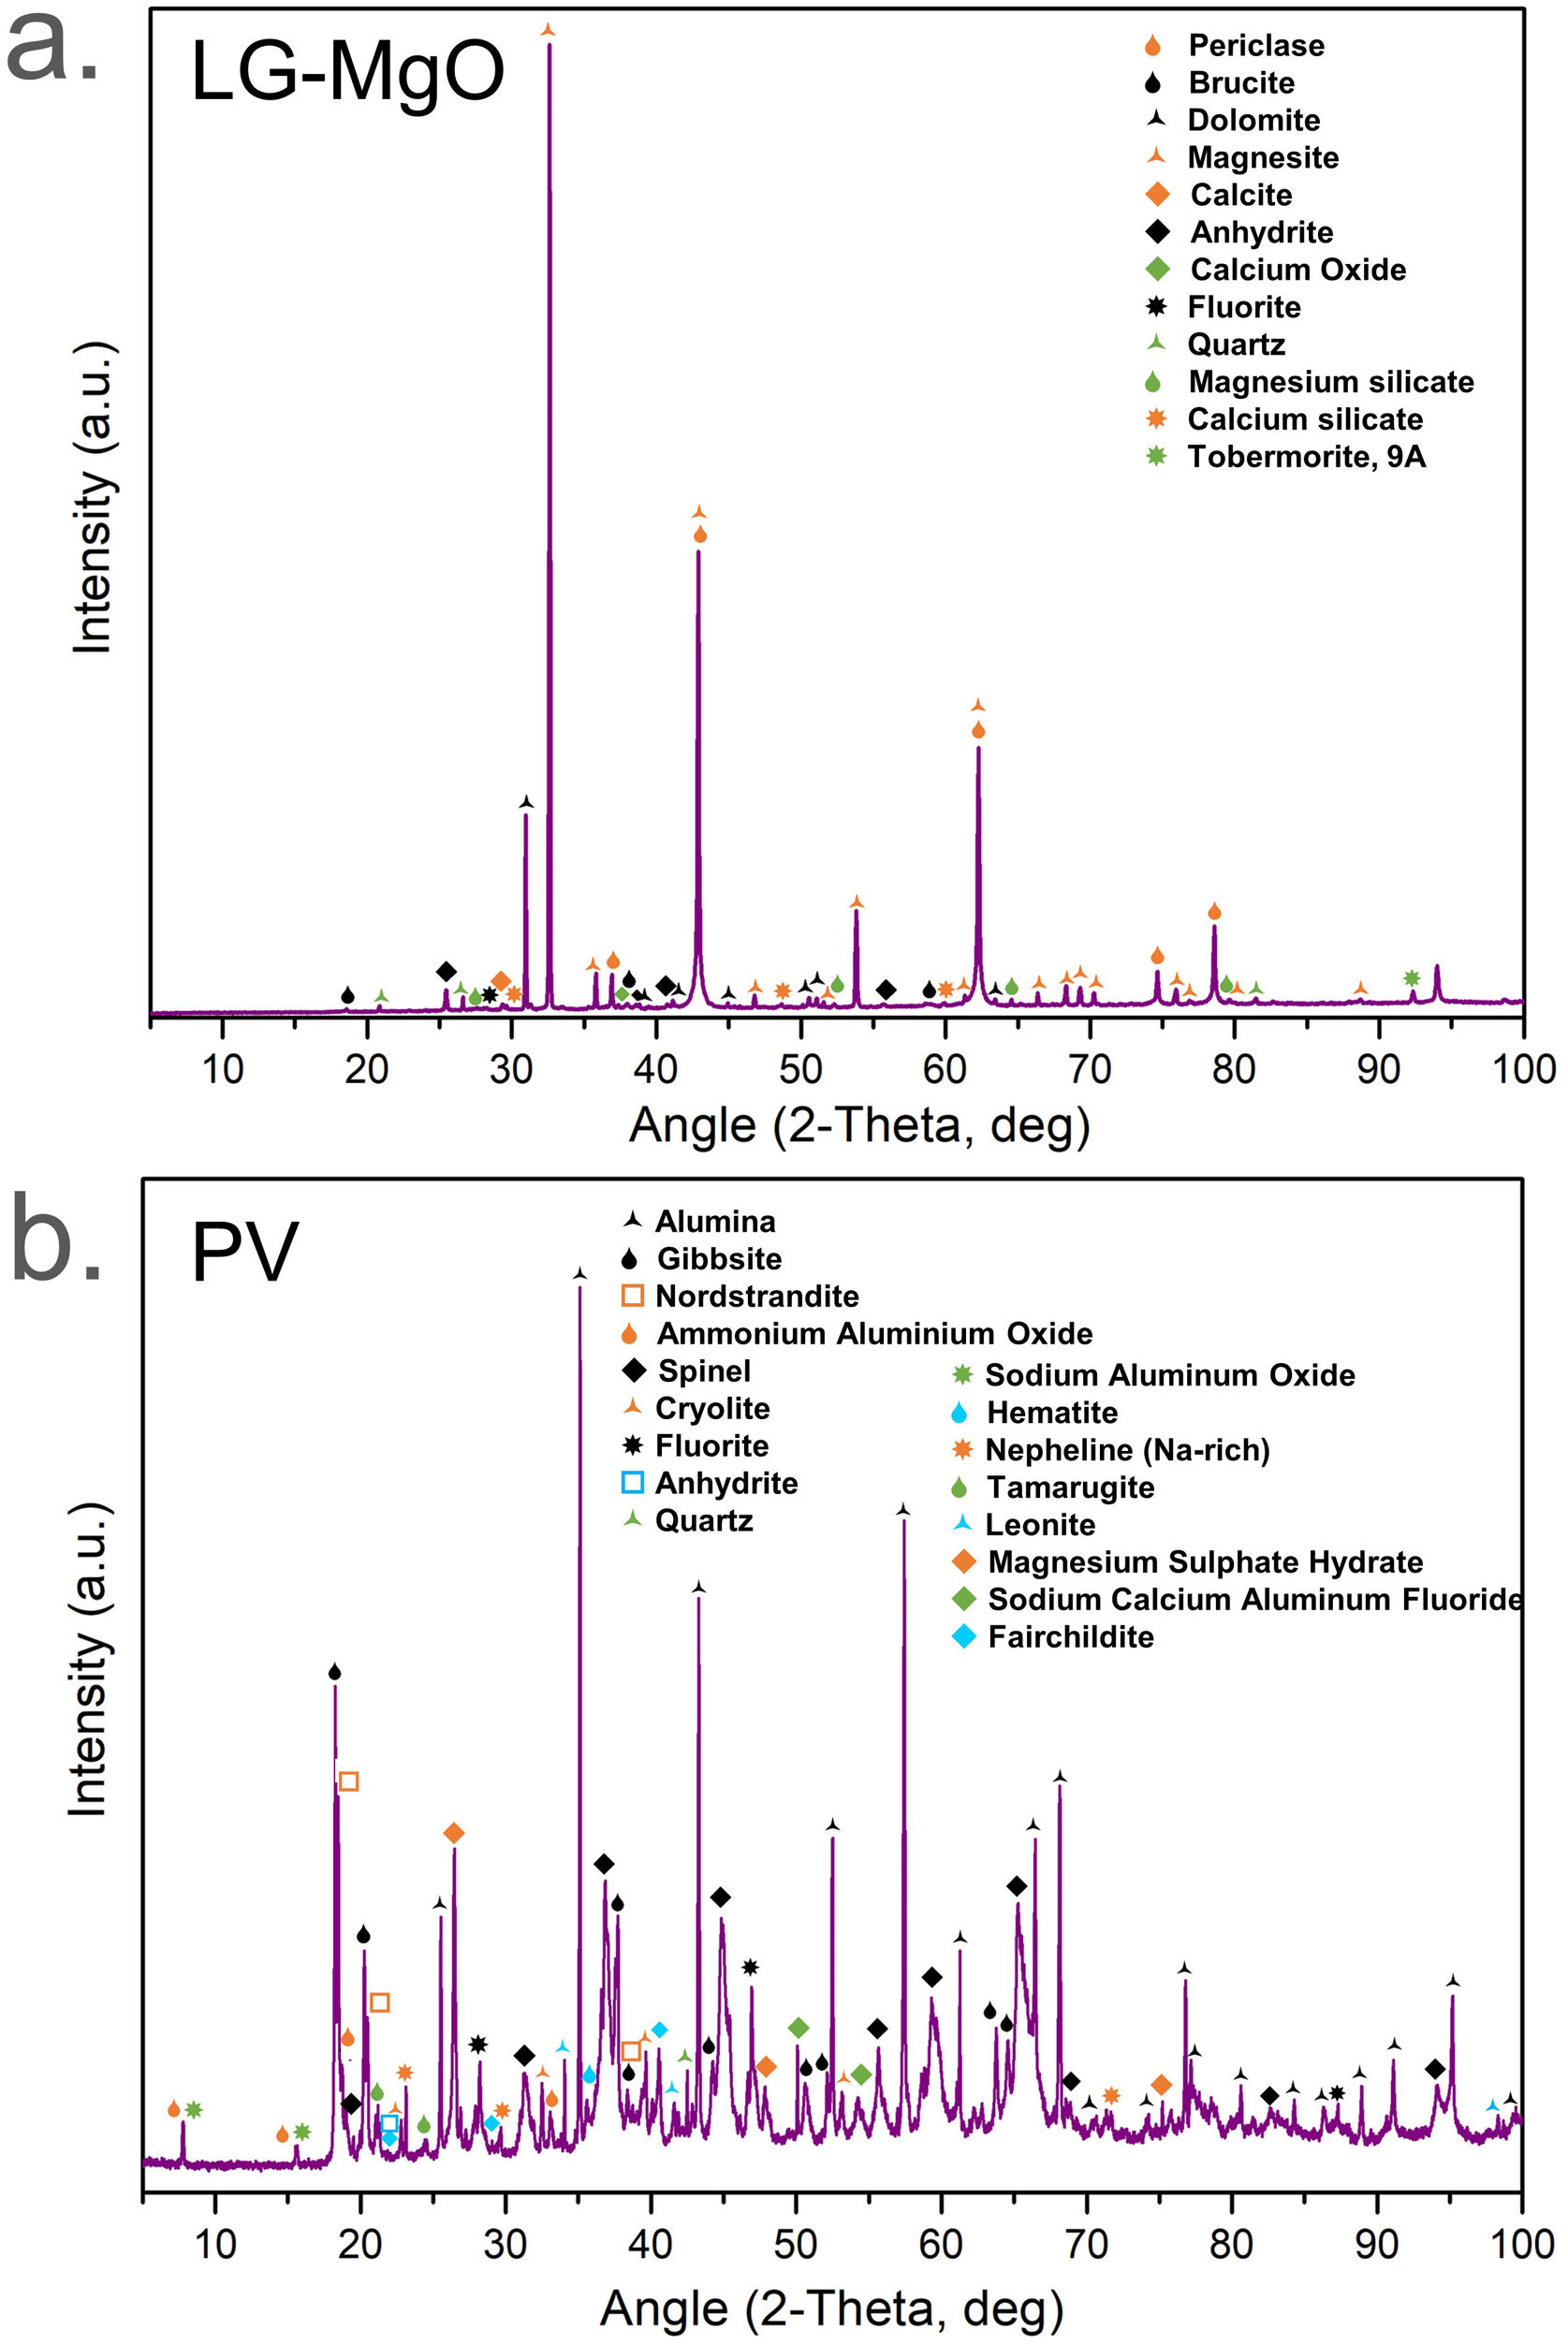
Diffraction patterns of LG-MgO and PV are shown in Fig. 1. The main crystalline phase found in LG-MgO (Fig. 1a) was periclase (MgO, PDF# 01-078-0430). Brucite (Mg(OH)2, PDF# 01-083-0114), dolomite (MgCa(CO3)2, PDF# 01-083-1766), magnesite (MgCO3, PDF# 01-071-1534), calcite (CaCO3, PDF# 01-072-1214), anhydrite (CaSO4, PDF# 01-072-0503), and calcium oxide (CaO, PDF# 01-077-2376) were also determined as major mineral phases. Fluorite, quartz, and some silicates were also detected as minor phases.
The diffraction pattern of PV (Fig. 1b) revealed the presence of alumina (Al2O3, PDF# 00-010-0173), gibbsite (Al(OH)3, PDF# 00-033-0018), nordstrandite (Al(OH)3, PDF# 00-024-0006), ammonium aluminium oxide (Al21.86O34·2.56 (NH4), PDF# 01-076-0118), spinel (MgAl2O4, PDF# 00-021-1152), cryolite (Na3AlF6, PDF# 00-025-0772), fluorite (CaF2, PDF# 00-035-0816), anhydrite (CaSO4, PDF# 00-026-0328), sodium aluminium oxide (Na2O(Al2O3)11, PDF# 01-077-2312), and other impurities such as iron oxide, quartz, silicates, and double sulphates. A large number of aluminium-based mineral phases agree with the origin of the by-product obtained in the recycled aluminium process. In addition, the presence of compounds such as cryolite or fluorite is due to their use as slagging salts during the recycling process. The by-product showed some amorphous structure which was observed in the slightly swollen baseline pattern.
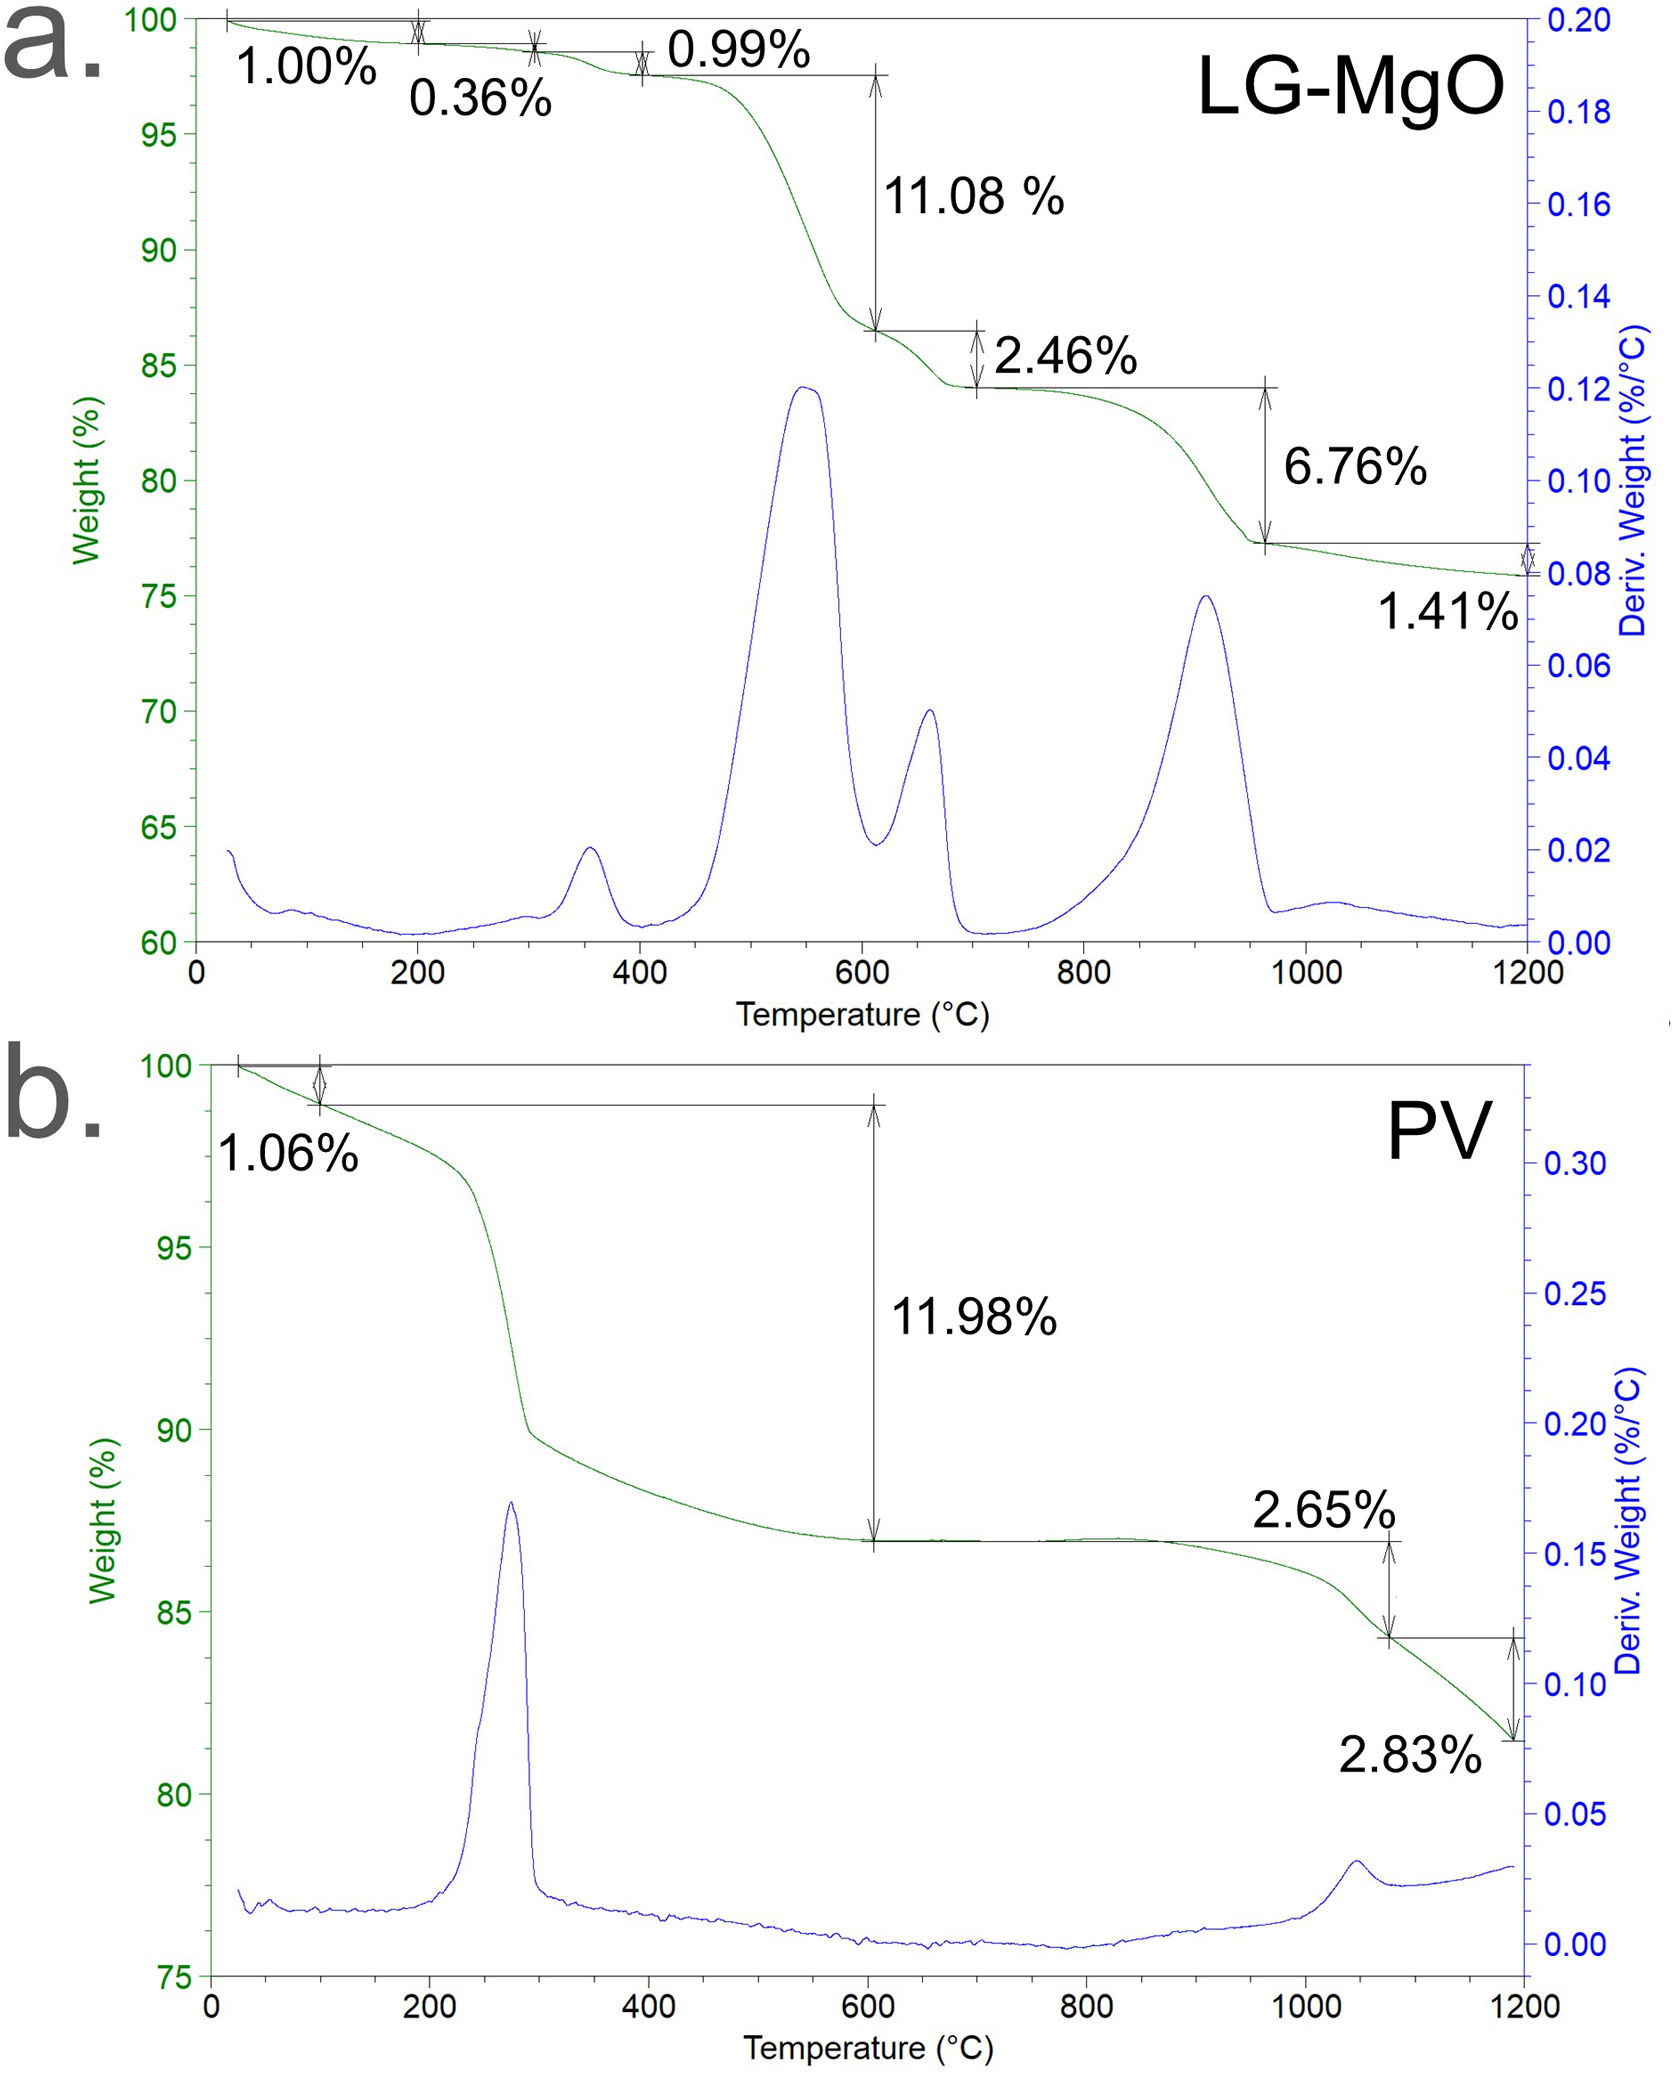
TG/DTG thermal decompositionThe TG/DTG thermal decomposition of LG-MgO and PV in nitrogen atmosphere is presented in Fig. 2. LG-MgO (Fig. 2a) presented a total weight loss of 24.06wt.%, which can be attributed to (i) H2O evaporation (from 30 to 200°C) [59], (ii) tobermorite, Ca5Si6O16·(OH)2·4H2O water loss resulting in Ca5Si6O16·(OH)2 and H2O (from 200 to 310°C) [60–62], (iii) Mg(OH)2 dehydroxylation transforming into MgO and H2O (from 310 to 400°C) [63], (iv) MgCO3 decarbonisation producing MgO and CO2 (from 400 to 610°C) [63], (v) CaMg(CO3)2 decarbonisation leading to CaO, MgO, and CO2 (from 610 to 720°C) [63], (vi) CaCO3 decarbonisation transforming into CaO and CO2 (from 720 to 960°C) [63], and (vii) MgSO4 desulphuration resulting in MgO and SO3 (from 960 to 1200°C) [63,64].
 and DTG (Deriv.Weight) signals of the thermal decomposition of raw materials LG-MgO (a) and PV (b). (Colour in print and web).")
PV (Fig. 2b) presented a total weight loss of 18.52wt.% assigned to NaAl(SO4)2·6H2O water loss resulting in NaAl(SO4)2 and H2O (from 30 to 80°C) [65], Al(OH)3 dehydroxylation transforming into Al2O3 and H2O (from 80 to 655°C) [66], NaAl(SO4)2 desulphuration producing Na2O, Al2O3, and SO3 (from 655 to 1090°C) [67,68], and the decomposition of various mix of carbonates and sulphates found in XRD analysis (from 1090 to 1200°C) with a broad DTG weight loss band.
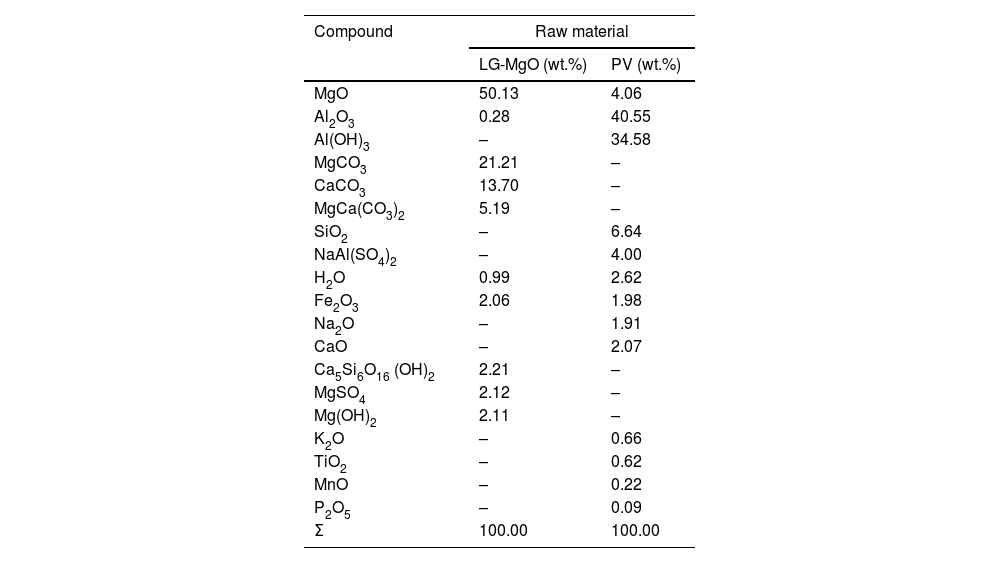
An estimation of the composition of LG-MgO and PV was performed, which was conducted considering the stoichiometric decompositions (wt.%) and the crystalline phases determined through XRD, and it was adjusted using the XRF elemental composition shown in Table 2. As is described in Table 3, the main compounds of LG-MgO are MgO (50.13wt.%) and MgCO3 (21.21wt.%), while PV arein Al2O3 (40.55wt.%) and Al(OH)3 (34.58wt.%).
Estimation of raw materials composition.
| Compound | Raw material | |
|---|---|---|
| LG-MgO (wt.%) | PV (wt.%) | |
| MgO | 50.13 | 4.06 |
| Al2O3 | 0.28 | 40.55 |
| Al(OH)3 | – | 34.58 |
| MgCO3 | 21.21 | – |
| CaCO3 | 13.70 | – |
| MgCa(CO3)2 | 5.19 | – |
| SiO2 | – | 6.64 |
| NaAl(SO4)2 | – | 4.00 |
| H2O | 0.99 | 2.62 |
| Fe2O3 | 2.06 | 1.98 |
| Na2O | – | 1.91 |
| CaO | – | 2.07 |
| Ca5Si6O16 (OH)2 | 2.21 | – |
| MgSO4 | 2.12 | – |
| Mg(OH)2 | 2.11 | – |
| K2O | – | 0.66 |
| TiO2 | – | 0.62 |
| MnO | – | 0.22 |
| P2O5 | – | 0.09 |
| Σ | 100.00 | 100.00 |
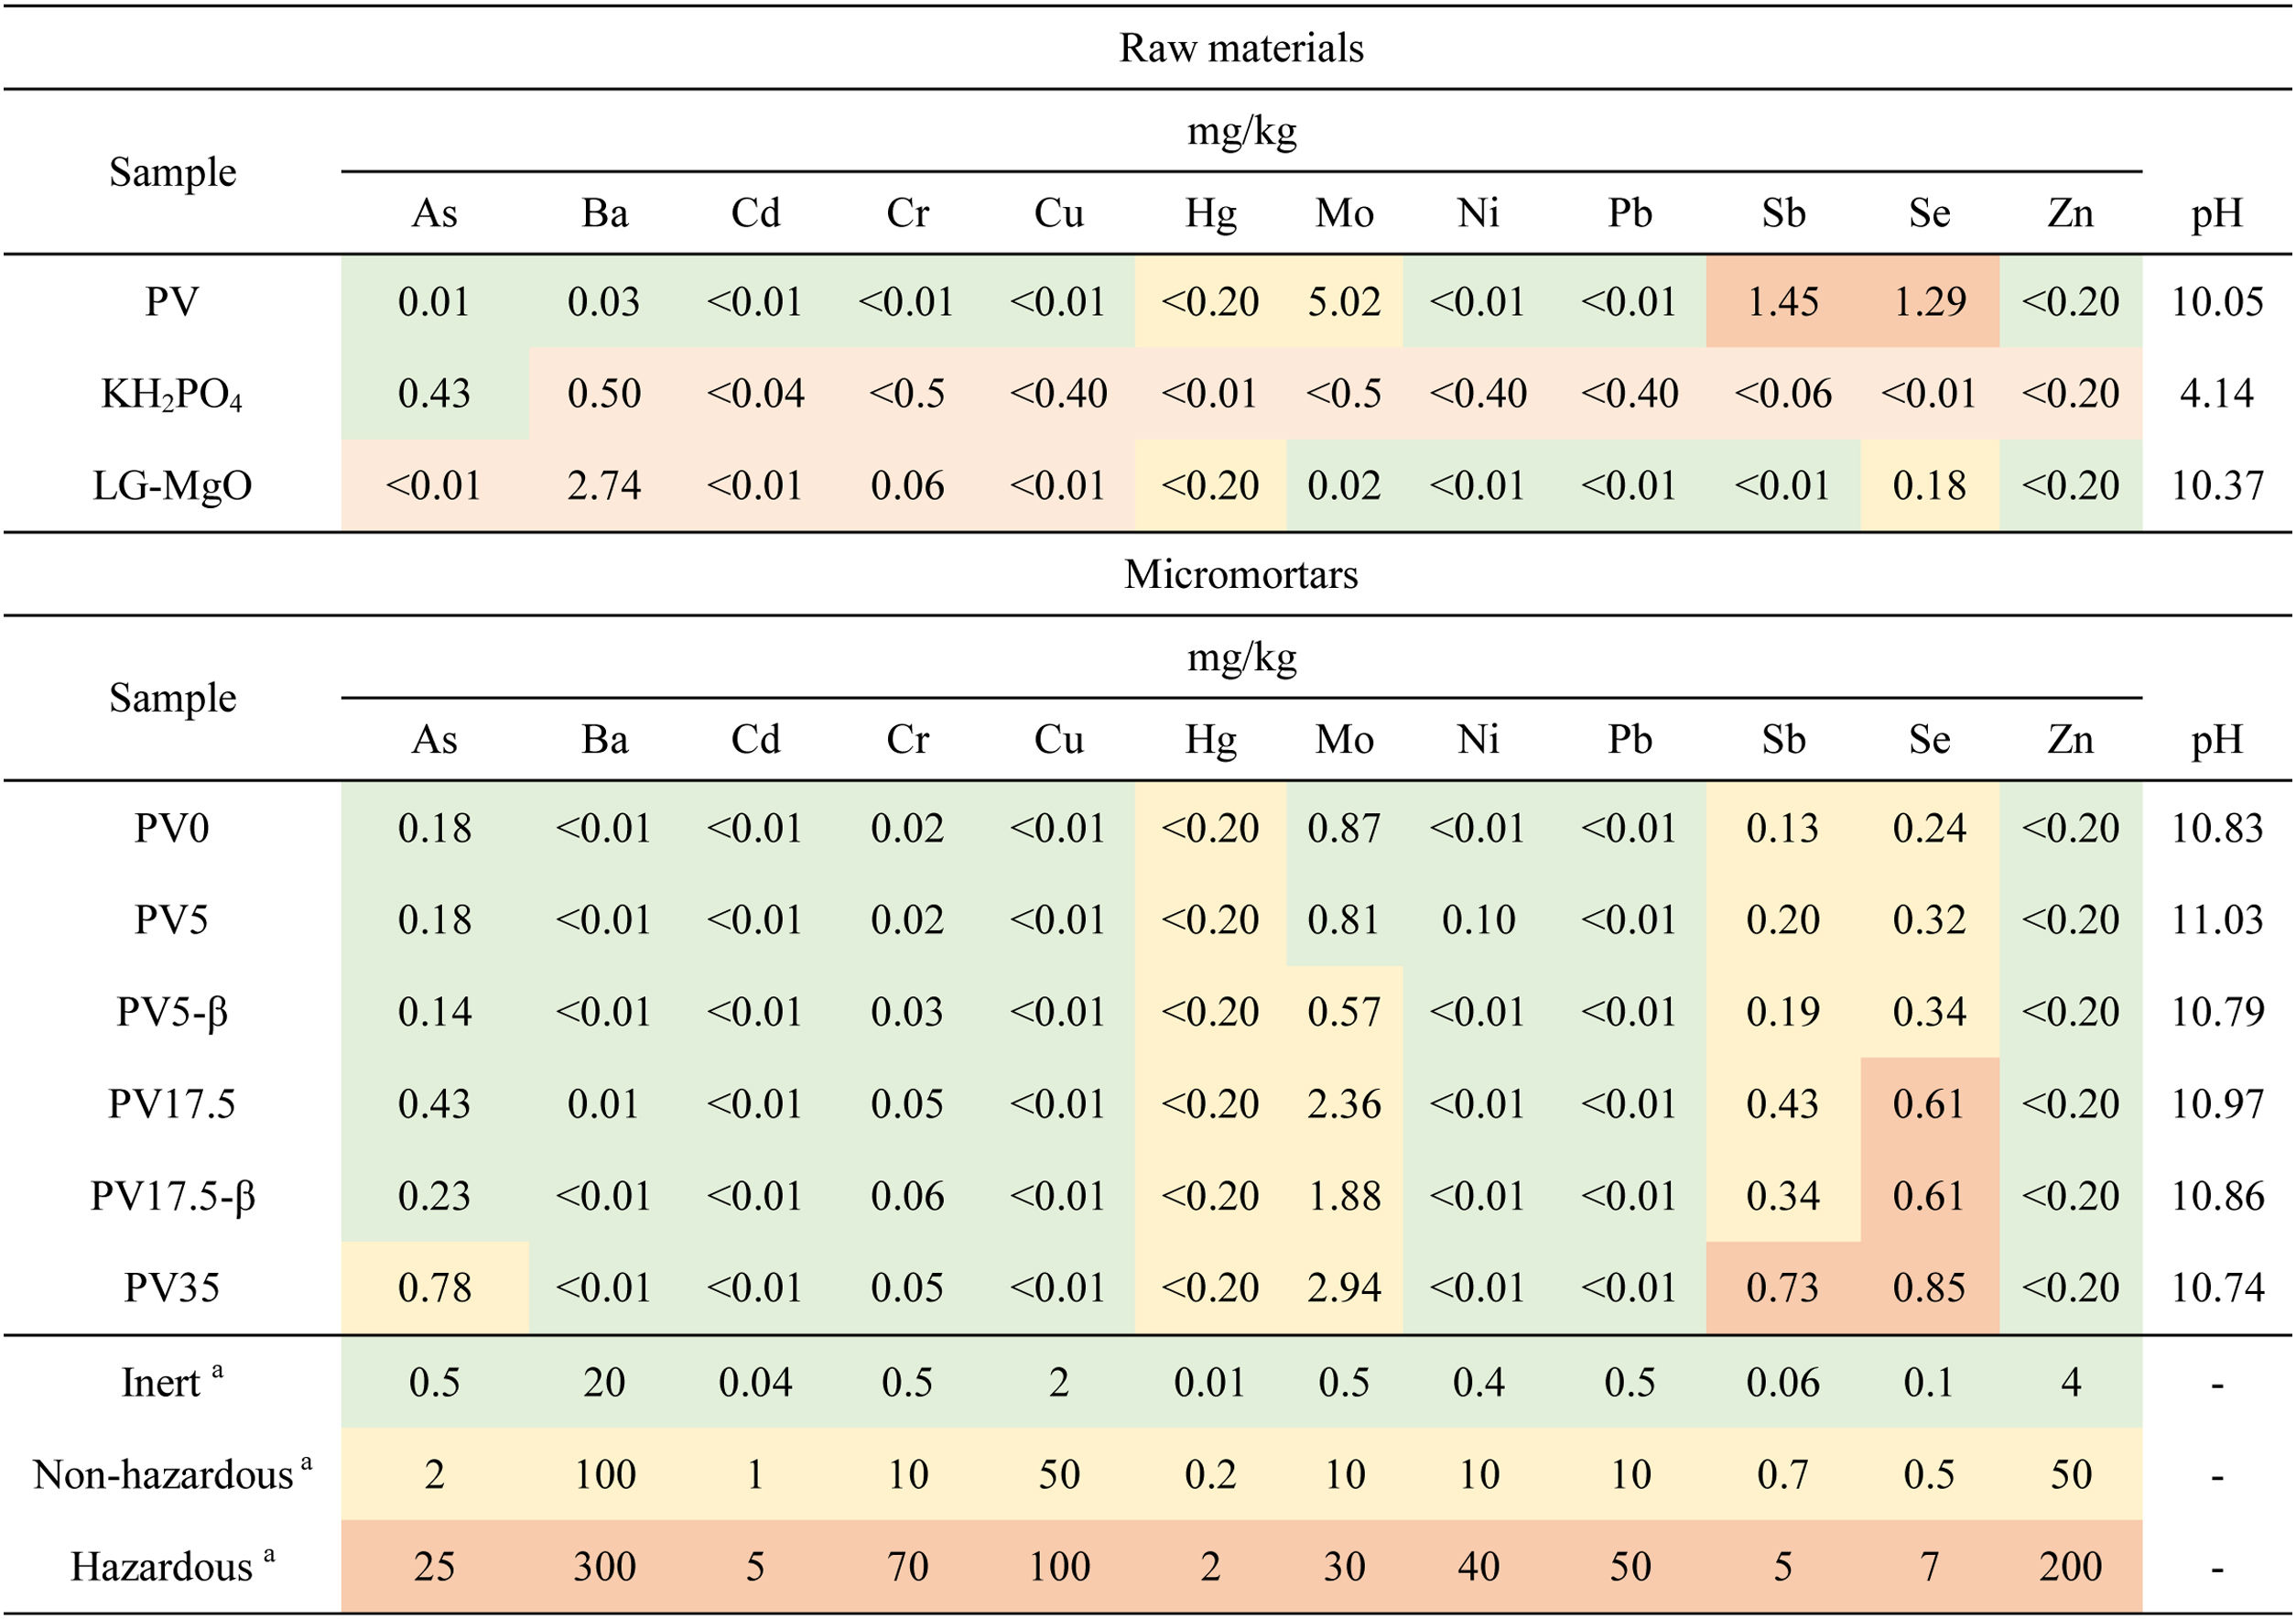
The results determined from the leaching test according to EN 12457-2 [49] are shown in Table 4. The leaching test revealed that Sb and Se are above the limits for hazardous materials in the case of PV. Accordingly, LG-MgO is classified as non-hazardous.
Leaching concentrations (mgkg−1) of the potentially hazardous elements in powdered raw materials and micromortars (EN 12457–2). (Colour in print and web).

The elemental traces are classified as follows: green for inert waste, yellow for non-hazardous waste and orange for hazardous waste.
aUpper limit concentration for acceptance at landfills. EU council landfill legislation [71].
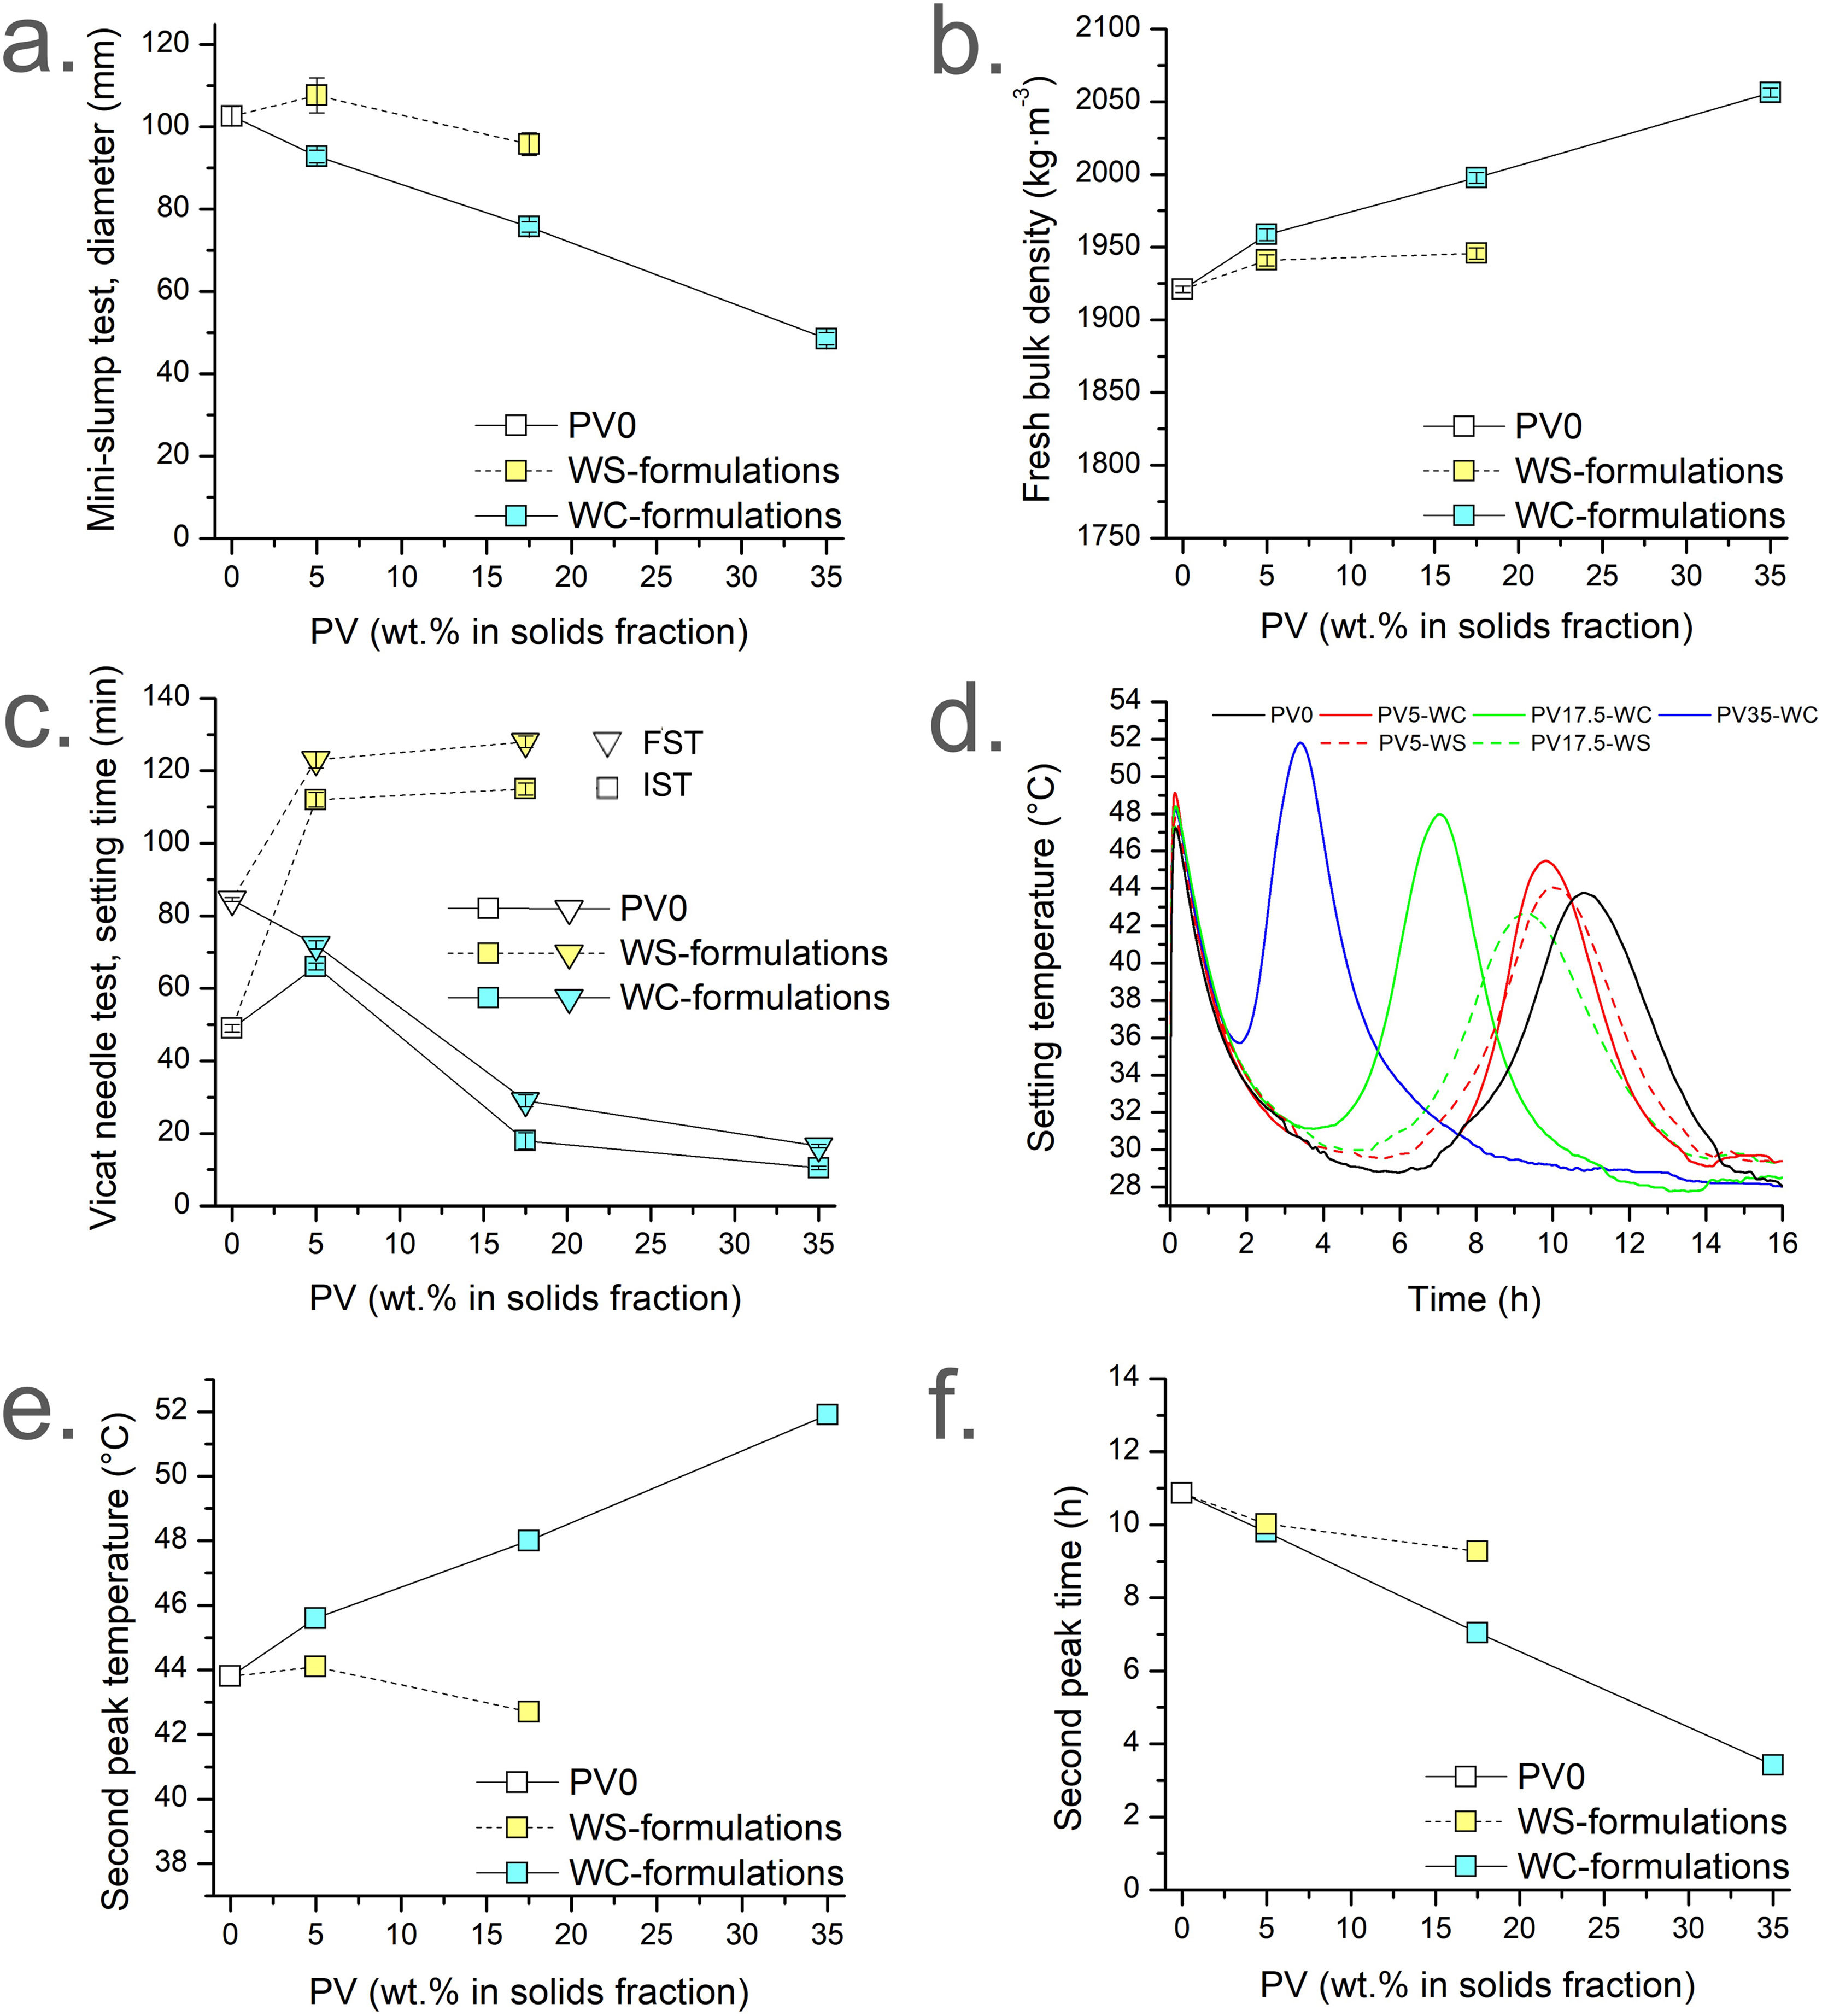
Fig. 3 presents mini-slump test diameter, fresh paste apparent density, Vicat test setting time, and temperature setting test as fresh properties, as well as the corresponding temperatures and times for the second peak of each formulation of the temperature setting test. Fig. 3a–c presents the results grouped by colour (white for PV0, blue for WC-formulations; yellow for WS-formulations), accordingly to the dosages summarised in Table 1.
, Fresh paste apparent density (b), Vicat needle test (c), setting temperatures (d), and second peak temperature (e) and second peak time (f). (Colour in print and web).")
Fig. 3a depicts the spread diameters of Sust-MPC-PV mixtures determined by the mini-slump test procedure. On the one hand, W/C=0.31 results (blue) revealed that the addition of PV linearly decreases the fluidity of the pastes (from PV0; PV5-WC; PV17.5-WC; PV35-WC). This follows the aforementioned decreasing trend in WC-formulations and PV0 by considering the W/S ratio in front of the wt.% of PV. This is because the W/C ratio remained constant, while the W/S ratio decreased due to the increase of PV weight percentage. Results revealed that the addition of PV makes the PV35-WC barely workable, due to a higher water absorption attributed to the high surface area of PV. Hence, for high wt.% of PV the W/C ratio should be significantly increased to obtain good workability, at least, for additions above 35wt.% of PV. Conversely, considering the results shown in yellow, it can be concluded that WS formulations (see Table 1) are in the same workability range as PV0. As was expected, mini-slump test results of WS-formulations are higher than WC-formulations with the same amount of PV. This is because the W/C ratio increases, and the W/S ratio remains constant when PV is added for WS formulations (see Table 1). A slight increase in the slump diameter is observed for PV5-WS in comparison to PV0. However, a slight decrease is observed for PV17.5-WS in comparison to PV0. The former could be due to the influence of the W/C ratio, which is higher in PV5-WS (0.33) than in PV0 (0.31). The latter is probably due to the more substantial influence of PV addition over the W/C ratio. Hence, the mini-slump test results (Fig. 3a) are in accordance with the W/C and W/S ratios used in the formulations, revealing that for the W/C=0.31 formulation (blue), the higher the PV percentage the lower the fluidity.
Fresh paste's apparent density of the micromortars under study is presented in Fig. 3b. The density of the WC and WS formulations tends to increase with the addition of PV since PV (ρ(Al2O3)=3.95gcm−3[69]) has a higher density than sust-MPC (ρ(PV0)=2.31±0.16gcm−3; determined in helium pycnometer). WC-formulations increase linearly, while WS formulations grow rapidly in the first addition (PV5-WS), but remain stable for the second case (PV17.5-WS). As was expected, the results shown in yellow (WS formulations) are less dense than their analogues from WC-formulations (blue) since they have more kneading water.
The initial and final setting times (IST and FST, respectively) from the Vicat needle test are shown in Fig. 3c. As depicted by the IST and FST results shown in blue (Fig. 3c; W/C-formulations) the higher the PV wt.% the lower the setting times (IST and FST), except in the case of PV5 IST result. The tendency is linear because the W/C ratio remains constant while the W/S ratio also decreases linearly (PV0; PV5-WC; PV17.5-WC; PV35-WC). PV absorbs part of the kneading water resulting in lower IST, FST; and open time (time difference between IST and FST). As it is known, part of the kneading water acts as a cooling agent, delaying the setting time. Hence, the lower the amount of water in the mixture the lower the setting time. Besides, the decrease of IST and FST of Sust-MPC-PV would be also related to a setting accelerator effect of PV in sust-MPC, which is detailed in the setting temperature test results. The increase of IST in PV5-WC may be explained by a certain PV weight percentage (higher than 5wt.%) needed to see significant changes. Conversely, when the W/S is maintained constant (i.e., WS formulations, yellow depicted in Fig. 3c), an increase in IST and FST is observed when PV wt.% is increased. The increase is very pronounced for PV5-WS in comparison to PV0 setting times. However, IST and FST present similar values for PV5-WS and PV17.5-WS. The former is explained by the higher W/C (i.e., more water and lower amount of cement as PV wt.% increases in WS formulations than in PV0 formulation). Hence, part of the kneading water acts as a cooling agent delaying the setting reaction of the cement. The latter can be explained by the abovementioned setting acceleration effect of PV.
PV0 is the formulation with the highest open time (55min). Therefore, the open time is related to PV addition. WS-formulations present higher open times than the analogues WC-formulations due to the higher amount of water in the WS-formulations. For this reason, a setting temperature experiment was conducted to compare PV0 with WC and WS-formulations. The temperatures of each mixture during the setting are presented in Fig. 3d. Two peaks were determined for each micromortar. The first peak is attributed to the dissolution and hydration of the precursors, and the gelation and formation of amorphous phosphates. The second peak is assigned to the crystallisation process of the amorphous phosphates previously formed leading to the formation of K-struvite [33]. Should be noted that the first peak reaches similar times and temperatures for all mixtures, while the second peak varies significantly depending on the formulation. Thus, WS-formulations reach lower temperatures than WC-formulations due to the higher amount of water, while WC-formulations reach similar temperatures. This is in agreement with the W/C=0.31 in WC-formulations and PV0 because the first peak is related to the number of reactive species involved in the event. As it is shown in Fig. 3e the second peak reaches more temperature for WC-formulations as PV wt.% is increased. However, WS-formulations reach lower temperatures due to the cooling effect of kneading water (i.e. W/C ratio is increased as PV wt.% is increased). This could explain the higher open times for WS-formulations. Fig. 3f shows that the addition of PV decreases the time to reach the second peak for WC and WS-formulations. This behaviour is observed to a lesser extent for WS-formulations due to the higher W/C ratio. The fact that the maximum temperature peak shifts towards shorter times indicates that PV accelerates de K-struvite formation. This result is in agreement with the aforementioned results of the Vicat test (Fig. 3c), and mini-slump test (Fig. 3a), as can be seen for WC-formulations (depicted in blue in both figures). One possible explanation is that PV particles have some kind of interaction with the binder causing the acceleration of the K-struvite formation, reducing workability, shortening IST as well as FST and open time for the W/C=0.31 formulations. This is possibly because the reaction of PV with water is also an exothermic reaction allowing to accelerate the kinetics of the cement reaction.
The temperature test during setting sheds light on the effect of PV addition on the formation of K-struvite by decreasing the time of reaction and increasing the temperature when W/C remains constant, as well as on the cooling effect of an excess of kneading water which decreases the temperature but does not prevent the time decrease. These results would be related to the final porosity of the specimens, as well as to the CS at 28d. Hence, PV addition should lead to a higher close porosity due to the fast setting time, which indicates a decrease in CS depending on the maximum temperature and the time to reach it.
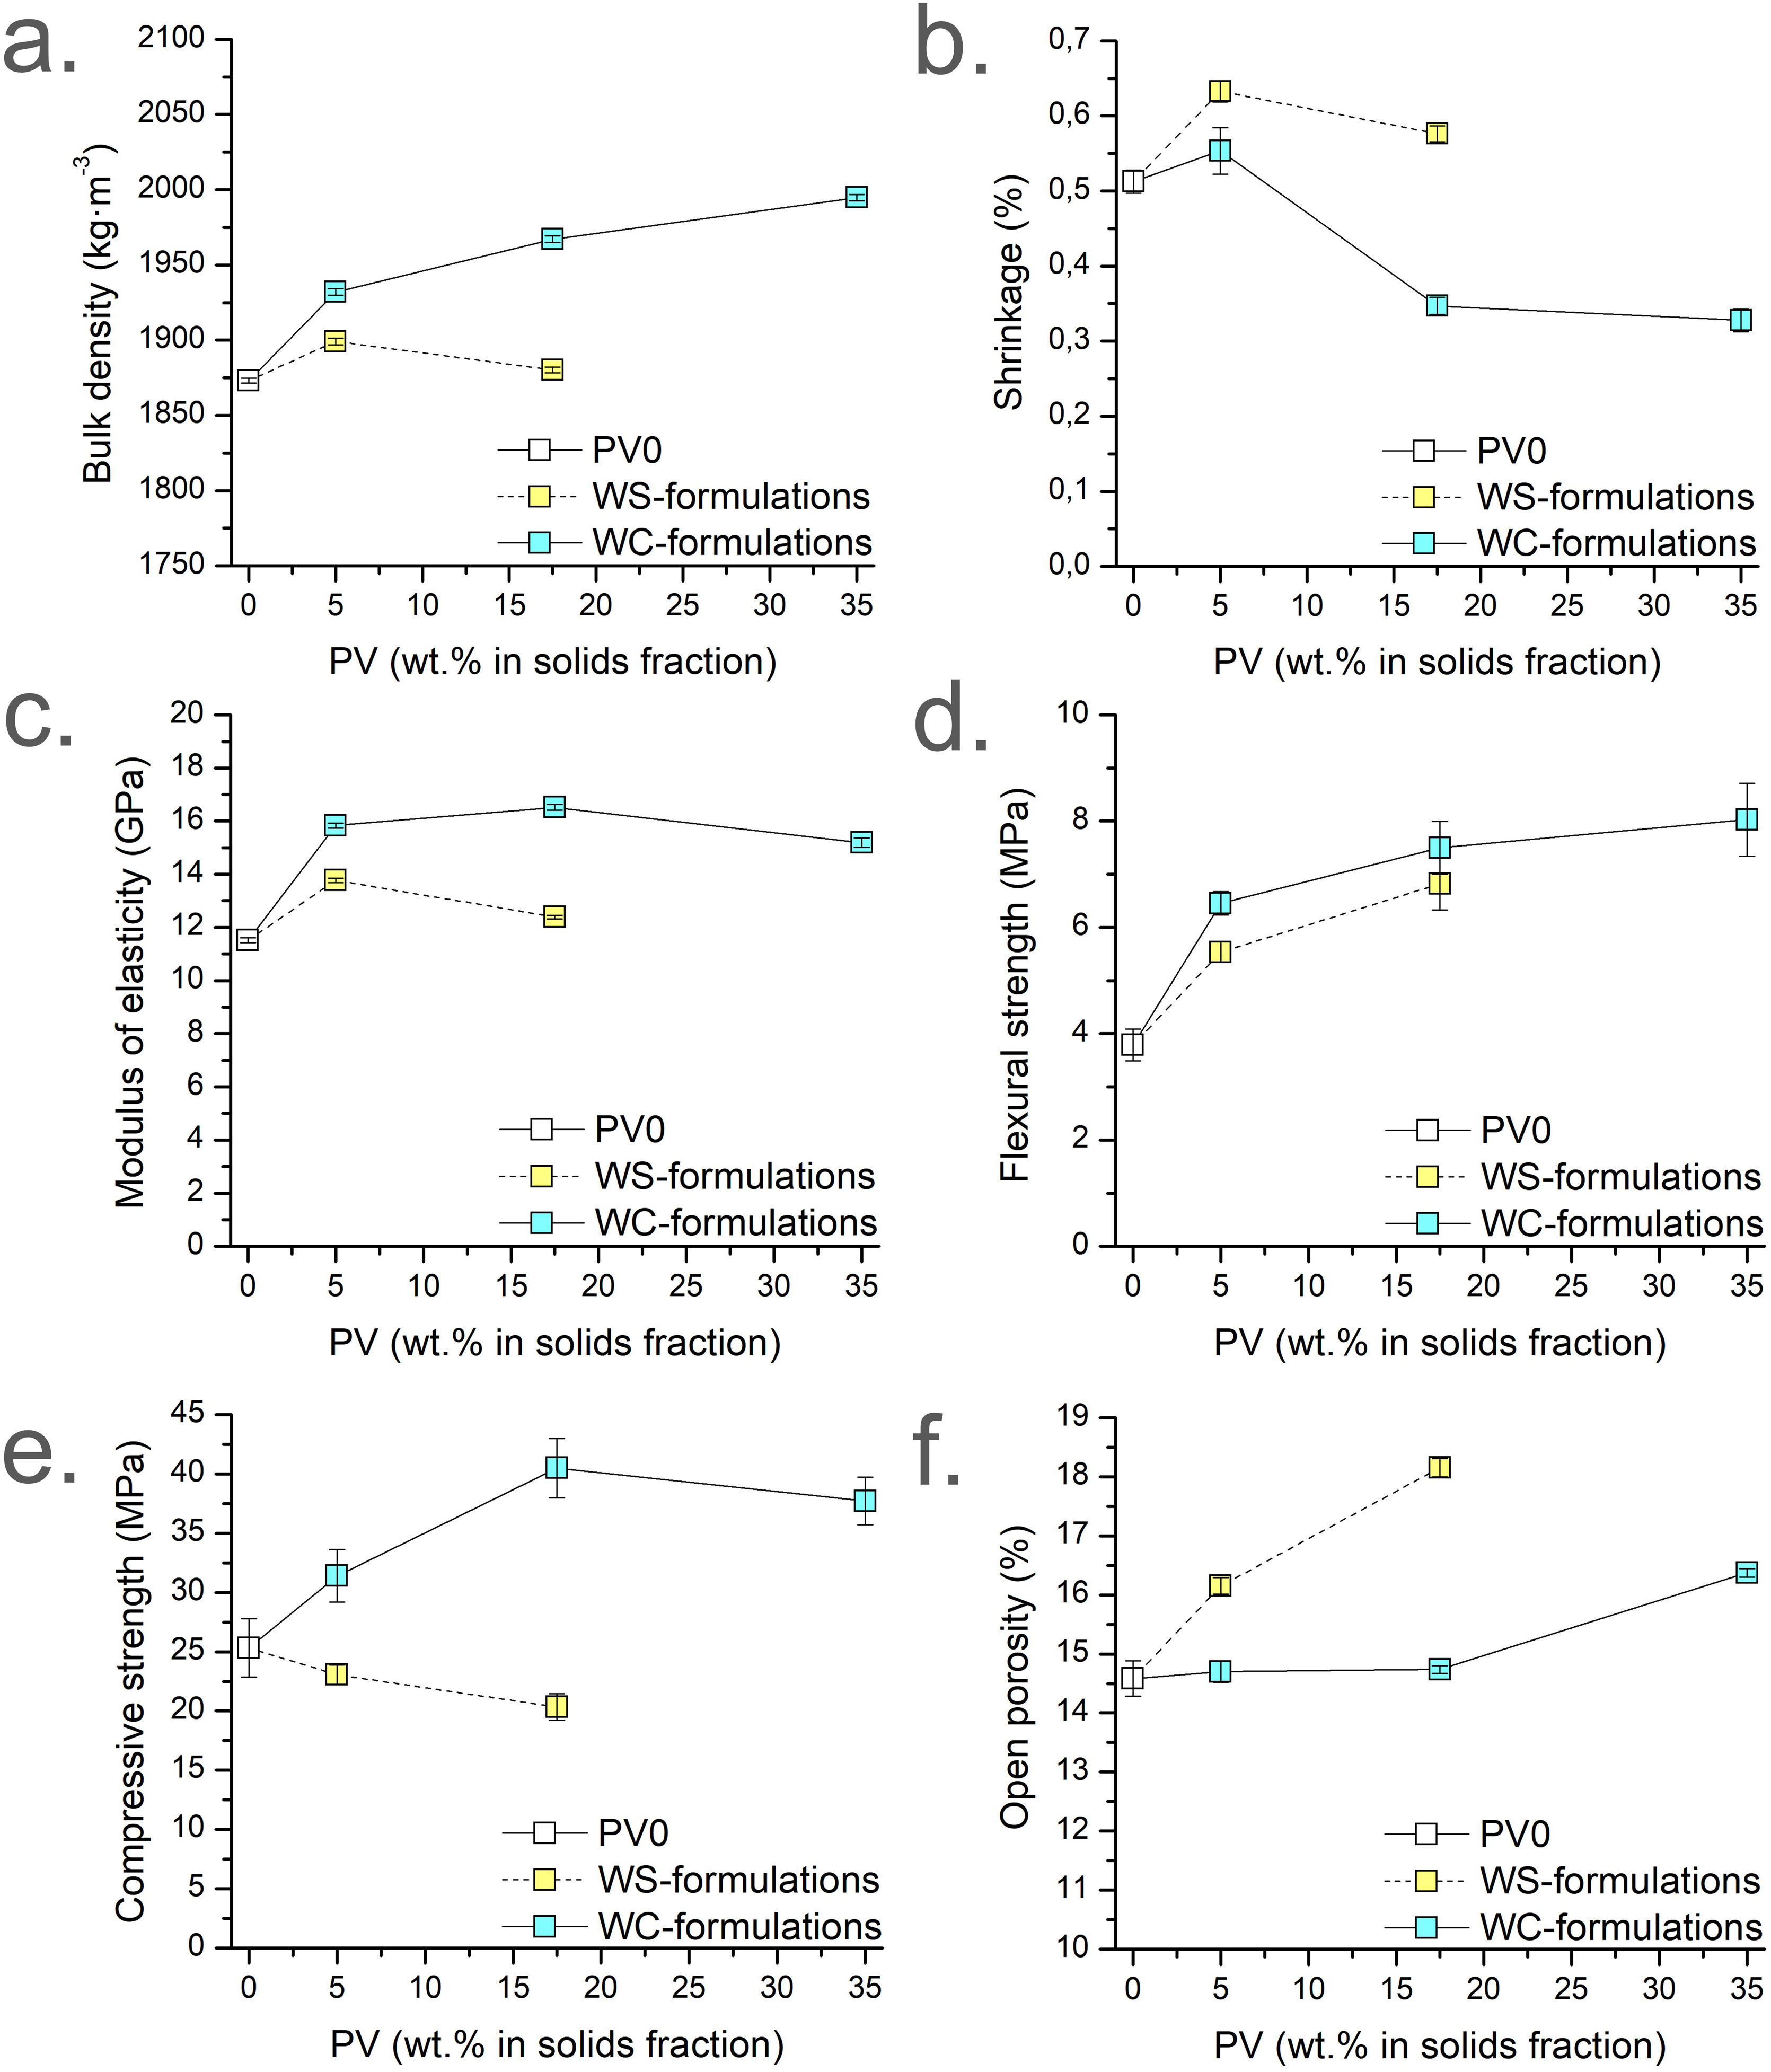
Physical propertiesHardened properties (apparent density, shrinkage, and open porosity), and mechanical properties (MOE, FS, and CS) of the micromortars are presented in Fig. 4. Fig. 4a–f presents the results grouped by colour (white for PV0, blue for WC-formulations; yellow for WS-formulations), accordingly to the dosages summarised in Table 1. All the apparent density results are lower than the fresh density results of the corresponding micromortars formulations. This is due to the release of water vapour or other gases during the setting and curing processes. The apparent density of the WC-formulations at 28d (Fig. 4a) tends to increase with the addition of PV (blue results) since the W/S ratio decreases and to the higher density of PV by-product. In this case, the tendency is not linear unlike the previously observed in the fresh apparent density results. Conversely, WS-formulations (yellow results; W/S=0.31) are denser than PV0. PV17.5-WS presents a lower apparent density than PV5-WS and this behaviour is the opposite that observed in the fresh density (Fig. 3b). This is attributed to the higher temperature during setting reaction due to the PV presence leading to a major release of water or other gases. Besides, the W/C ratio is higher for PV17.5-WS than PV5-WS, which means that PV17.5-WS presents an excess of water in front of PV5-WS. This excess water could be also released during the curing process. WC-formulations present higher bulk densities than the corresponding WS-formulations with the same amount of PV because WS-formulations were obtained by using more kneading water, leading to more unfilled pores when the micromortar is set.
, shrinkage (b), modulus of elasticity (c), flexural strength (d), Compressive strength (e), open porosity (f). (Colour in print and web).")
The shrinkage percentages of Sust-MPC-PV (Fig. 4b) present similar values, all below 0.7%. On the one hand, the results demonstrated in general that as the PV amount is increased, the shrinkage is decreased (i.e. PV5-WC vs PV17.5-WC and PV-35-WC; PV5-WS vs PV17.5-WS). However, PV0 presents lower shrinkage than both PV5 formulations (PV5-WC and PV5-WS). This is probably because it is needed higher contents of PV to observe a significant decrease in shrinkage. Hence, these results are in agreement with the expected because shrinkage is usually higher for a paste than for a mortar. Conversely, WS-formulations (yellow results; W/S=0.31) present higher shrinkage than their analogues (PV5-WC vs PV5-WS; PV17.5-WC vs PV17.5-WS). This is attributed to the higher amount of water in WS-formulations (i.e., higher W/S and W/C). Besides, higher shrinkage is observed when WS-formulations are compared with PV0 formulation, which is due to the higher W/C ratio in WS-formulations. Due to the linear tendencies previously detailed about the W/C and W/S ratios in front of the PV content, linear tendencies on the shrinkage results would reveal that the amount of water would be the reason for a linear increase or a decrease in this study. However, the fact that there is no linear tendency for shrinkage leads to support the idea that PV plays a significant role in leading to an improvement of the shrinkage.
Modulus of elasticity (MOE) results (Fig. 4c) are related to apparent density results, since the density of the sample affects the MOE performance. Closed porosity in the material slows soundwaves while dense sections transmit soundwaves at higher speeds, affecting the measurement. Like in flexural strength (FS) results, both PV5 formulations present higher MOE values than PV0. Increasing the amount of PV leads to similar values of MOE. This fact can be appreciated when PV5-WC is compared with PV17.5-WC and PV35-WC. This is probably due to an interconnected porosity generated by PV, which increases the setting temperature facilitating the gas generation. As was expected, WS-formulations present lower values of MOE than their homologues (PV5-WC vs PV5-WS; PV17.5-WC vs PV17.5-WS) due to the higher amount of water for WS-formulations.
The addition of PV enhances FS from 3.78MPa in PV0 to a maximum of 8.02MPa in PV35-WC (Fig. 4d). The increase in FS values in WC-formulations is attributed to a filling-pores effect with the addition of PV. In addition, FS is also improved when comparing WS-formulations with PV0 despite the higher W/C ratio. This fact reinforces the filling-pores effect of the PV addition on the micromortars. In addition, WS-formulations present a slight FS decrease compared with their homologues of WC-formulations (PV5-WC vs PV5-WS; PV17.5-WC vs PV17.5-WS). This is attributed to the higher W/C and W/S ratio of WS-formulations.
The CS results (Fig. 4e) of PV5-WC present higher CS than PV0, improving mechanical performance. Meanwhile, PV17.5-WC and PV35-WC show the highest CS results. However, both formulations present similar CS values. This is attributed to the lower amount of cement in PV35-WC than in PV17.5-WC. Hence, PV should act as a micro-filler. WS-formulations CS results are related to the linear trend increase of the W/C ratio when the PV amount is increased as expected. Thus, as higher the W/C ratio the lower the CS despite the addition of PV and the constant W/S ratio used. WS-formulations present pretty lower values of CS than their homologues. These CS results are directly related to the OP results.
PV0, PV5-WC, and PV17.5-WC micromortars present similar OP results (Fig. 4f). Meanwhile, WS-formulations present higher OP than their homologues attributed to the higher amount of water used. This higher porosity is related to the decrease in the CS results for WS-formulations. There is an increase in OP as the PV amount increases in micromortars. As it was aforementioned, for WC-formulations as the PV amount is increased the setting temperature is expected to increase. Hence, PV35-WC micromortar presents a higher OP result than PV17.5-WC attributed to the release of NH3 and water during setting.
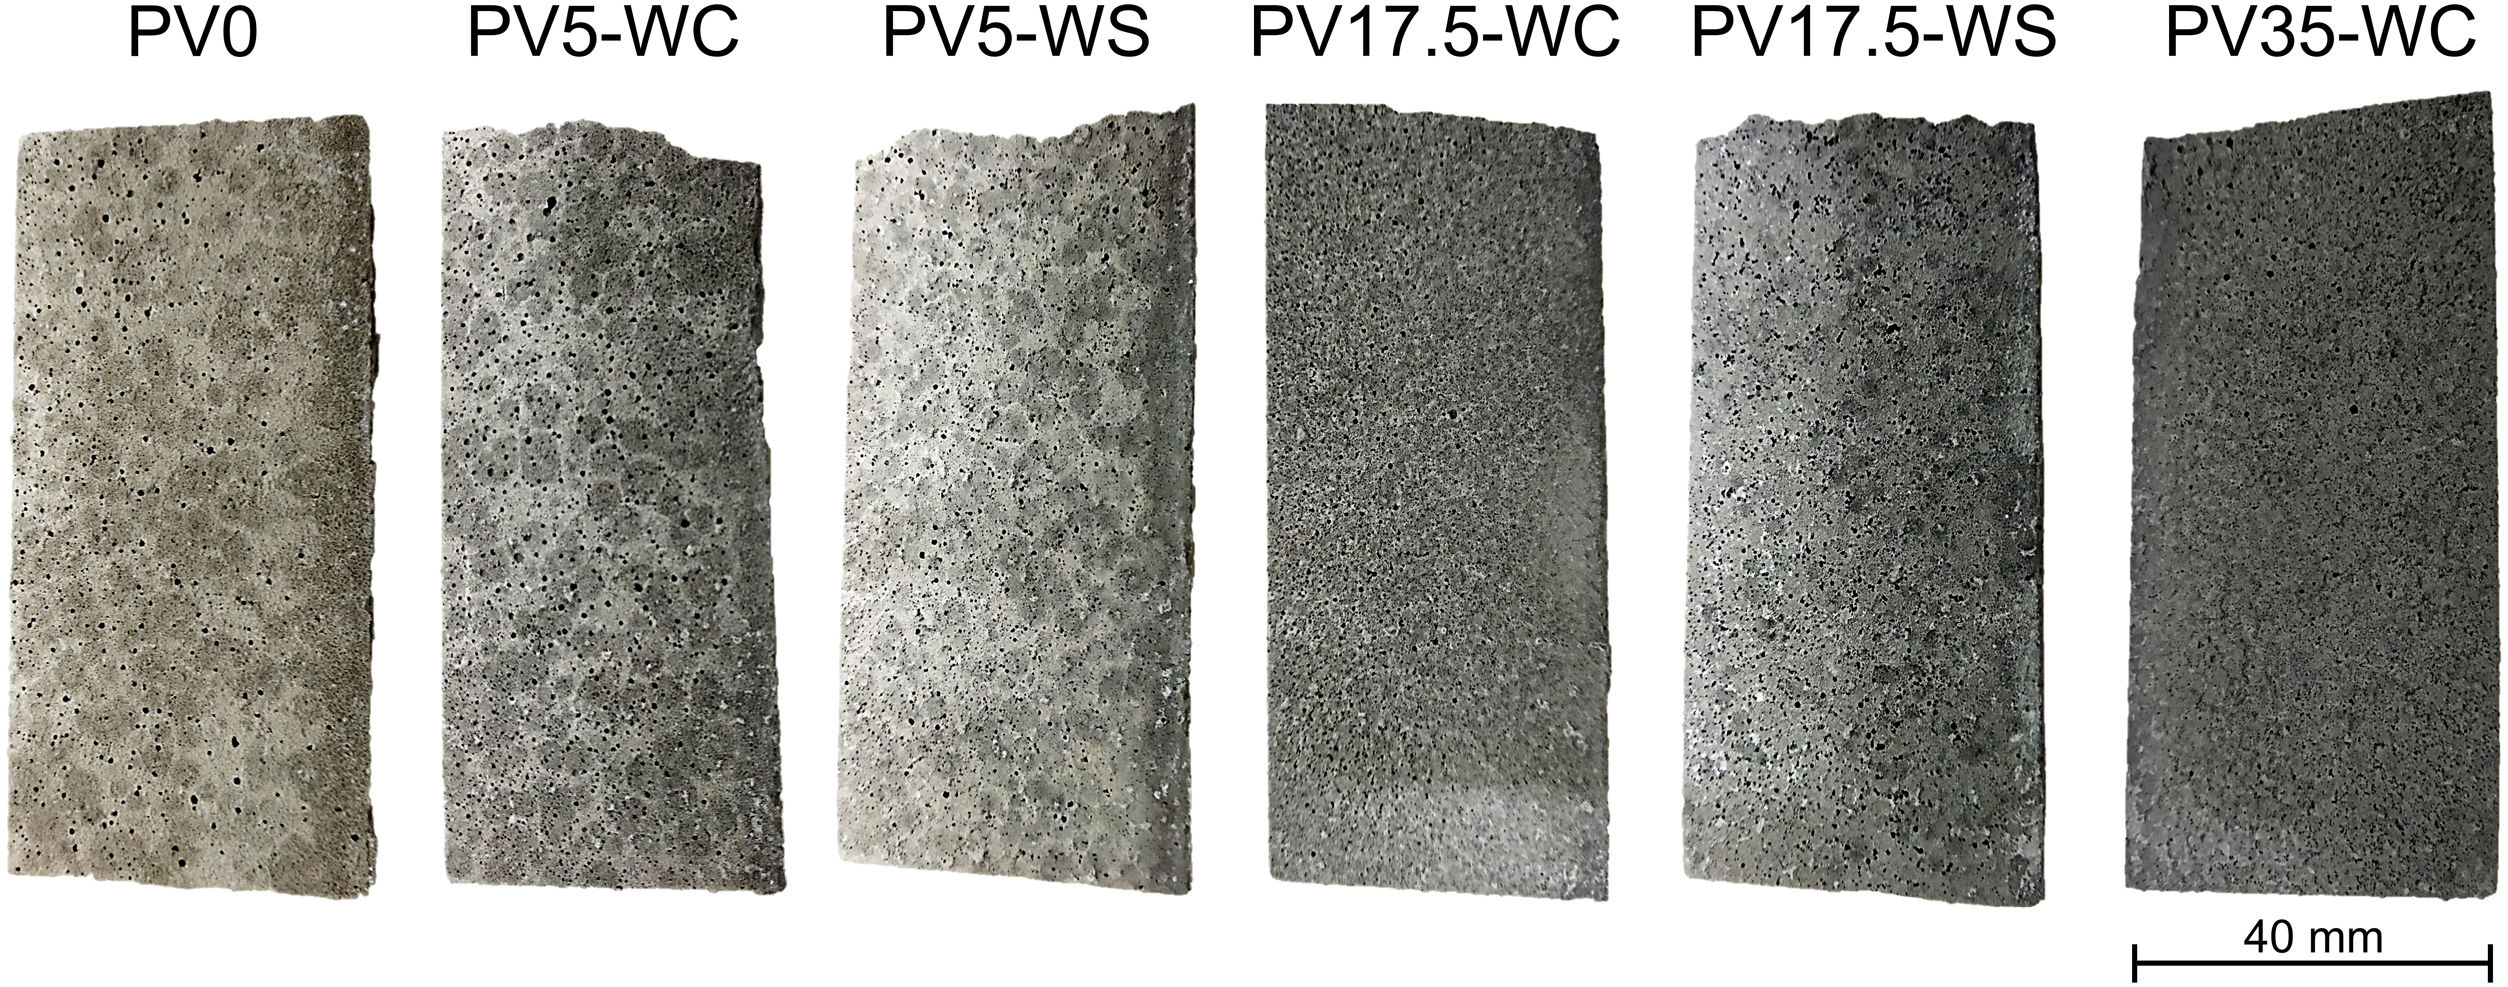
Open porosity of the specimens can be observed in Fig. 5, where it can be noticed how the OP slightly increases with the addition of PV, forming smaller pores. The porosity was already investigated in studies where PV and other similar aluminium wastes were used as raw material to produce alkali-activated materials [47,70]. The referenced authors reported the presence of aluminium nitride (AlN), which reacts in the alkali environment and creates ammonia gas leading to a porous structure in the final material. For the present research, no nitrites are found in PV. The reaction occurs more subtly than in alkali-activated materials due to the final pH of MPC, which is close to 10. Therefore, PV can also be considered here as a precursor responsible for the ammonia gas release.
.")
It would be expected that a higher increase in OP leads to a decrease in mechanical properties (MOE, FS, and CS) when the amount of PV is increased. However, the FS, MOE, and CS are similar for PV17.5-WC and PV35-WC formulations, despite increasing the amount of PV. Therefore, it can be argued that the addition of PV contributes to improving the mechanical performance (FS, MOE, and CS) of the micromortars, but there is not a significant increase above 17.5wt.% of PV due to the release of ammonia, which leads to higher OP values. In addition, the higher the PV amount, the higher the apparent density at 28 days of curing due to the higher density of PV, although PV increases the OP and reduces the setting time. It should be mentioned that PV35-WC sets faster than the other micromortars (i.e., IST and FST). Hence, it is possible to assume that closed porosity in PV35-WC is higher than in other micromortars formulations because there is not enough time to release the gases due to the fast setting time, entrapping the bubbles. Despite the OP increment, the mechanical properties are well maintained, especially in the case of PV17.5-WC and PV35-WC when compared with formulations with higher porosity (WS-formulations). This may be an indicator that the matrix generated in the micromortar is a stronger more compact matrix than sust-MPC alone.
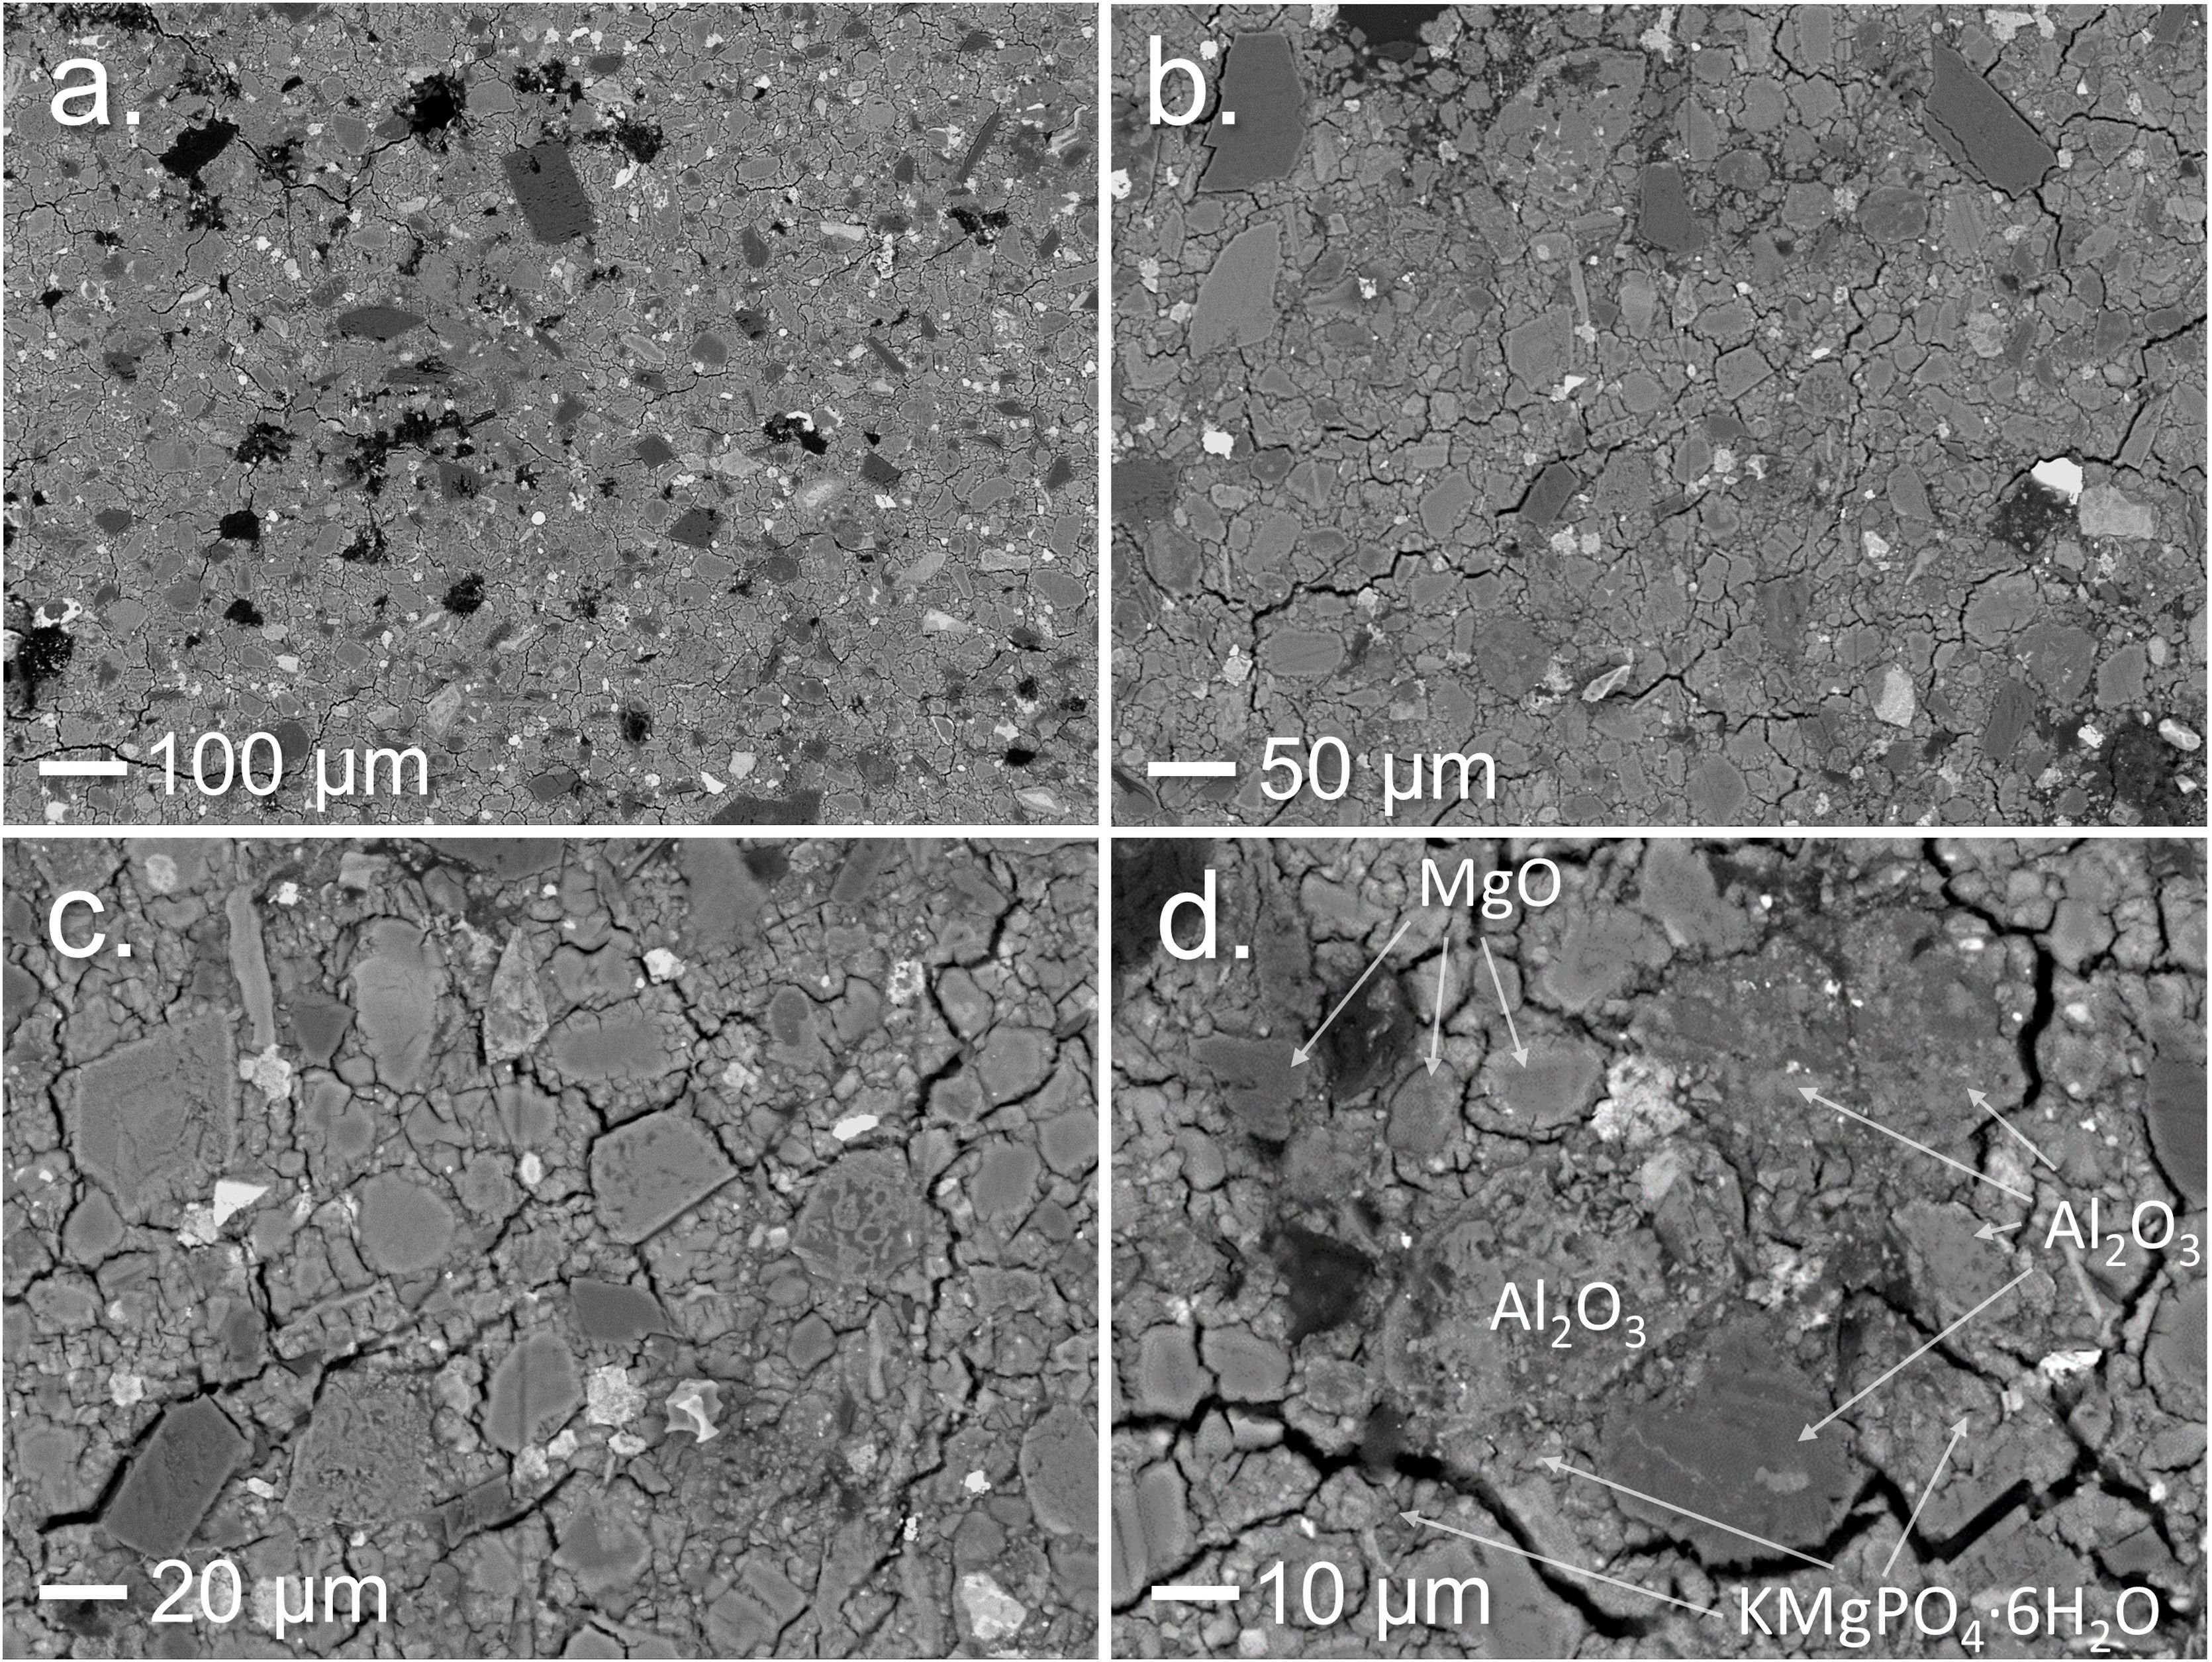
Scanning electron microscopyThe BSEM images of the inner section of PV35-WC (Fig. 6) show a good inclusion of PV particles into the K-struvite matrix from sust-MPC (Fig. 6a–c). EDS point analysis was used to identify some of the particles shown in the images (Fig. 6d). Al2O3 particles are well distributed, and their edges are blended to a certain degree with the matrix, as well as the un-reacted MgO particles, which are also present in the micromortar.
, and identification of un-reacted particles and matrix (d).")
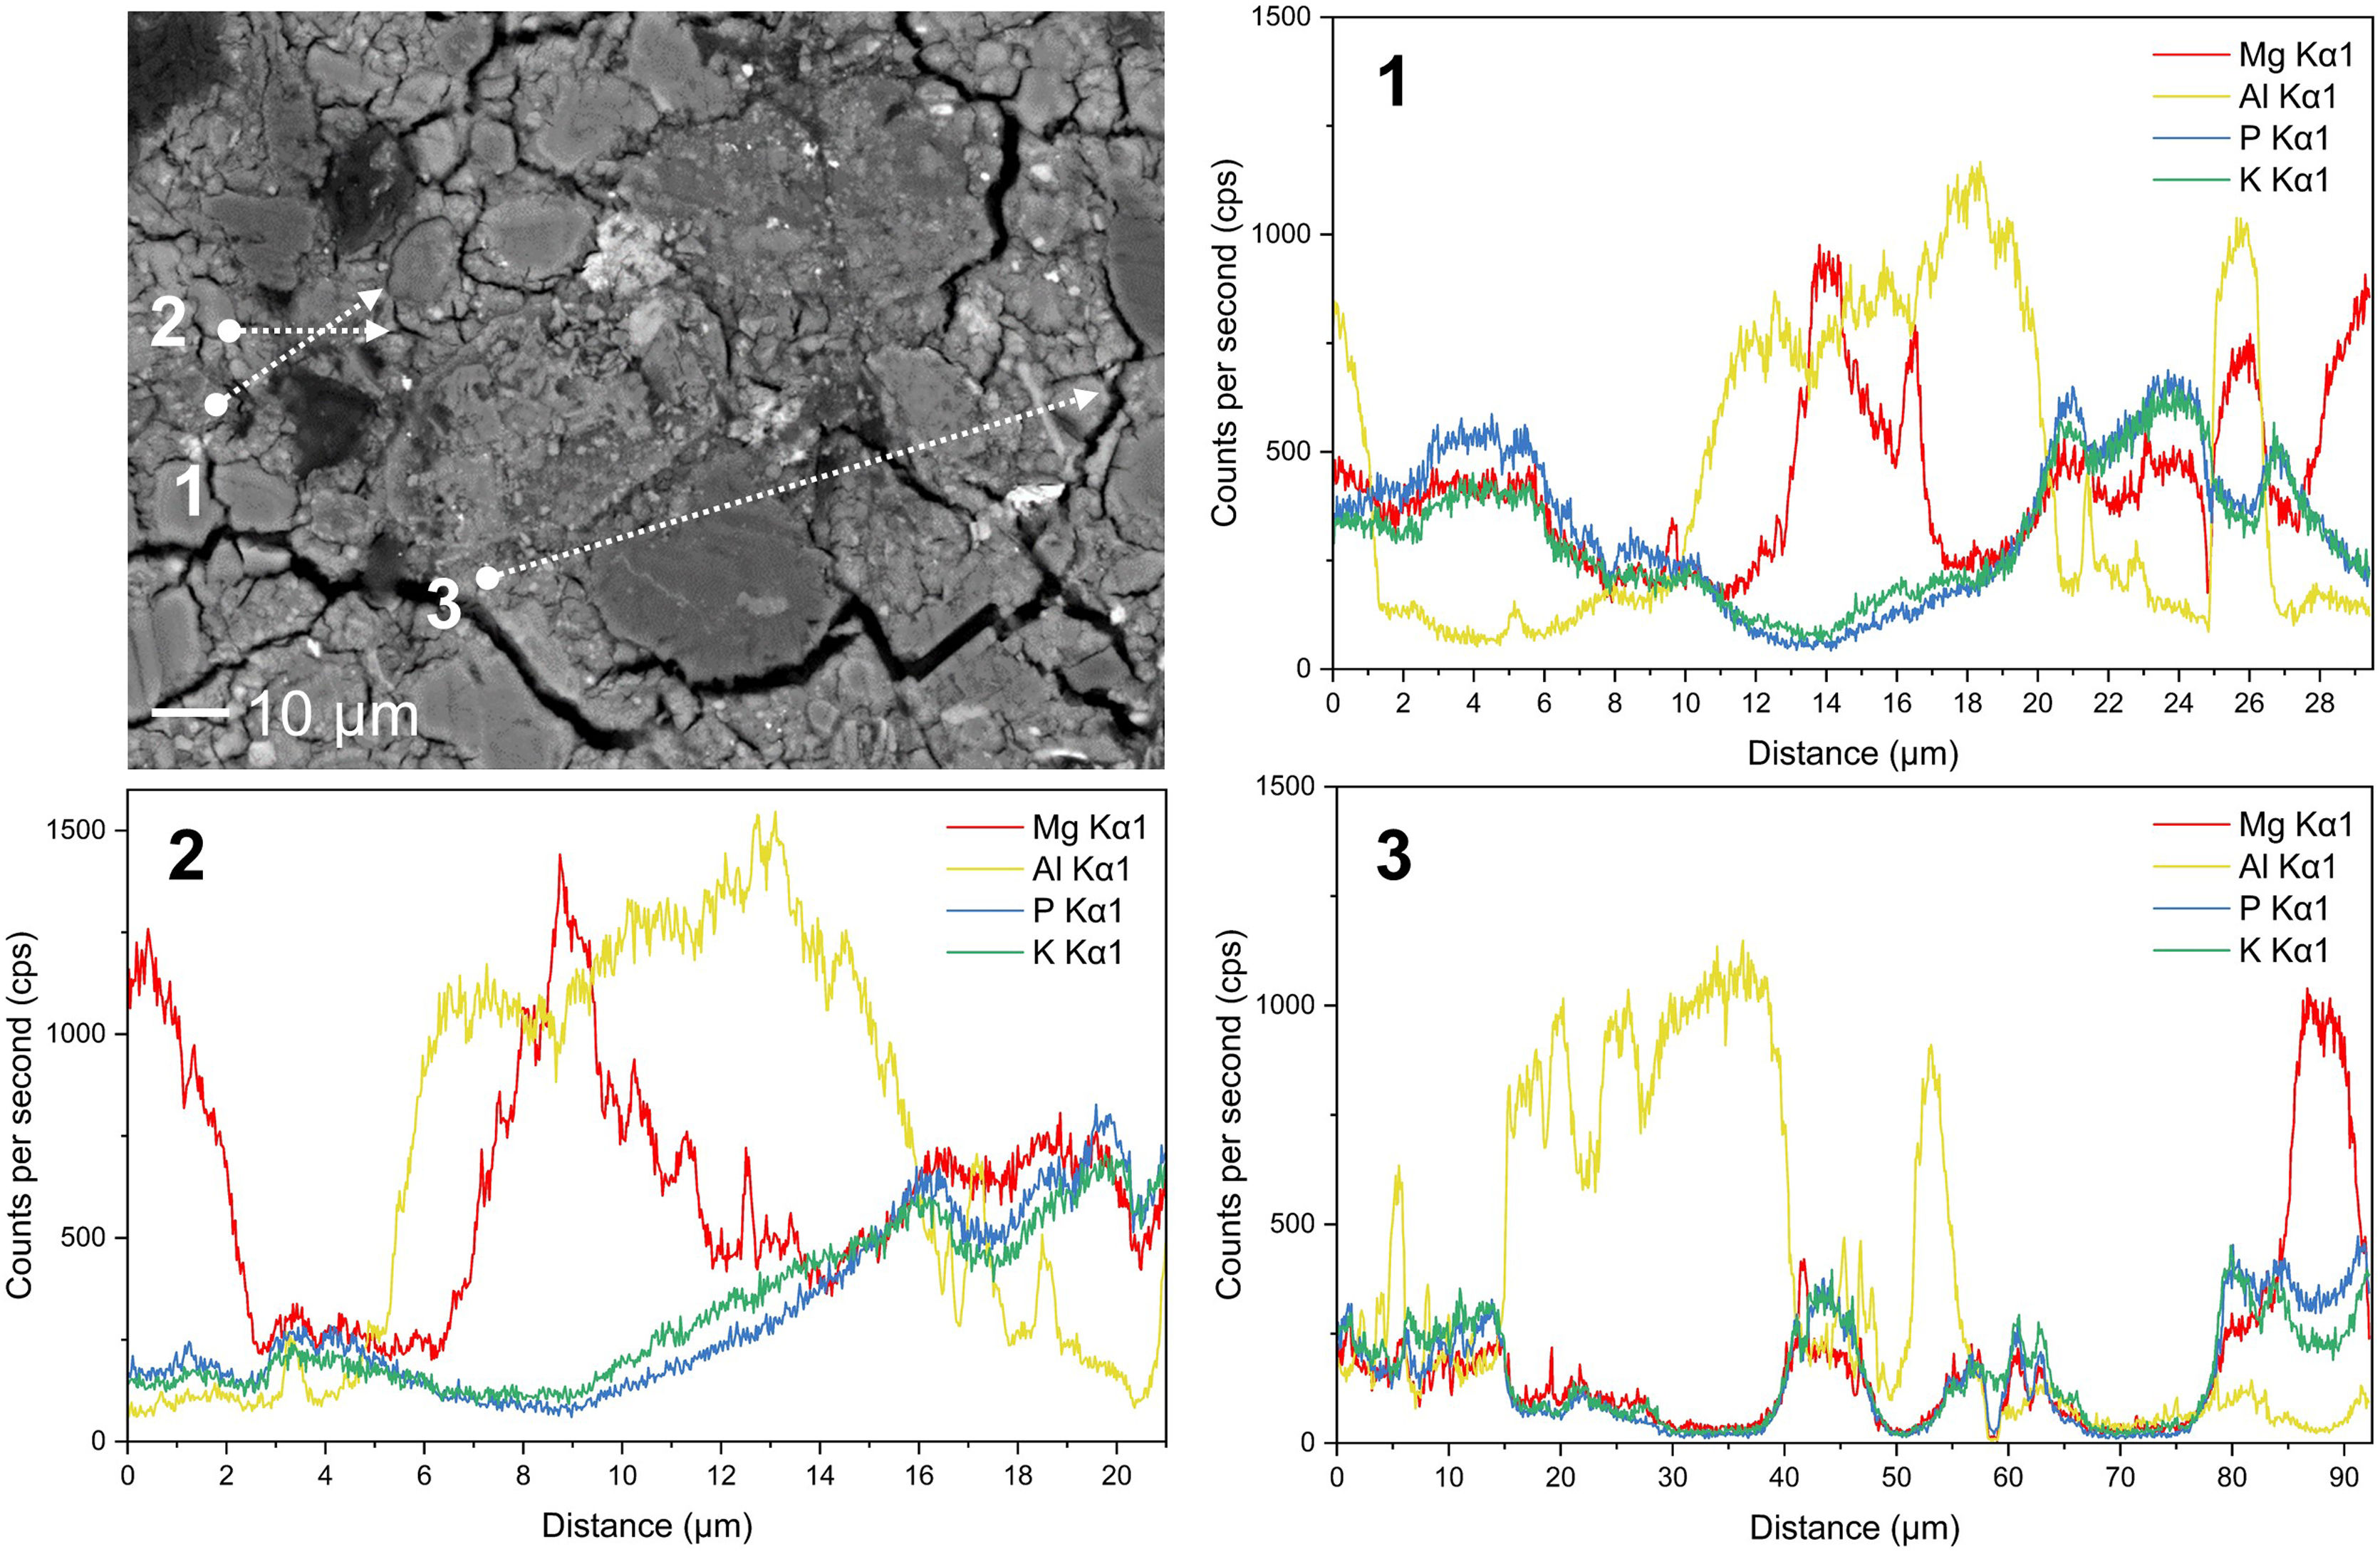
As it is shown in Fig. 7 EDS line scans of some Al-rich particles were performed to determine the penetration of P and Mg into these particles. The results show that Mg, P, and K enter with the same rate into the particles and penetrate the first 2μm inside and, Al Kα1signal persists in most of the K-struvite matrix as well as Mg, P and K Kα1 signal, indicating the possibility of Al presence inside the matrix.
Micromortars leaching test.")
Leaching tests were performed following EN 12457-2 standard [49] to assess the environmental footprint of the micromortars at their end-of-life cycle. Table 4 presents the leaching test results for potentially hazardous heavy metals. Regarding the results in Table 4, it can be observed that the concentrations in the solids are below the limits established for waste disposal in landfills defined in the Directive 1999/31/EC of the European Union [71]. Concentrations over hazardous limits are not accepted for disposal in landfills in the EU and must be previously stabilised. Compared to the leaching tests of both by-products used as raw materials (PV and LG-MgO), these concentrations are considerably reduced in the Sust-MPC-PV. Thus, raw material and micromortars would be accepted for their controlled and safe disposal in EU landfills. In the case of the micromortars, it can be noticed an increase in As with the increasing addition of PV. The As is mainly leached from PV and KH2PO4 driven by the action of a pH near 10.8, which has a higher leaching capacity for pH-dependent heavy metals [72]. However, MPC is not as alkaline as other types of cement, which can generally lead to the lighter leaching of heavy metals [72]. Also, Sb and Se are over the non-hazardous limit for non-hazardous materials. Sb exceeds the limit only in the case of PV35 and Se exceeds the limit in the case of PV 17.5 and PV 35, almost halving the concentration in PV by-product by particle encapsulation and because of PV proportion in the micromortar. Since WS-formulations have more water in their composition (superior W/C ratio) they tend to have a lower concentration of any studied element, diluting the resulting mass of micromortar.
ConclusionThe production of sustainable magnesium phosphate cement – PAVAL® micromortars (Sust-MPC-PV) has been proved viable, revalorising both low-grade magnesium oxide (LG-MgO) and PAVAL® (PV) promoting an environmentally safe circular economy.
- -
The addition of PV into sust-MPC enhances the mechanical behaviour of the sust-MPC-PV, which indicates a good inclusion of PV particles into the K-struvite matrix composing MPC.
- -
The addition of PV also leads to a slight increase in open porosity of the samples without affecting the overall mechanical performance, suggesting the matrix has been successfully reinforced.
- -
Sust-MPC-PV can be environmentally safe as proven by the leaching test.
- -
To obtain a non-hazardous landfill classification at the end of their useful life, the addition of PV must be under 17.5wt.%.
- -
These micromortars denote their potential application for design and industrialisation of urban elements and architectural concrete, as well as to manufacture precast blocks.
- -
Backscattered electron microscopy with energy dispersive X-ray spectroscopy (BSEM-EDS) analysis revealed the possibility of some degree of interaction between Al-rich particles and the K-struvite matrix.
- -
Further investigations should focus on the interaction between Al-rich particles and the K-struvite matrix, which could be a mechanism to enhance the mechanical performance of the material.
Sergio Huete-Hernández: Conceptualisation, Investigation, Writing – Original Draft; Alex Maldonado-Alameda: Validation, Writing – review & editing; Jessica Giro-Paloma: Validation, Writing – review & editing; Anna Alfocea-Roig: Investigation, Writing – Original Draft; Josep Maria Chimenos: Writing – review & editing, Funding acquisition; Joan Formosa: Conceptualisation, Supervision, Writing – review & editing, Funding acquisition.
Grant PID2021-125810OB-C21 funded by MCIN/AEI/10.13039/501100011033, and by ERDF A way of making Europe, and RTI2018-093849-B-C32 funded by the Spanish government. The authors are grateful to the Catalan Government for the quality accreditation given to their research group DIOPMA (2017 SGR 118). DIOPMA is a certified agent TECNIO in the category of technology developers from the Government of Catalonia. The research was partially funded by Magnesitas Navarras, S.A. We would like to thank Befesa Company for supplying the PV, and Mr. Alberto Blanca for aiding with the experiments. Mr. Sergio Huete-Hernandez and Ms. Anna Alfocea-Roig are grateful to the Government of Catalonia for their research Grants (APIF-DGR 2018 and FI-DGR 2021). Dr. Jessica Giro-Paloma is a Serra Húnter fellow. Dr. Alex Maldonado-Alameda is a Margarita Salas fellow.

