


Highly efficient IR-blue light up-converting NaYF4: Yb3+, Eu2+ phosphors have been prepared by a template-free hydrothermal method under mild and reductive experimental conditions. It has been demonstrated that for a fixed reaction time and temperature (150°C/4h), the α→β NaYF4 conversion can be accurately controlled by modifying the F/Y ratio. UC emission spectroscopy reveals that IR-blue light emission efficiency is greatly improved when β-NaYF4 phase predominates. Under the experimental conditions set in this work, reaching full α→β conversion just by increasing fluoride content entails the co-crystallization of the secondary phase YF3 1.5NH3, but far from causing a detrimental effect on the optical properties, it has been found that the samples where both β-NaYF4 and YF3 1.5NH3 phases coexist, exhibit outstanding optical properties.
Fósforos anti-Stokes NaYF4: Yb3+, Eu2+ de alta eficiencia para la conversión de radiación infrarroja en luz azul han sido satisfactoriamente sintetizados mediante un procedimiento hidrotermal en medio reductor, en ausencia de «template» y bajo condiciones experimentales suaves. Se ha demostrado que, para un tiempo y temperatura de reacción dados (150°C/4h), el equilibrio entre las fases polimórficas α→β del NaYF4 puede ser controlado de manera precisa mediante la modificación de la relación F/Y en el medio de reacción. Los resultados obtenidos mediante espectroscopía de fluorescencia revelan que la eficiencia con la que los fósforos sintetizados transforman radiación IR en luz azul aumenta significativamente cuando la fase predominante es β-NaYF4. Bajo las condiciones experimentales establecidas en esta investigación, alcanzar una conversión α→β completa modificando únicamente el contenido de iones fluoruro conlleva la co-cristalización de la fase secundaria YF3 1.5NH3 pero, lejos de entrañar un efecto negativo, se ha comprobado que los materiales luminiscentes donde ambas fases β-NaYF4 e YF3 1.5NH3 coexisten, exhiben propiedades ópticas excepcionales.
Over the last decades, upconverting (UC) luminescence materials have attracted the attention of the international scientific community. This is demonstrated by the great amount of published research work and effort focused on understanding and optimizing the synthesis of UC-phosphors [1–3]. UC process basically consists on transforming incident electromagnetic radiation into shorter wavelength emitted radiation, i.e., with a higher energy [1,2]. UC phosphors are generally composed by an inorganic crystalline host matrix and dopants which act as optical centers absorbing and re-emitting the incident radiation. At this respect, it is well known that rare earths (RE) ions, due to their electronic configuration, can display IR to UV–visible UC performance [1].
Their capacity to transform infrared radiation into higher energy radiation (anti Stokes emissions) has positioned UC phosphors as an outstanding and advantageous option in numerous technological applications and fields against other luminescent materials. In photocatalytic applications, for instance, several research groups have addressed improved responses when combining UC phosphors and semiconductor materials due to the extended availability of suitable energy provided by these phosphors [4–7]. In life science and analytical applications, the lower excitation energy (infrared) required by these phosphors turns into lower autofluorescence and scattering of the excitation radiation and minimizes the risk of tissue and cells photodamage, despite of many other advantages dealing with their unique optical properties [8–10].
The selected rare earth/s determines, to a large extent, the wavelength of the emitted photons, what enables tailoring UC phosphors depending on the specific application. It is nowadays accepted that only with certain RE combinations and degrees of substitution, suitable UC luminescence takes place. The better performance obtained when working with certain RE ions in pairs is due to an energy transfer process from one of them, the sensitizer (S), which efficiently harvests the incident electromagnetic radiation and makes it available for the activator centers (A), where the strongest UC emission occurs [1]. The sensitizer ion par excellence is Yb3+ while several multicolor options, mainly in the green-red range of visible light, are possible depending on the chosen activators and its concentration [1,3,11,12].
Though RE ions are the source of luminescence, the host matrix also impacts on the final optical properties, hence, many research works have been centered on studying its influence and the requirements that should be fulfilled to obtain an optimal behavior. On this matter, the host should exhibit chemical and photo-stability, a high refractive index (high optical transparency over a wide wavelength range) and low phonon lattice energy in order to minimize non-radiative losses. Many different hosts have been covered and, among them all, sodium yttrium fluoride (NaYF4) has emerged as a promising candidate [13]. This fluoride exhibits two polymorphic phases, namely: cubic α-NaYF4 and hexagonal β-NaYF4. Among them, β-NaYF4 is the thermodynamically stable phase and exhibits better optical properties than the cubic polymorph [14–16].
Despite the encouraging results addressed so far, optimized UC phosphors synthesis is still far from the scope. In the particular case of doped NaYF4 synthesis, the available bibliography brings to light that the final optical properties are greatly influenced by its crystalline phase (cubic α-NaYF4 and/or hexagonal β-NaYF4), morphology and particle size and these factors are, in turn, strongly dependent on the experimental conditions (pH, fluoride source, time, temperature, synthesis methodology, etc.), which leads to low reproducibility. A prove of it is the great amount of published works dealing with NaYF4 synthesis and the extended use of templates and growing directors in order to control crystalline phase, particle size and morphology [11,14,16–20].
Based on the current state of art, and taking into consideration the importance of setting easy and reproducible experimental methodologies to reach a real application of UC phosphors, this research work aims to evaluate the influence of fluoride concentration on α→β conversion equilibrium and how this equilibrium impacts on the final optical properties of the as-prepared phosphors. In doing so, a template-free hydrothermal synthesis route is proposed in order to work under mild and environmental-friendly experimental conditions (templates often lead to undesirable contamination of the resulting products), while facilitating a better understanding of the crystallization mechanism of NaYF4. Most of the reported results dealing with up converting RE pairs fall within the green-red range of visible light while blue light RE pairs, besides Tm3+, have been barely addressed in the specialized literature. Aiming to explore more options in the blue light region of the spectrum and with future photocatalytic applications in mind, Yb3+ (S) and Eu2+ (A) are selected as NaYF4 dopants. Eu3+ is a well known red-light emitting phosphor [11,12,18] but higher energy Eu2+ UC phosphors haven’t been so widely covered. In the present investigation, the potential tuning from red Eu3+ to blue Eu2+ emissions by means of a reductive hydrothermal route will be evaluated.
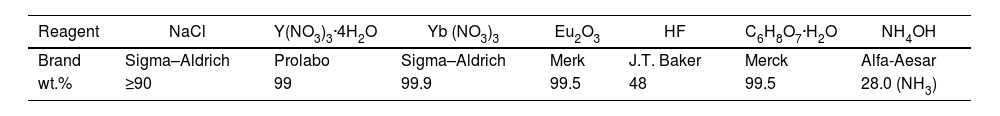
Experimental procedureTable 1 shows all the information dealing with the reagents employed for NaYF4 synthesis. Concentrated HF was selected as the source of fluoride ions. All the reagents were incorporated as received, except europium which was incorporated as a previously prepared europium citrate solution. The concentration of Eu3+ in this dissolution was determined by means of inductively coupled plasma mass spectrometry (ICP-OES) yielding a concentration of 24.4g Eu3+/L.
The precursors were mixed in stoichiometric proportion except fluoride ions which were incorporated always in excess in order to compensate F− losses during the process of dissolution–crystallization and favor saturation. Yttrium was partially substituted by Yb3+ and Eu3+ aiming a NaY07F4:Yb0.25Eu0.05 nominal composition.
Solid NaCl, Yb (NO3)3 and Y(NO3)3·4H2O were weight and dissolved in 20.0ml of distilled water under magnetic stirring for 30min. Afterwards, europium citrate was added to the dissolution and stirred for 20 more minutes. After checking that the dissolution was homogeneous, it was carefully transferred to a Teflon vessel and the corresponding volume of HF for each synthesis was incorporated to the reaction media. After 15–20min, 2.0ml of NH4OH were added to generate a reductive medium. It was checked that, at this point, pH was always over 12 irrespective of the amount of HF added to the solution. The Teflon vessel was placed in the reactor and heated up to the selected temperature in an oven. Afterwards, it was allowed to cool down at room temperature. The resulting solid and liquid phases were separated by decantation after approximately 20h settling. The solid phase was washed with 20ml of distilled water and stirred for 30min. After settling, liquid and solid phases were separated again by decantation and the solid phase was washed with distilled water once more. After decantation, the obtained powder was dried in an oven at 80°C.
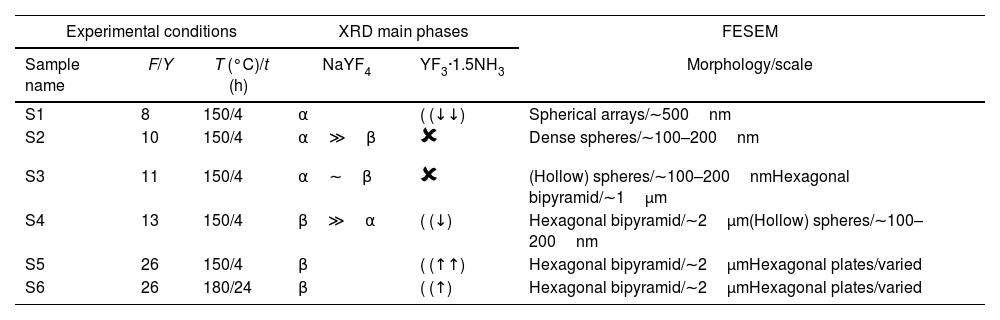
Table 2 gathers the labeling, composition and relevant information concerning the different samples synthesized and analyzed in this study. Samples S1–S5 were synthesized with increasing F/Y molar ratios and by setting a constant temperature (150°C) and reaction time in the oven (4h). For a selected composition (F/Y=26), the effect of simultaneously increasing time and temperature was likewise evaluated (S6).
Sample labeling and relevant information dealing with NaYF4 synthesis. Y=(Y3++Eu3++Yb3+).
| Experimental conditions | XRD main phases | FESEM | |||
|---|---|---|---|---|---|
| Sample name | F/Y | T (°C)/t (h) | NaYF4 | YF3·1.5NH3 | Morphology/scale |
| S1 | 8 | 150/4 | α | ( (↓↓) | Spherical arrays/∼500nm |
| S2 | 10 | 150/4 | α≫β | Dense spheres/∼100–200nm | |
| S3 | 11 | 150/4 | α∼β | (Hollow) spheres/∼100–200nmHexagonal bipyramid/∼1μm | |
| S4 | 13 | 150/4 | β≫α | ( (↓) | Hexagonal bipyramid/∼2μm(Hollow) spheres/∼100–200nm |
| S5 | 26 | 150/4 | β | ( (↑↑) | Hexagonal bipyramid/∼2μmHexagonal plates/varied |
| S6 | 26 | 180/24 | β | ( (↑) | Hexagonal bipyramid/∼2μmHexagonal plates/varied |

The analysis of the crystalline structure and phase identification were performed by X-ray diffraction on an XRD Bruker D8-Advance diffractometer with a monochromatized source of CuKα1 radiation (λ=1.5406nm). Field emission scanning electron microscopy allowed us to study the morphology and particle size distribution of the as-synthesized powders. Additionally, EDX measurements were also conducted to check if RE ions are into the host matrix structure after the experimental process. FESEM-EDX measurements were carried out on a Hitachi S 4700 Cold-FESEM working at 20kV. UC emission spectra were acquired with an Edinburgh Instruments FS5-spectrofluorimeter equipped with an external 980nm laser. The laser power was set at 0.56W.
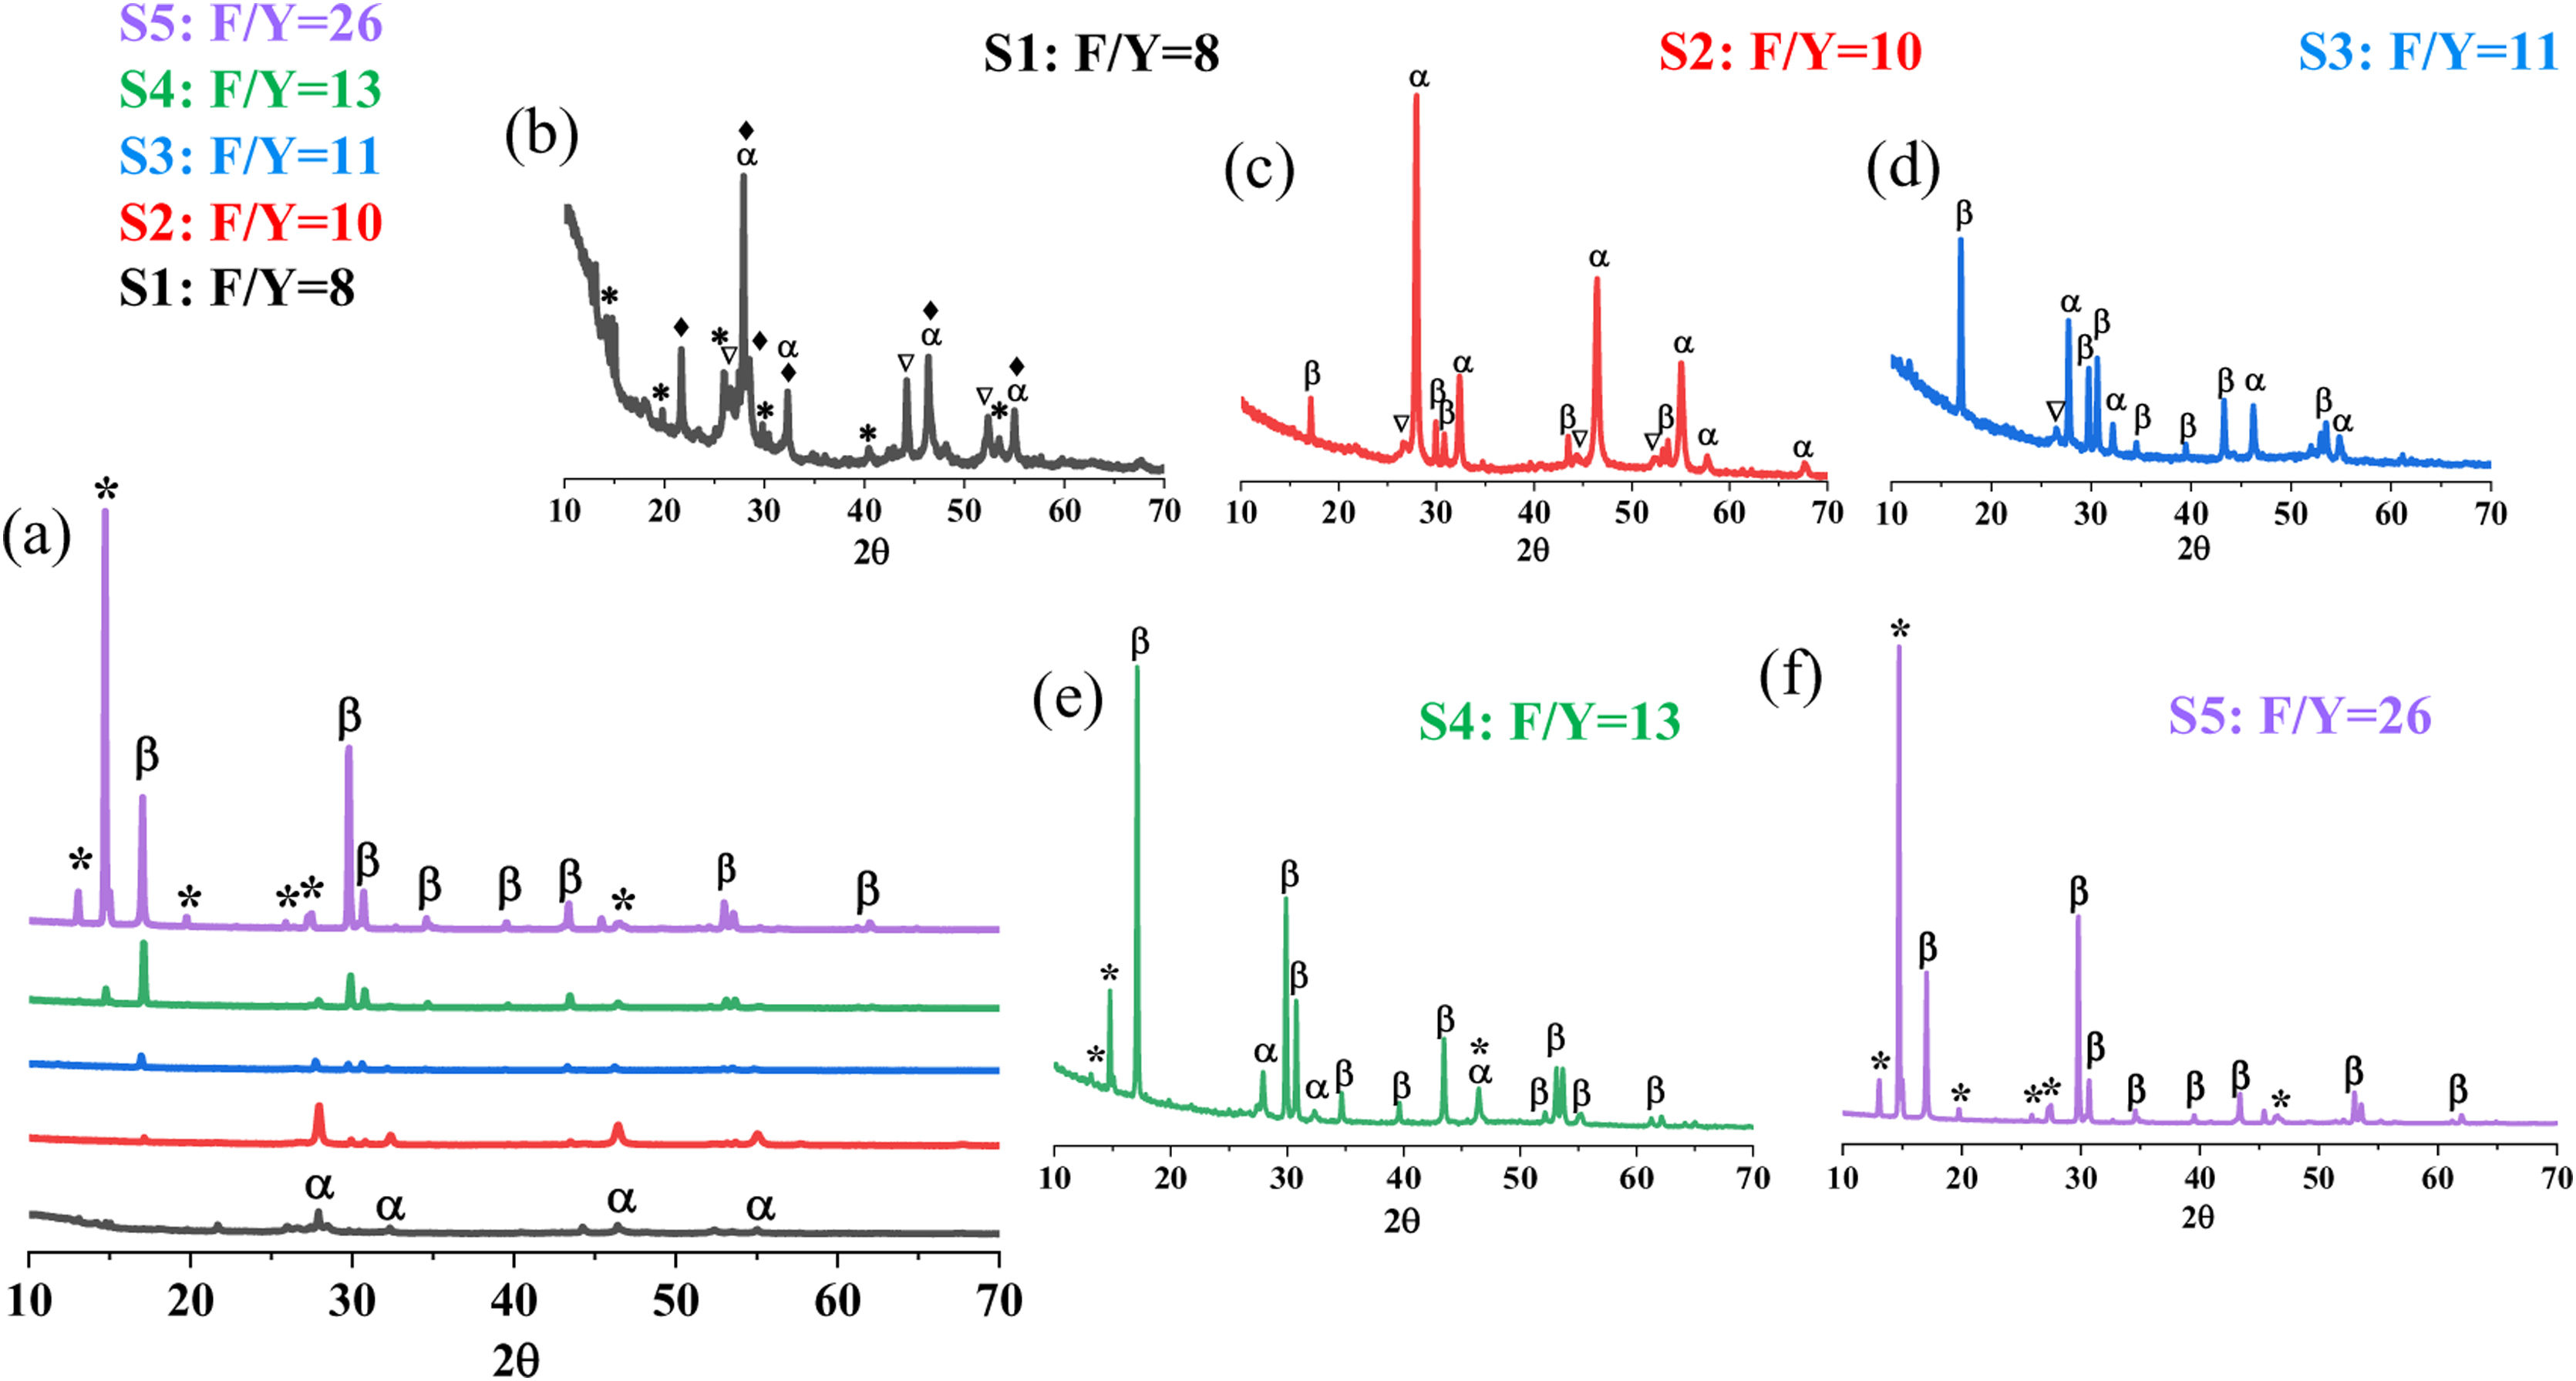
Results and discussionSynthesis of NaYF4: Yb/EuFig. 1 depicts the XRD patterns corresponding to the NaYF4: Yb/Eu powder samples synthesized by the hydrothermal method at 150°C for 4h and with an increasing content of F− ions (see Table 2, S1–S5). At first glance, Fig. 1a, these analyses indicate that increasing fluorine content leads to a higher degree of reaction that first facilitates the α to β conversion of NaYF4 compound, but then evolves toward the concurrent (competitive) formation of the ammonia complex YF3·1.5NH3 (identified with an asterisk in the diffractograms). It should be mentioned that the peaks of these three major compounds all appear slightly shifted with respect to their corresponding ICDD patterns, which is indicative of an effective incorporation of the rare earth dopants (Yb and Eu). Looking in more detail, it is observed that in the sample with the lowest fluorine content (S1) the reaction has progressed vaguely, the cubic α-NaYF4 is the major phase but a large amount of by-products and intermediates are still present. As the fluorine content increases, so does the degree of reaction, and this favors the crystallization of both the cubic α-NaYF4 phase and its hexagonal polymorph β-NaYF4. Both crystallographic forms indeed coexist for a certain range of the F/Y ratio, samples S2–S4, although gradually the hexagonal β-phase becomes predominant with respect to the cubic one (Fig. 1c–e). When the F/Y molar ratio is higher than 13, the cubic α-NaYF4 phase is no longer detected by XRD (Fig. 1f). In this respect, a similar evolution of the crystalline phases has already been reported by other authors but working with a fixed fluorine content (constant F/Y ratio) and varying the reaction time [14,21].
 X-ray diffractograms of the synthesized NaYF4: Yb/Eu powders at 150°C/4h with an increasing F/Y ratio. Detailed diffractograms corresponding to phosphors produced with F/Y molar ratios equal to (b) 8, (c) 10, (d) 11, (e) 13 and (f) 26. Key: α: cubic Na1.5Y2.5F9 (ICDD 039-0723), β: hexagonal Na1.5Y1.5F6 (ICDD 016-0334), ★: YF3 1.5NH3 (ICDD 028-1449), ♦: NaYb2F7 (ICDD 043-1126), ▿: EuF2.25 (ICDD 0260625).")
(a) X-ray diffractograms of the synthesized NaYF4: Yb/Eu powders at 150°C/4h with an increasing F/Y ratio. Detailed diffractograms corresponding to phosphors produced with F/Y molar ratios equal to (b) 8, (c) 10, (d) 11, (e) 13 and (f) 26. Key: α: cubic Na1.5Y2.5F9 (ICDD 039-0723), β: hexagonal Na1.5Y1.5F6 (ICDD 016-0334), ★: YF3 1.5NH3 (ICDD 028-1449), ♦: NaYb2F7 (ICDD 043-1126), ▿: EuF2.25 (ICDD 0260625).
Another interesting feature of the synthesized powders is the observed crystallization of the YF3 1.5 NH3 compound. This complex, as well as the ammonia-free parent compound YF3, are recurrently observed in the various protocols that have been investigated to produce β-NaYF4 nanocrystals. Actually, several factors in the synthesis can determine which fluorinated species can be preferentially obtained, including the pH of the mother solution [22], the precursor sources of fluorine [23] as well as the F/Ln molar ratio itself [24]. The latter is what we observe in our XRD measurements (Fig. 1): initially when dealing with low F/Y ratios, the YF3 1.5NH3 phase is present as a minor secondary phase (sample S1, F/Y=8), but it rapidly fades to the X-ray eye when slightly increasing the fluoride proportion (samples S2, S3); then, above the mentioned threshold F/Y ratio of 13, it is again detected and even gains importance over the NaYF4 phase if the fluoride content is further increased (sample S5). Accordingly, the XRD analyses suggest that within the synthesis conditions initially considered, 150°C/4h, the most suitable situation from the point of view of the NaYF4 α→β conversion would be that of sample S4 with F/Y=13, in which the hexagonal polymorph predominates and the percentage of secondary phases is lower. As mentioned above, β-NaYF4 exhibits better UC performance than the cubic phase [14–16]. However, sample S5 cannot be ruled out either, as YF3 compounds have also proven to be excellent hosts for up conversion processes [25,26].
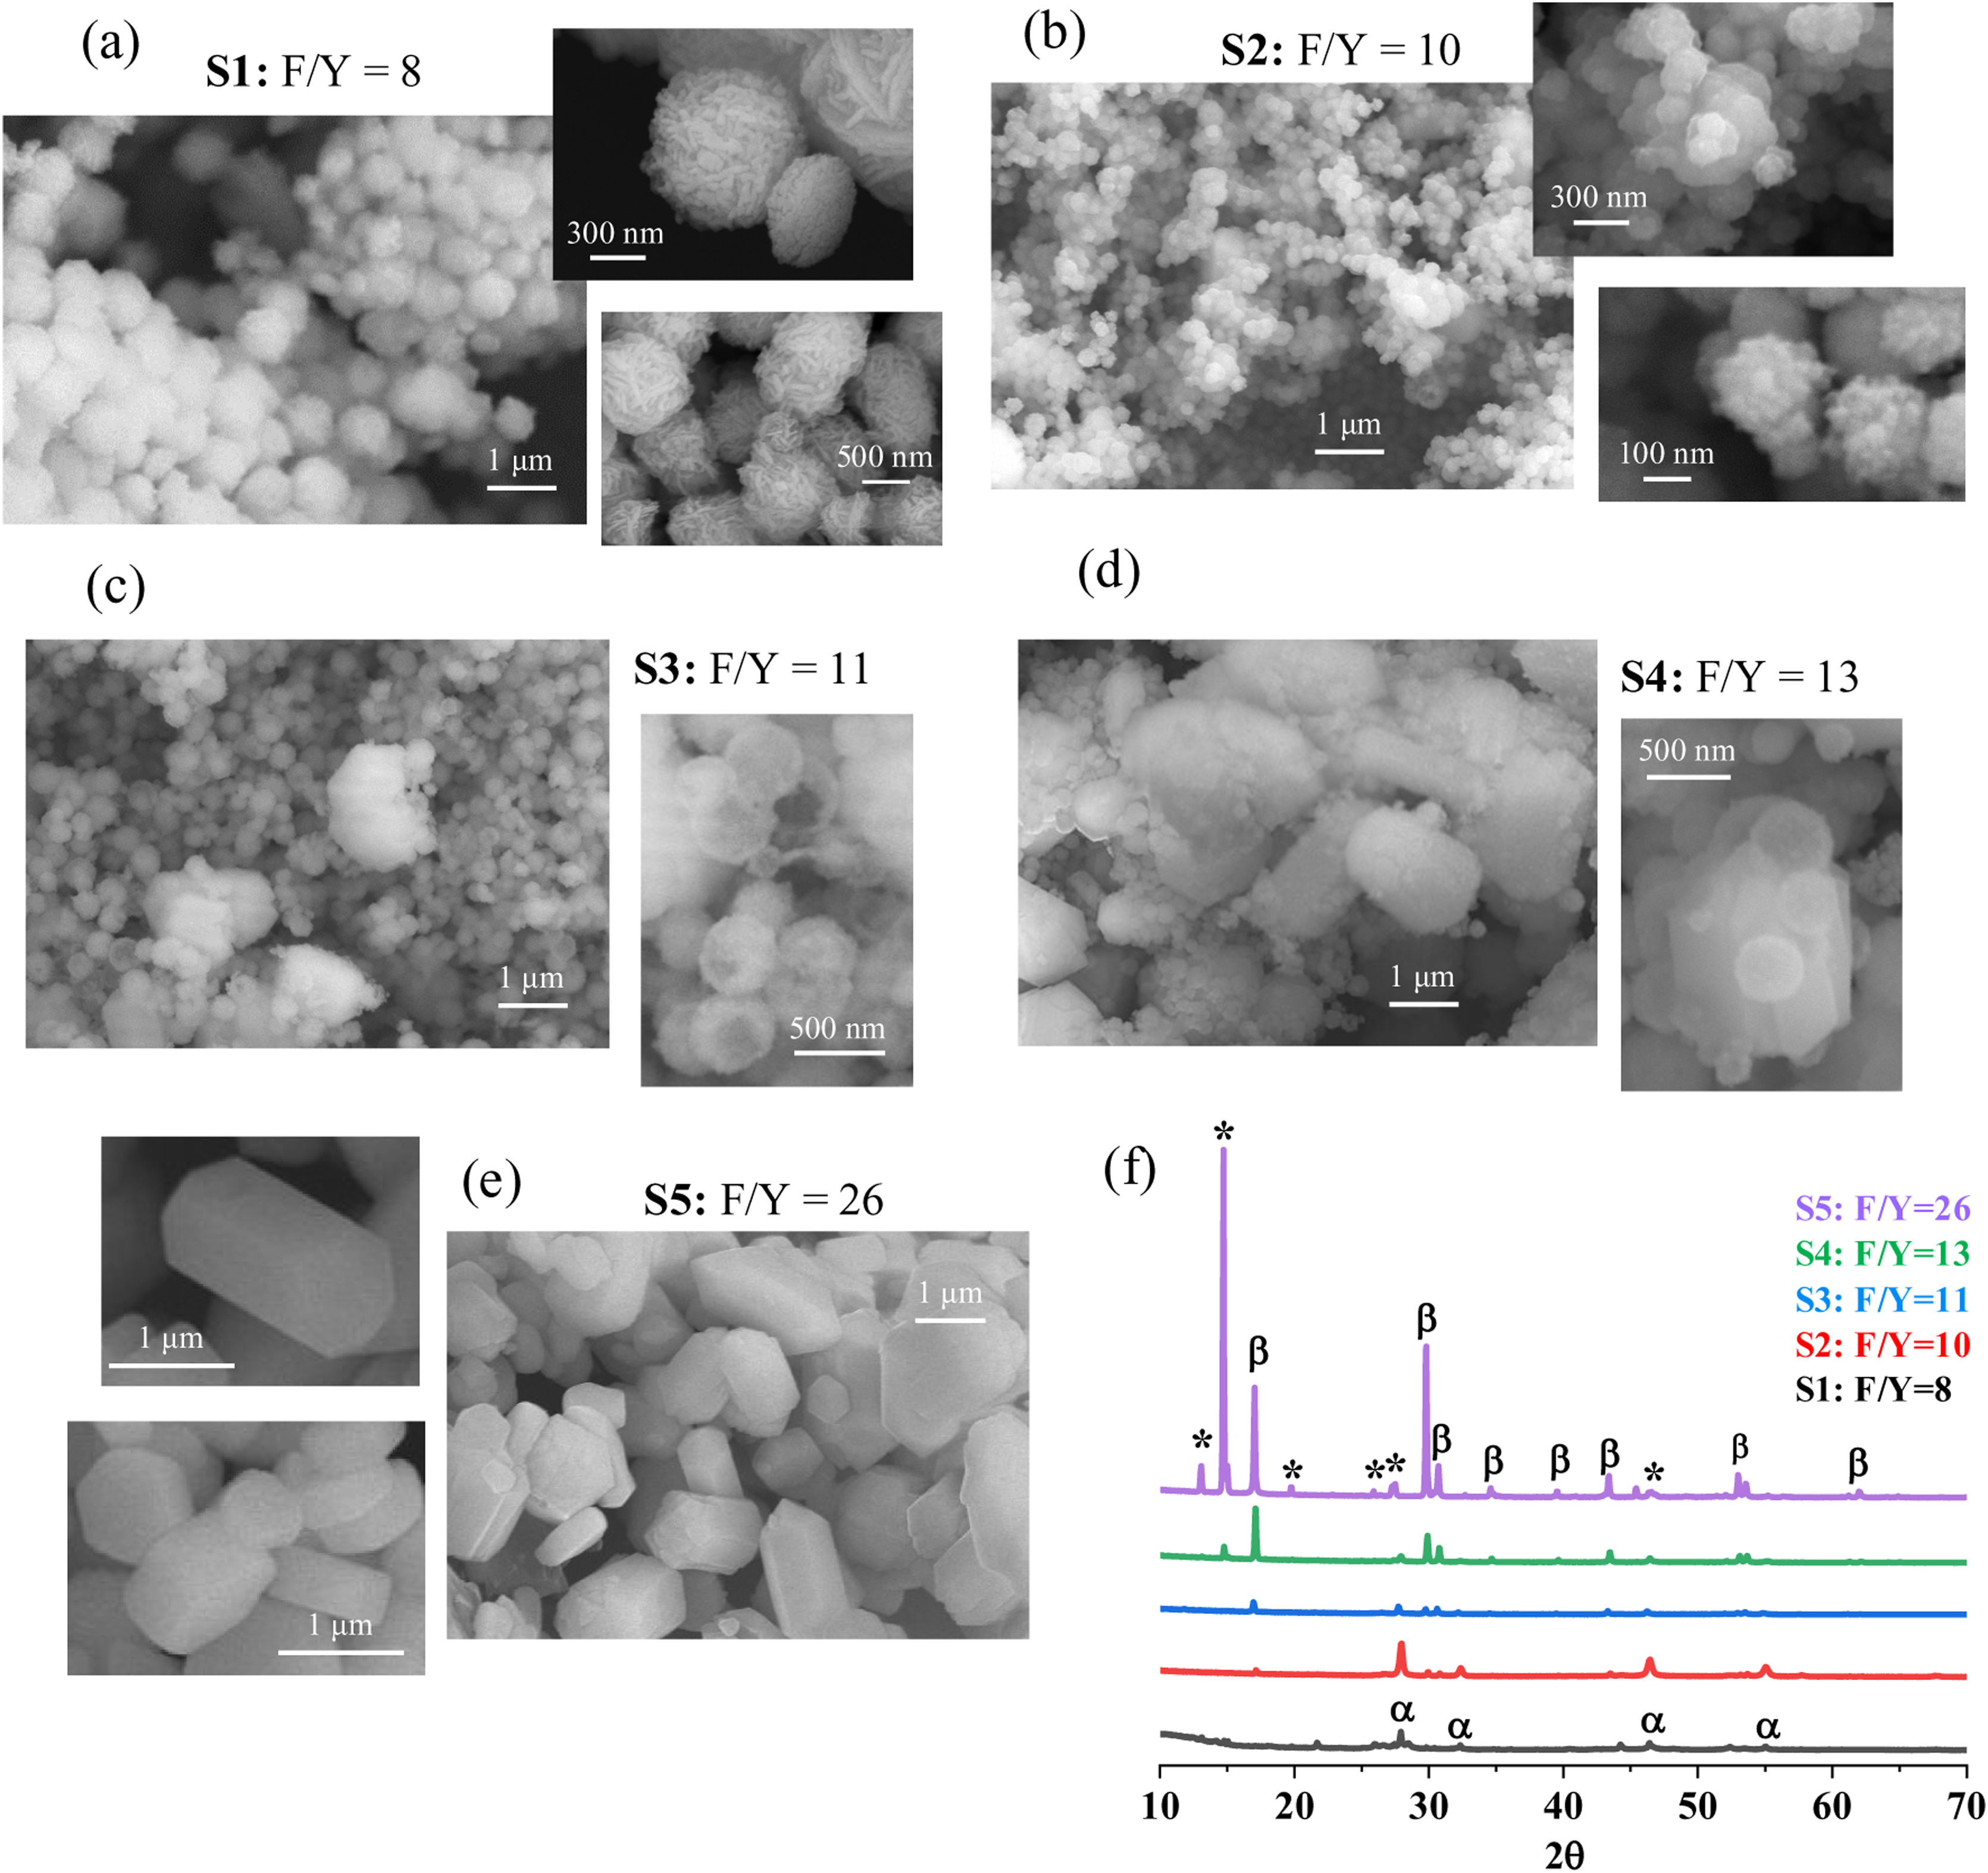
The evolution of α→β conversion as a function of the F/Y ratio as followed by FESEM is depicted in Fig. 2, where representative micrographs of each powder (S1–S5) have been gathered together with the abridged XRD evolution to facilitate interpretation.
 Evolution of α→β conversion as a function of F/Y ratio followed by FESEM and (f) XRD diffractograms corresponding to the as synthesized powders. Key: α: cubic Na1.5Y2.5F9 (ICDD 039-0723), β: hexagonal Na1.5Y1.5F6 (ICDD 016-0334), ★: YF3 1.5NH3 (ICDD 028-1449).")
The acquired micrographs show a distinctive microstructural progression with F/Y ratio in which the samples evolve from a hodgepodge of spherical structures toward the crystallization of elongated particles with characteristic hexagonal (prismatic) morphology and considerably larger size. A close, sample-by-sample observation and the corresponding correlation with the XRD data, allows identifying the observed morphologies with the α and β phases of NaYF4 as follows: first, FESEM images of S1 sample synthesized with F/Y equal to 8 (Fig. 2a) evidence a powder comprised of tightly agglomerated spherical units with an average size around 500–700nm which are indeed constituted of highly packed array of nanoparticles. Several factors in the preparation method can contribute to this spherical alignment, including a rearrange (coalescence) mechanism of the as-formed α-phase nanocrystals driven by surface energy reduction and preceding the α→β transformation [27]. As seen above, XRD suggests that these multi-particle spheres are primarily composed of the α-NaYF4 phase, but still, numerous traces of intermediate by-products can be observed.
The presence of the intermediates largely decreases when increasing the F/Y ratio to 10 in sample S2, consequence of an enhanced progression of the α-NaYF4 crystallization reaction. Despite this compositional evolution, the SEM characterization shows that the crystallographic units preserve the spherical morphology, displaying a clearly smaller diameter (ca. 200nm) and sustaining also a certain degree of nanostructuration, see magnified images in Fig. 2b. Further increasing the F/Y ratio leads to a slight growth in the average size of the spheres and the appearance of the first micrometer-sized crystals in which some hexagonal prism-like morphology can already be inferred, sample S3, Fig. 2c. This scenario again agrees with the corresponding XRD measurements which indicated a sort of inflection point in the α→β conversion for this F/Y ratio equal to 11 (Fig. 1d).
Interestingly, many of the spheres in this S3 powder appear hollow and sometimes broken, see magnified image in Fig. 2c, which may be interpreted as the α-phase dissolving and contributing to the crystallization of the β-phase. Actually, it is generally accepted that for hydrothermal methods such as the one practiced in this study, a reaction mechanism occurs during the synthesis of NaYF4 powders that involves the initial formation of small α-phase nanoparticles, which are then converted through a dissolution/recrystallization step into larger β-phase particles (the growth of the latter following a classical Ostwald ripening phenomenon) [28,29]. When the F/Y ratio is increased to 13, sample S4, the corresponding XRD already pointed to a significant conversion to the β phase (Fig. 1e); in the FESEM images this is reflected in the increased presence of the large hexagonal prisms (length>1μm) which, however, still appear surrounded by a blurred mass of spherical α-phase particles. At this respect, the magnified image in Fig. 2d shows what could be the in-process nucleation of a hexagonal particle from hollow spheres, which may support the outlined dissolution–crystallization of NaYF4 phases. Finally, when the F/Y ratio is further increased in sample S5, the spherical particles are no longer observed under the microscope beam, which is consistent with the absence of diffraction maxima of the α-NaYF4 phase in the corresponding XRD analysis (Fig. 1f). This means that the α phase has been fully consumed to complete the β-crystallization and as a straight consequence, all hexagonal particles now show a sharp and well-defined shape with a varied morphology ranging from bipyramidal prisms (length around 2μm) to flattened platelets of different thickness, Fig. 2e. On the other hand, the XRD measurements indicated a remarkable presence of YF3 1.5NH3, ICDD 028-1449 (some authors also propose NH4Y2F7, ICDD 043-0847 [30]) together with the β-NaYF4 phase in this S5 sample. Whether the observed particles and morphologies belong to the ammonia complex or the β-phase is something we cannot discern by SEM-EDX and this is actually a recurring source of debate in the specialized literature as both structures share many similarities. Recently, Shao et al. have shown that the high structural matching between YF3 parent compound and β-NaYF4 can induce their topotactic transformation even at room temperature [31]. An additional experiment corroborating this particular situation is presented below.
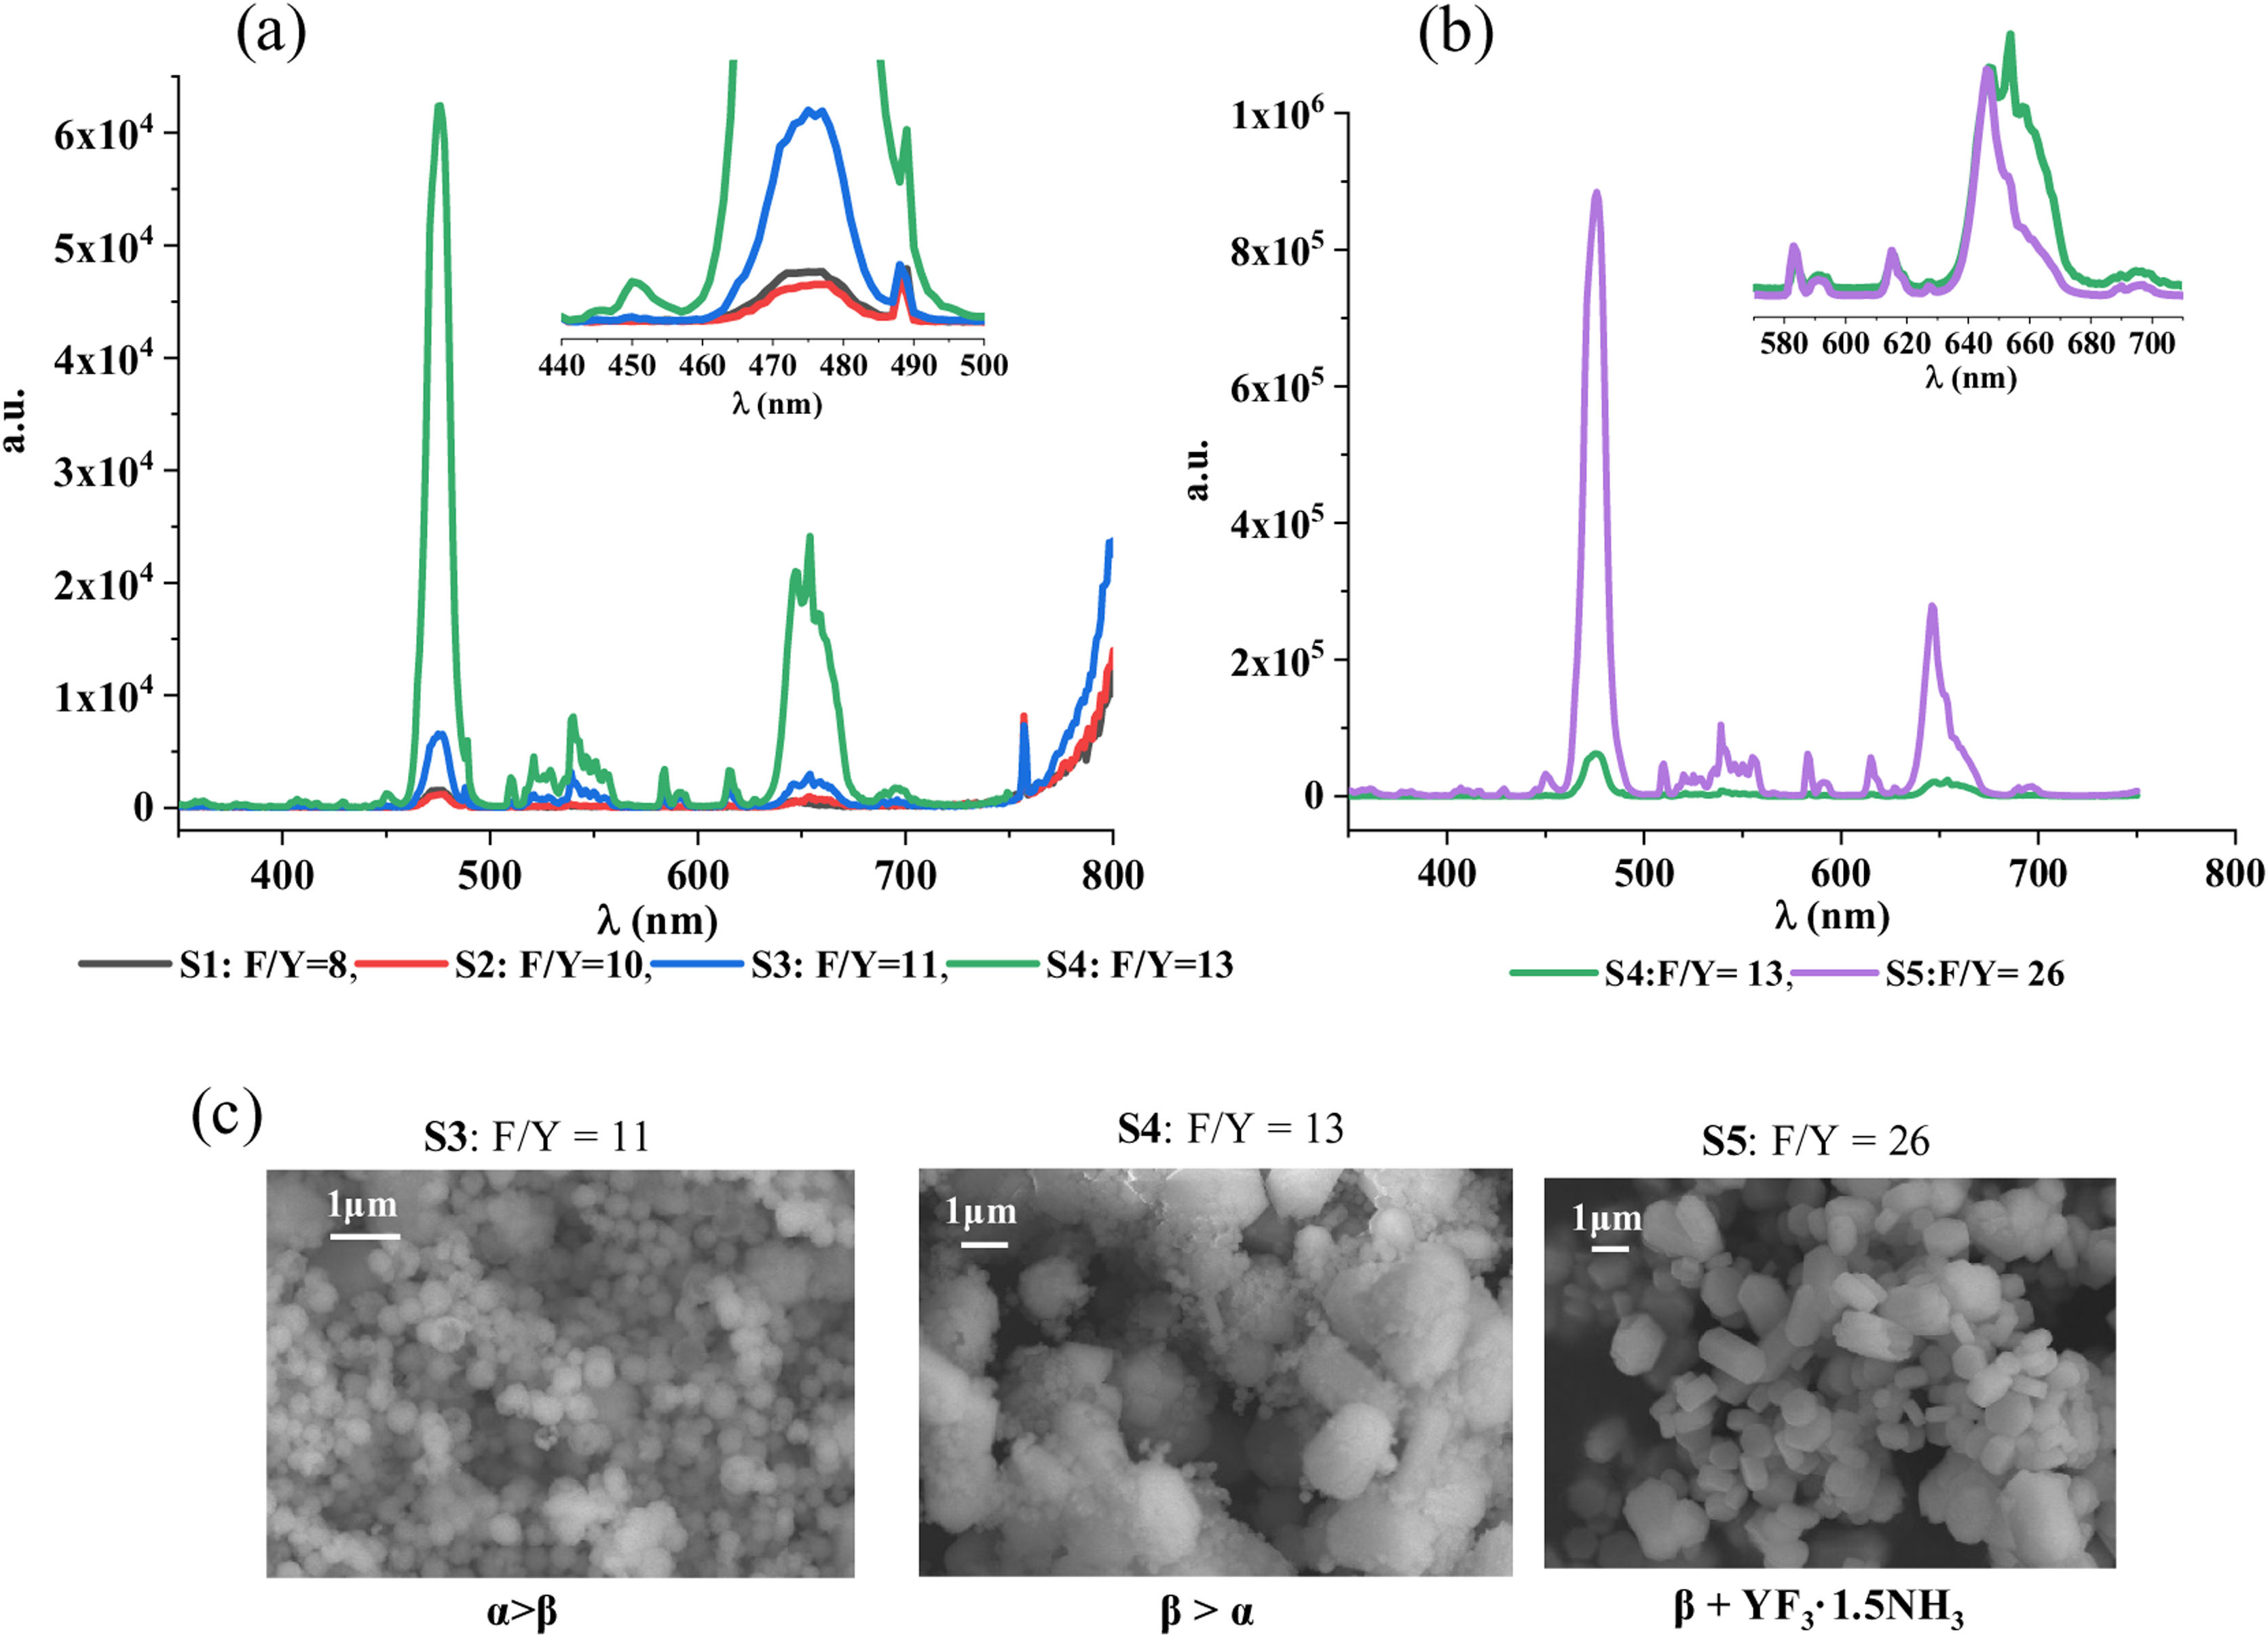
Optical properties of NaYF4: Yb/EuThe next step of this research is to evaluate if the produced materials exhibit IR→visible UC performance and, if so, the impact of phase, size and shape on UC emission. Fig. 3 shows the UC emission spectra obtained at 980nm excitation wavelength for the NaYF4 Yb/Eu powders synthesized with different F/Y ratios at 150°C for 4h. The emission bandwidth of the monochromator in the detector was kept constant at 0.5nm. For a better layout of these results, sample S5 (F/Y=26) had to be plotted separately using a different scale due to the high emission intensity performed by this powder.
 S1–S4 and (b) S4 and S5 samples. Notice that the scale in (b) is more than an order of magnitude higher. (c) SEM micrographs corresponding to S3 (F/Y=11), S4 (F/Y=13) and S5 (F/Y=26).")
Based on the results gathered in Fig. 3, it could be firstly stated that UC process takes place in all the phosphors covered in this investigation, though the intensity of UC emission is very low in those samples synthesized with the lowest fluoride content (see Fig. 3, S1 and S2. Black and red spectra, respectively). Both, the low degree of reaction and the low rate of α→β conversion, are probably behind the poor luminescence shown in these two samples [14–16]. Nevertheless, irrespective of the efficiency of the process, all the obtained UC emission spectra display three differentiated regions in the visible range: a single and predominant narrow signal centered at 475.5nm (blue region), a manifold emission peaks with lower intensity centered between [500 and 550]nm (green region) and another featured an overlapped group of bands located in the red region (around 550–700nm).
The blue emission peak centered at 475nm has been previously ascribed to Eu2+ 4f65d1 transition [11] and confirms that the experimental procedure set for blue light emitting NaYF4: Yb/Eu phosphors is suitable. Europium was firstly incorporated as Eu3+ which shows several emission peaks in the red region of visible light [11,12,18,32]. The predominance of the spectral signal located at 475nm (blue light) demonstrates that the experimental conditions set in this investigation favor Eu3+→Eu2+ reduction and the consequent obtention of blue light emitting UC NaYF4 phosphors.
The green emission (510–560nm), though minor, is detected in all the samples but cannot be assigned to Eu transitions. T.K. Pathak et al. [11] reported the same green emission in NaYF4: Yb/Eu produced by the combustion method. They found out that a common impurity of Yb source is Er and even though its content was very low (around 1500ppm), they could clearly differentiate their emission bands. Besides, they checked that this emission increased when increasing Yb content. In our particular case, the relative intensity between the green emission and blue emission remains constant which is coherent with constant experimental conditions and a constant amount of Yb in all the synthesis.
The spectral bands located in the red region could be initially ascribed to Eu3+ emissions [32], what indicates that the reduction of the starting Eu3+, though successful, was not complete. Since the relative blue/red intensity remains practically constant in all the phosphors analyzed, the reached Eu3+→Eu2+ equilibrium does not seem to be influenced by fluoride content. More specifically, the overlapped spectral band centered at ∼591nm is attributed to 5D0→7F1 magnetic dipole transition and the peak located at ∼615nm to the 5D0→7F2 hypersensitive transition, whose intensity is strongly dependent on the local environment of Eu3+[32]. At ∼650nm, both 5D0→7F3 Eu3+ transition and 4F9/2→4I15/2 Er3+ occur, hence, the broad and overlapped emission band registered in that spectral region (see Fig. 3b) probably gathers the contribution of both transitions. It should be noticed that the hypersensitive to local environment Eu3+ transition 5D0→7F2 (∼615nm) remains basically unaltered when increasing F/Y ratio from 13 to 26 despite of the mineralogical changes observed between both samples (S4, S5), see inlet in Fig. 3(b). This observation supports the high structural matching between β-NaYF4 and YF3·1.5 NH3 phases and agrees with our findings and the results recently reported at this respect [31].
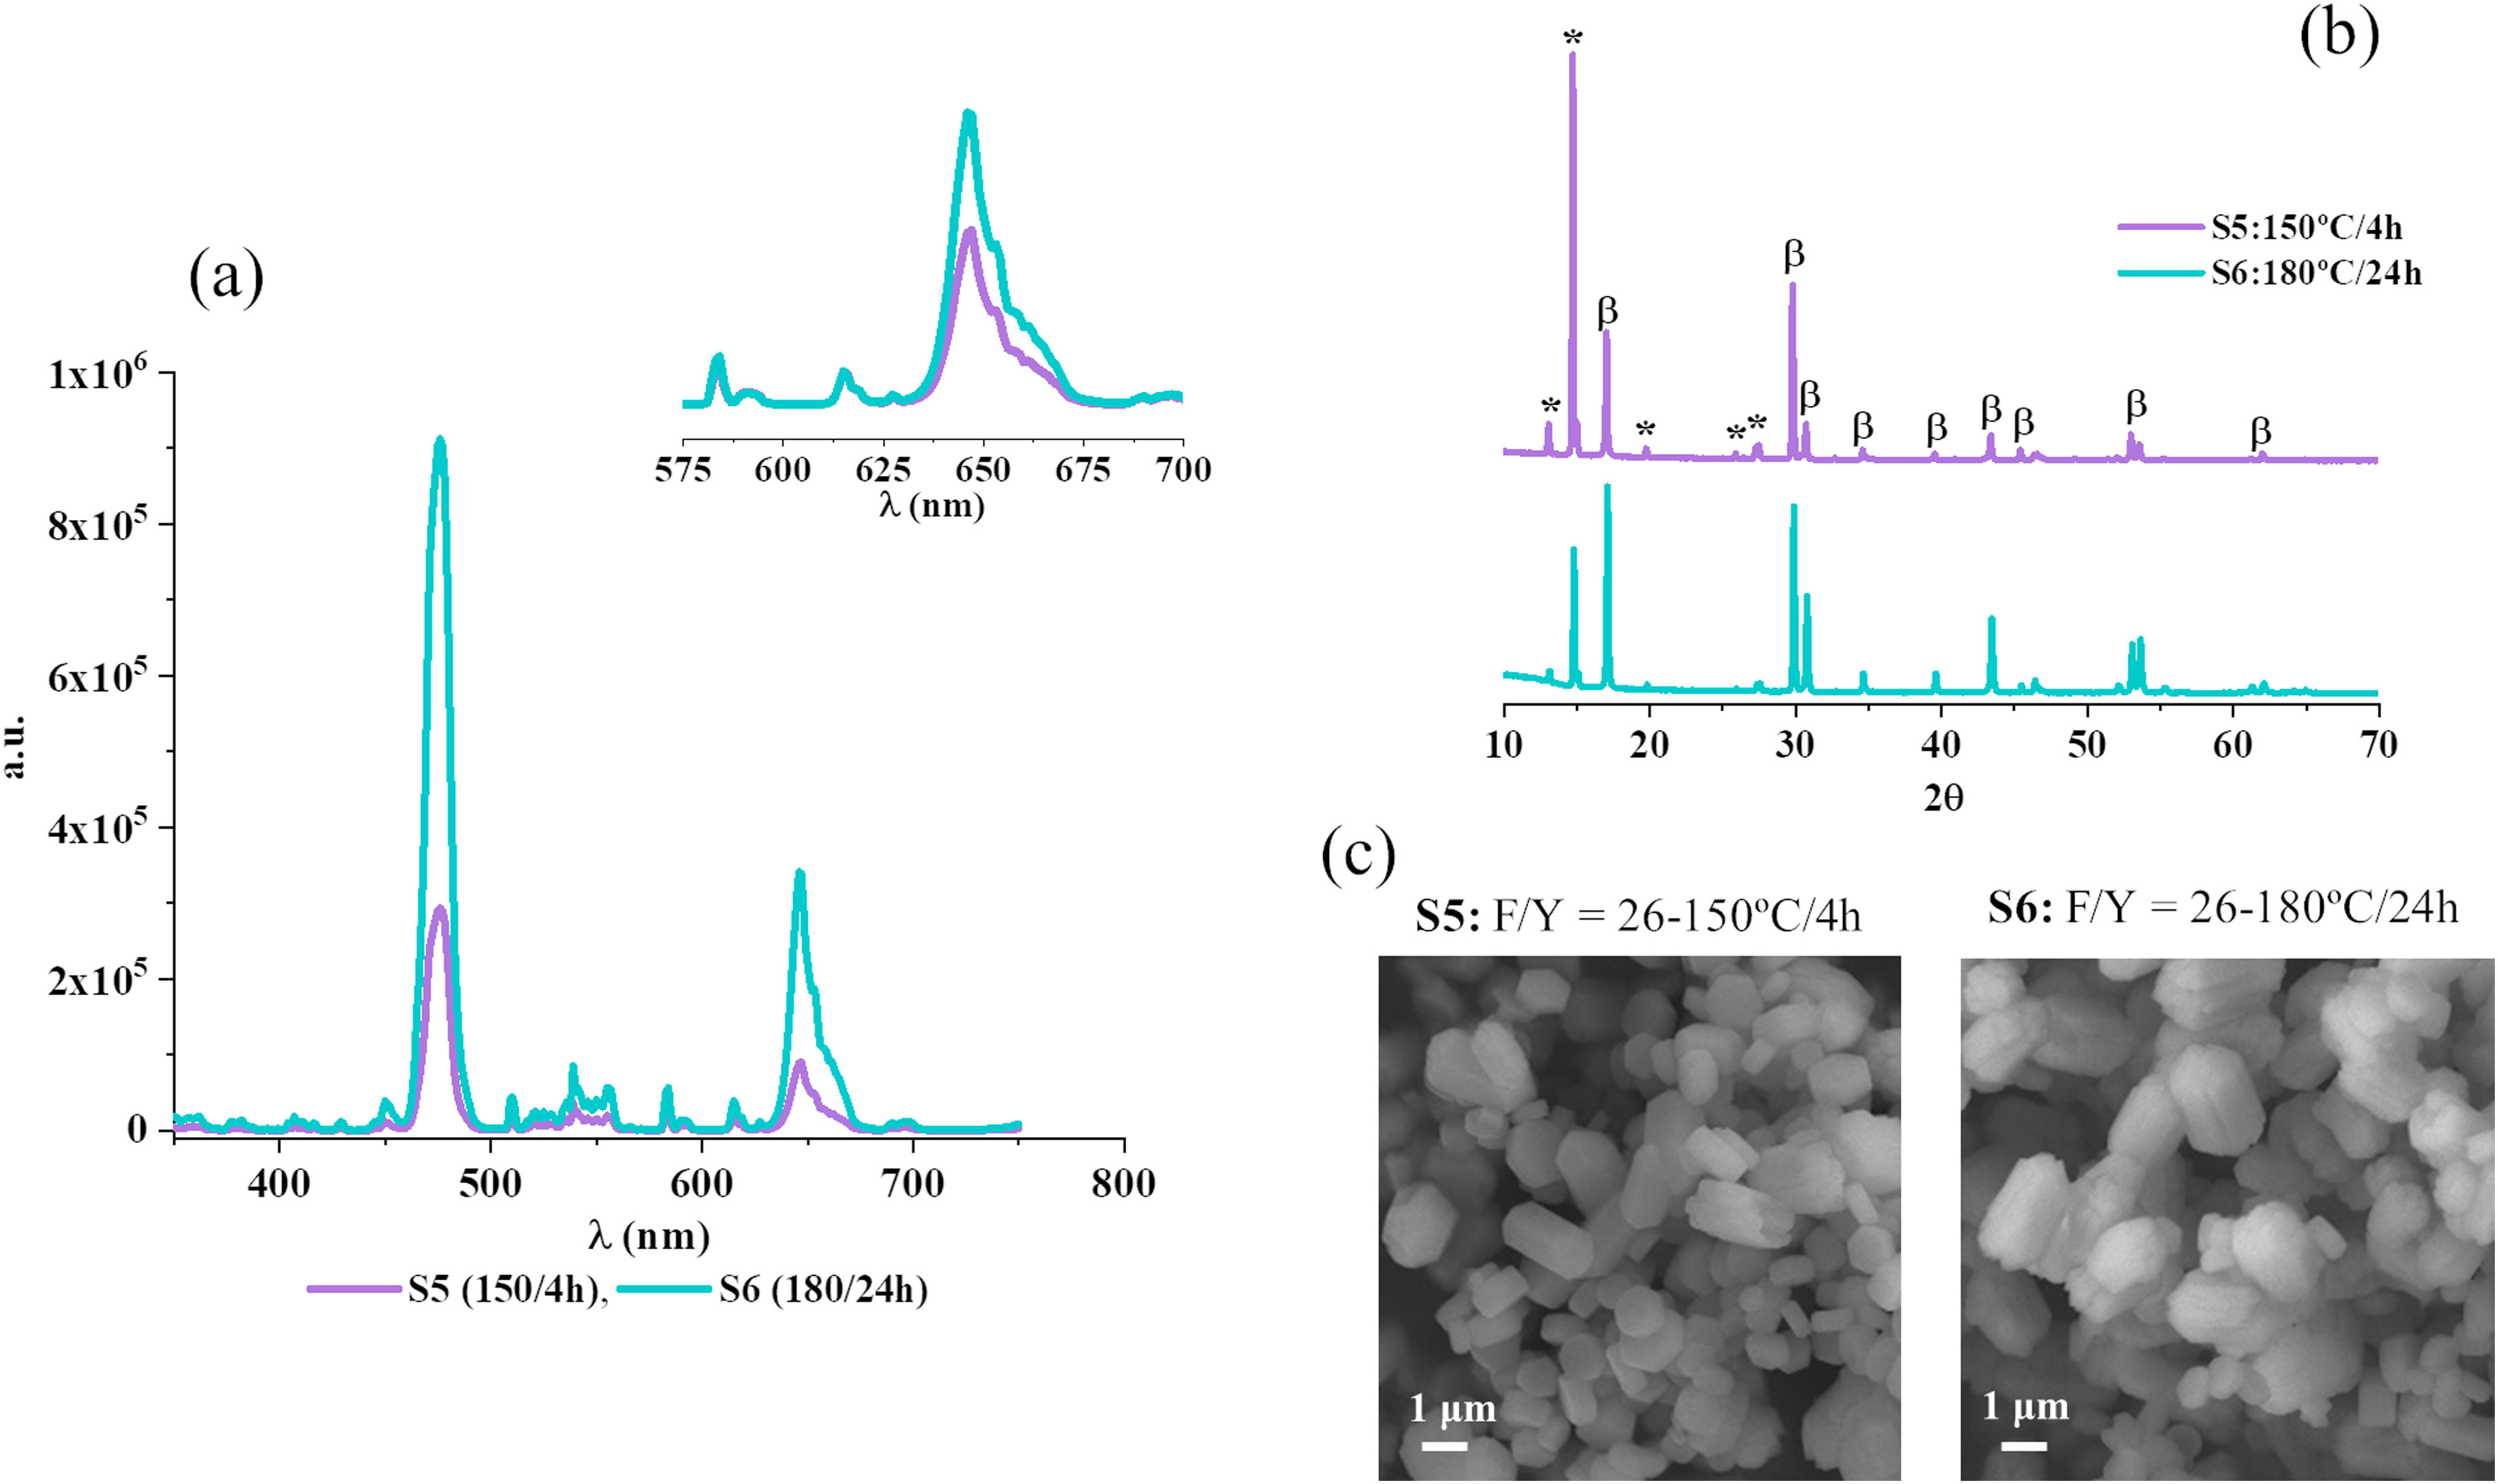
If now the efficiency of the UC process is considered, the obtained results demonstrate that UC-emission clearly improves as the F/Y ratio increases. It can be stated, at a glance, that the phosphor synthesized with the highest F/Y ratio (S5) exhibits an outstanding performance (see Fig. 3b). Note that the achieved intensity is more than an order of magnitude higher than that reached with S4 powder and more than two orders of magnitude higher than the emission intensity reached by the phosphors synthesized with a F/Y ratio lower than 13 (S1–S3). A combined view of the emission spectra and representative FESEM images of the produced luminescent materials (see Fig. 3c) indicates that the efficiency of UC process significantly improves when the crystallization of β-NaYF4 is promoted. Nevertheless, the outstanding performance of S5 (F/Y=26) cannot be straightforward attributed to β-NaYF4 phase since YF3·1.5 NH3 co-crystallizes with the former. In order to gain more insight into the role played by both β-NaYF4 and YF3-1.5 NH3 phases, a new phosphor composition was synthesized: sample S6. Starting from sample S5 with the best optical performance, this new sample was also prepared with a F/Y ratio equal to 26, but this time both, the temperature and the reaction time in the reactor were modified, conducting a synthesis at 180°C for 24h (see Table 2, sample S6). The results of this new test are collected in Fig. 4, where a comparison with the S5 sample synthesized under milder conditions (150°C/4h) is also presented.
 Emission spectra (inlet normalized to Eu3+ 615nm), (b) powder diffractograms and (c) FESEM micrographs corresponding to the samples synthesized with a F/Y ratio=26 at 150°C/4h (S5-purple line) and at 180°C/24h (blue line-S6). Key: β: hexagonal Na1.5Y1.5F6 (ICDD 016-0334), (: YF3 1.5NH3 (ICDD 028-1449).")
(a) Emission spectra (inlet normalized to Eu3+ 615nm), (b) powder diffractograms and (c) FESEM micrographs corresponding to the samples synthesized with a F/Y ratio=26 at 150°C/4h (S5-purple line) and at 180°C/24h (blue line-S6). Key: β: hexagonal Na1.5Y1.5F6 (ICDD 016-0334), (: YF3 1.5NH3 (ICDD 028-1449).
First of all, it has to be highlighted that the intensity of the light emitted by S6 sample was so intense that the window in detector had to be closed down to 0.3nm (instead of the bandwidth equal to 0.5nm set for the previous experiments) in order to avoid saturation. S5 emission spectra were then registered with this emission bandwidth in order to have comparable results. Notice that the intensity of the emitted light by S5 decreases accordingly (see Fig. 3b). The UC spectra plotted in Fig. 4a demonstrate that increasing the reaction time and temperature gives rise to a significantly enhanced intensity of emitted light, i.e., the as prepared phosphor transforms IR radiation into visible light radiation more efficiently. But undoubtedly the most interesting results emanate from the structural and microstructural characterization of sample S6. On one hand, the XRD analysis reveals that in this powder treated at higher temperature and longer time there is still a coexistence of the two crystalline phases observed in sample S5, β-NaYF4 and YF3·1.5NH3, although the relative intensity between them has perceptibly changed: β-NaYF4 is again the major phase, leaving the YF3·1.5NH3 phase as a secondary, minor phase (Fig. 4b). These differences in the XRD diffractograms, however contrast with the SEM characterization images, which a priori indicate that no change in particle size and morphology occurs with increasing synthesis temperature/time, Fig. 4c.
The supposed contradiction between both techniques can actually be explained by the aforementioned fact that both β-NaYF4 and YF3·1.5NH3 phases display a high degree of structural matching, which makes the equilibrium between them easily shifted toward one or the other phase with any change in the synthesis conditions. Moreover, theses similarities also made impossible to distinguish the particles of each phase by FESEM/EDX, less even their relative proportion, so in fact, there is no such contradictory information. In any case, the results obtained confirm that the mixture of the β-phase and the YF3 ammonia complex that is obtained when working with a ratio F/Y=26 can also be used as a feasible host and with a high degree of up conversion efficiency, particularly in the blue region of the spectrum. The improvement observed in the luminescence of sample S6 with respect to S5 (both with F/Y=26) is mainly attributed to the fact that increasing the temperature and the synthesis time leads to an increase of crystallinity and a reduction in surface defects, which is always propitious for increased luminescence intensity. But it cannot be excluded that the presence of both phases in a constructive ratio also contributes to that improvement. In this view, further experiments are underway to study to what extent we are able to control the optical performance by modifying the percentage of both host phases.
ConclusionsThe results obtained in this research work demonstrate that the mineralogy of co-doped NaYF4 phosphors produced following a template-free hydrothermal procedure can be accurately controlled just by varying F/Y ratio. The proposed reductive synthesis has proved to be a convenient and facile method to tune red Eu3+ UC emission toward Eu2+ blue region, what may extend the use of Eu/Yb pair to photocatalytic applications. A combined study of the driving forces in the NaYF4 synthesis and the way the optical properties evolve with the fluoride content reveals that the efficiency of IR→blue light conversion significantly improves when the crystallization of β-phase is promoted. However, it is also observed that reaching full α→β conversion by just increasing the F/Y ratio entails the co-crystallization of an ammoniacal complex, YF3 1.5NH3, which also acts as an excellent host for the up-conversion process: the samples where both β-NaYF4 and YF3 1.5NH3 phases coexist exhibit outstanding optical properties, particularly in the blue region of the visible spectrum. The reproducible and facile route proposed in this work may help to ease the way to the real application of improved photocatalytic composites and, consequently, to a better use of solar energy.
FundingThis work was funded by MCIN/AEI /10.13039/501100011033 under project PID2019-104118RB-C21. It was also supported by CSIC under the project 202260I118. Dr T. Jardiel acknowledges the European Science Foundation (ESF) and the Ramon y Cajal Program of Spanish Ministry of Science, Innovation and Universities (MICIU) for the financial support.
Conflict of interestNone.

