The use of the N category of the TNM staging system, lymph node ratio (LNR) and log odds of positive lymph nodes (LODDS) in predicting overall survival (OS) and disease-free survival (DFS) in patients with rectal cancer is still controversial.
Material and methodsA retrospective study of 445 patients with rectal cancer who underwent surgery between 2008 and 2017 in the University Complex Hospital of Vigo was performed. Patients were stratified according to number of lymph nodes examined (NLNE), N staging, LNR and LODDS. The analysis was performed using the log-rank test, Kaplan–Meier functions, Cox regression and ROC curves.
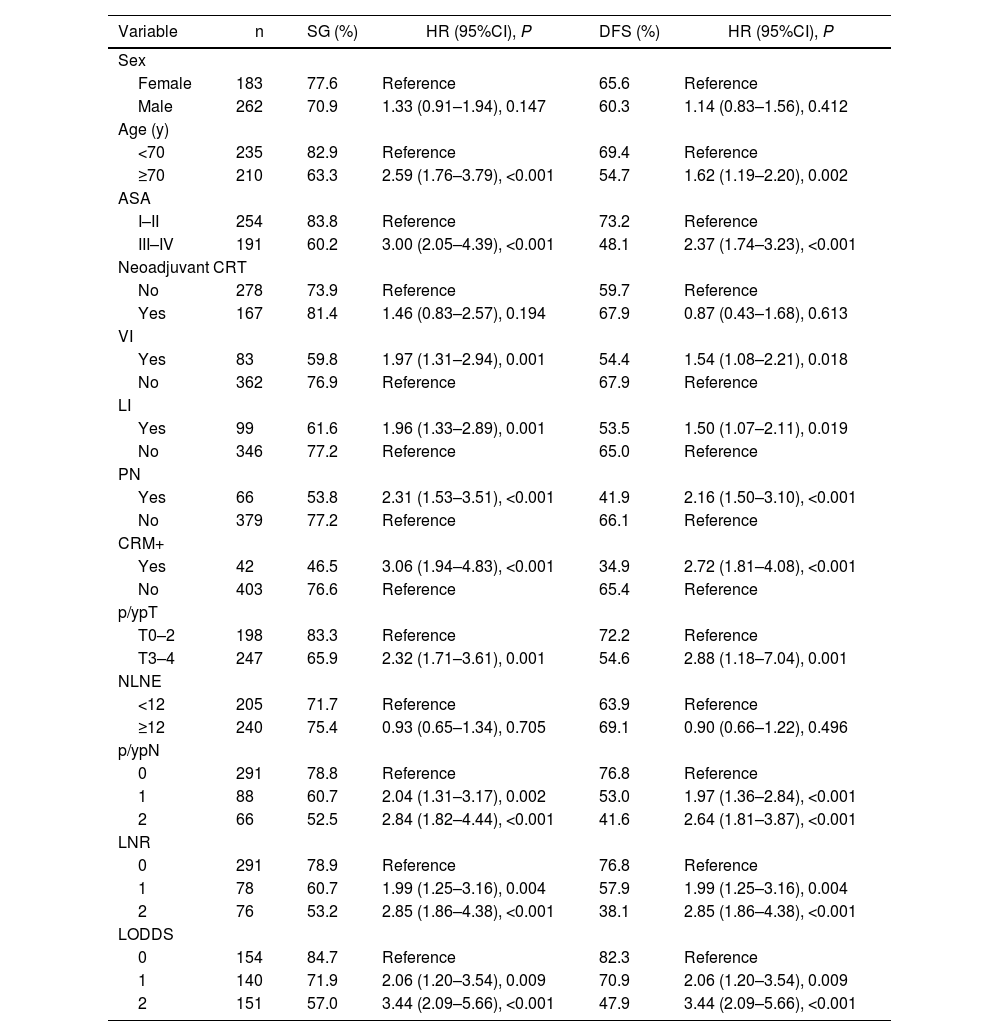
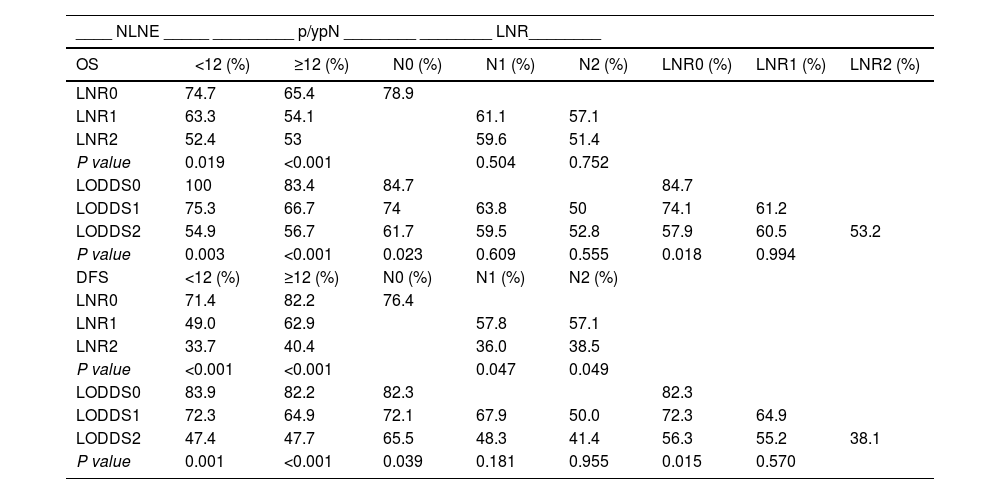
ResultsFive-year OS and DFS were 73.7% and 62.5%, respectively. No statistically significant differences were observed depending on NLNE. Increased LNR and LODDS were associated with shorter OS and DFS, independently of NLNE.
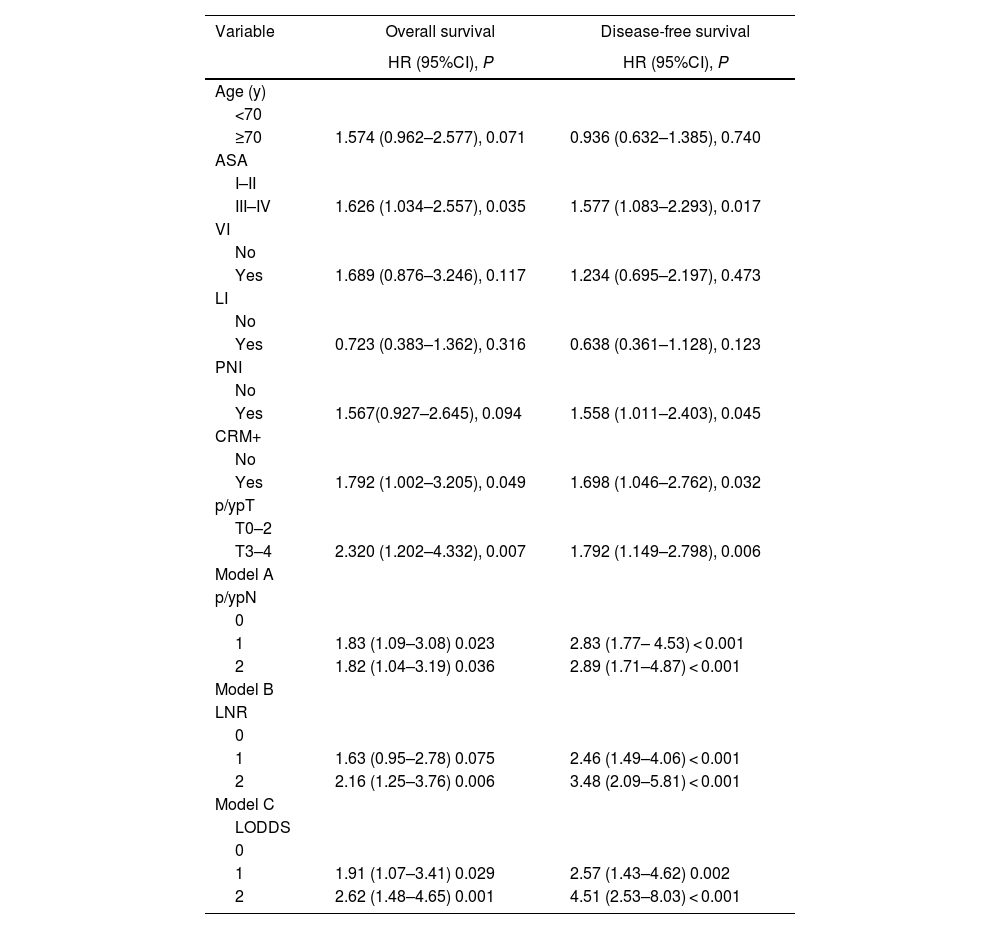
Multivariate analysis showed that N stage, LNR and LODDS were independently associated with OS and DFS; however, the LODDS system obtained the best area under the curve, with greater predictive capacity for OS (AUC: 0.679) and DFS (AUC: 0.711).
ConclusionLODDS and LNR give prognostic information that is not related to NLNE. LODDS provides better prognostic accuracy in patients with negative nodes than LNR and N stage.
La utilidad de la estadificación N del sistema TNM, el cociente de ganglios linfáticos (CGL) y el logaritmo de probabilidades de ganglios linfáticos positivos (LODDS) para predecir la supervivencia global (SG) y la supervivencia libre de enfermedad (SLE) en pacientes con cáncer de recto es aún controvertida.
Material métodosSe realizó un estudio de cohortes retrospectivo con pacientes intervenidos por cáncer de recto entre 2008 y 2017 en el Complejo Hospitalario Universitario de Vigo. Los pacientes se estratificaron en subgrupos de acuerdo al número de ganglios examinados (NGE), estadificación N del sistema TNM, punto de corte CGL y punto de corte LODDS. Se realizó un análisis mediante Log-Rank test, curvas de Kaplan-Meier, regresión de Cox y curvas ROC.
ResultadosSe incluyeron 445 pacientes. La SG y la SLE, a 5 años, fue de 73.7% y 62.5%, respectivamente. No se encontraron diferencias estadísticamente significativas en la supervivencia según el NGE. A medida que se incrementa el valor de CGL y LODDS disminuye significativamente la SG y la SLE, independientemente del NGE.
En el análisis multivariante la estadificación N, el CGL y el LODDS se mostraron como factores independientes de la SG y SLE; pero el sistema LODDS obtuvo la mejor área bajo la curva, con mayor capacidad predictiva para la SG (ABC: 0.679) y SLE (ABC: 0.711).
ConclusiónLODDS y CGL proporcionan información pronóstica independientemente del NGE. LODDS proporciona un rendimiento predictivo más preciso en los pacientes con ganglios negativos que el CGL y la estadificación N.


