


Cardiovascular risk (CVR) is conventionally calculated by measuring the total cholesterol content of high-density lipoproteins (HDL) and low-density lipoproteins (LDL). The purpose of this systematic review was to assess the CVR associated with LDL and HDL particle size and number as determined by nuclear magnetic resonance (NMR) spectroscopy.
Material and methodsA literature search was performed using the electronic databases MEDLINE and Scopus. All cohort and case–control studies published before January 1, 2019 that met the following inclusion criteria were included: HDL-P, LDL-P, HDL-Z and/or LDL-Z measured by NMR spectroscopy; cardiovascular event as an outcome variable; risk of cardiovascular events expressed as odds ratios or hazard ratios; only adult patients. A meta-analysis was performed for each exposure variable (4 for LDL and 5 for HDL) and for each exposure measure (highest versus lowest quartile and 1-standard deviation increment).
ResultsThis review included 24 studies. Number of LDL particles was directly associated with CVR: risk increased by 28% with each standard deviation increment. LDL particle size was inversely and significantly associated with CVR: each standard deviation increment corresponded to an 8% risk reduction. CVR increased by 12% with each standard deviation increase in number of small LDL particles. HD, particle number and size were inversely associated with CVR.
ConclusionLarger particle size provided greater protection, although this relationship was inconsistent between studies. Larger number of LDL particles and smaller LDL particle size are associated with increased CVR. Risk decreases with increasing number and size of HDL particles.
El riesgo cardiovascular (RCV) se calcula convencionalmente midiendo el contenido de colesterol total de las lipoproteínas de alta densidad (HDL) y las lipoproteínas de baja densidad (LDL). El propósito de esta revisión sistemática fue evaluar el RCV asociado con el tamaño y el número de partículas de LDL y HDL, según lo determinado por espectroscopia de resonancia magnética nuclear (RMN).
Material y métodosSe realizó una búsqueda bibliográfica utilizando las bases de datos electrónicas Medline y Scopus. Se incluyeron todos los estudios de cohortes y de casos y controles publicados antes del 1 de enero de 2019, que cumplieron con los siguientes criterios de inclusión: HDL-P, LDL-P, HDL-Z y/o LDL-Z medidos por espectroscopia de RMN; evento cardiovascular como variable de resultado; riesgo de eventos cardiovasculares expresado como cociente de posibilidades o cociente de riesgos instantáneos; solo pacientes adultos. Se realizó un metaanálisis para cada variable de exposición (cuatro para LDL y cinco para HDL) y para cada medida de exposición (cuartil más alto vs. más bajo e incremento de 1 desviación estándar [DE]).
ResultadosEsta revisión incluyó 24 estudios. El número de partículas LDL se asoció directamente con el RCV: el riesgo aumentó 28% con cada incremento de la DE. El tamaño de las partículas de LDL se asoció inversa y significativamente con el RCV: cada incremento de la DE correspondió a una reducción del riesgo de 8%. El RCV aumentó 12% con cada aumento de la DE en el número de partículas pequeñas de LDL. HDL, número y tamaño de partículas se asociaron inversamente con CVR.
ConclusiónEl tamaño de partícula más grande proporcionó una mayor protección, aunque esta relación fue inconsistente entre los estudios. Un mayor número de partículas de LDL y un tamaño de partícula de LDL más pequeño se asocian con un aumento de la RCV. El riesgo disminuye con el aumento del número y tamaño de las partículas de HDL.
Cardiovascular disease is the leading cause of death worldwide.1 Key prevention strategies focus on controlling blood pressure, diabetes and lipid levels. A standard lipid profile includes triglycerides, total cholesterol and amount of cholesterol transported in low-density lipoproteins (LDL-C) and high-density lipoproteins (HDL-C). LDL-C is thought to be the most important of these indicators,2 but thousands of people suffer cardiovascular events despite having normal LDL-C values. Persisting elevated cardiovascular risk in patients who have lowered their LDL-C to normal levels through treatment is called residual risk.3
Cardiovascular patients have elevated numbers of small, dense LDL particles,4,5 and the concentration of this particle subclass is more closely correlated to cardiovascular disease than is total LDL-C. However, while multiple published studies unequivocally demonstrate an increased cardiovascular risk in patients with high LDL-C or low HDL-C, the evidence on lipoprotein subclasses and their composition is less solid. The biological role of HDL in cardiovascular disease is also unclear: while epidemiological studies show an inverse relationship between HDL-C and cardiovascular disease, other studies examining pharmacological interventions and genetic mechanisms that increase HDL-C have disputed this relationship.6–8
Compared with standard LDL-C and HDL-C determination, techniques that measure the size and number of lipoprotein particles and their subclasses are less accessible for clinical practice, but could enable a more precise assessment of cardiovascular risk. Of these techniques, proton nuclear magnetic resonance (NMR) spectroscopy would appear to work better than gel electrophoresis, analytical centrifugation and ion mobility analysis.9
The aim of this systematic review and meta-analysis is to analyse the risk of cardiovascular events associated with NMR-determined lipoprotein number and size.
Material and methodsFollowing the PRISMA (Preferred Reporting Items for Systematic Reviews and Meta-Analyses) method,10 we performed a systematic review of studies that assess the effect on cardiovascular risk in adults of number of HDL particles (HDL-P), number of LDL particles (LDL-P), HDL particle size (HDL-Z) and/or LDL particle size (LDL-Z) in plasma or serum, as determined by NMR spectroscopy.
Sources of information and search strategyWe conducted a literature search in January 2019 in the electronic databases MEDLINE and Scopus, including the following MeSH (Medical Subject Headings) descriptors (in MEDLINE) and keywords (in Scopus): lipoproteins; high-density lipoproteins, pre-beta; lipoproteins, HDL3; lipoproteins, HDL2; lipoproteins, IDL; lipoproteins, VLDL; lipoproteins, LDL; lipoproteins, HDL; magnetic resonance spectroscopy; cardiovascular diseases; humans. The search strategies are outlined in Supporting material 1. We exported the references of the identified articles to an Excel spreadsheet using RefWorks, and eliminated all duplicates.
Inclusion criteria and study selectionWe included all cohort and case-control studies published and indexed in the databases before January 1, 2019 that met the following inclusion criteria: HDL-P, LDL-P, HDL-Z and/or LDL-Z measured by NMR spectroscopy; cardiovascular event (coronary heart disease, significant coronary artery occlusion, myocardial infarction, cardiovascular disease, stroke and/or death by cardiovascular cause) included as an outcome variable; risk of cardiovascular events expressed as odds ratios (OR) or hazard ratios (HR), together with 95% confidence intervals (95% CI); only adult patients (aged ≥18 years). We excluded studies that were not published in a Roman alphabet language.
Two reviewers independently screened the title and abstract of the identified articles, then reviewed the full texts if necessary, to select the studies that met the selection criteria. A third reviewer resolved any discrepancies.
Data extractionTwo reviewers independently screened the full text of the selected studies to extract all data needed for the systematic review and meta-analysis. Any discrepancies were resolved by a third reviewer.
The following variables were collected from each study: name of first author, year of publication, sample size, number of events, mean years of follow-up, type of multivariate model, number of variables adjusted in the multivariate model, type of cardiovascular event, patients’ country of origin, age range, mean age, percentage of men, class of lipoprotein particle, LDL-P, LDL-Z, number of large LDL subclass particles (L-LDL-P), number of small LDL subclass particles (S-LDL-P), HDL-P, HDL-Z, number of large HDL subclass particles (L-HDL-P), number of medium-sized HDL subclass particles (M-HDL-P), number of small HDL subclass particles (S-HDL-P), the measure of each lipoprotein variable (lowest versus highest quartile [Q4 vs. Q1] or one-standard deviation increment [1 SD]), and cardiovascular risk expressed in OR or HR with 95% CI.
We used the Newcastle–Ottawa scale to assess the quality of the included studies.11 This method involves assigning a score of 0–4 for patient selection, 0–2 for comparability of groups, and 0–3 for exposure/outcome measurement. Two researchers carried out this assessment independently; in the event of discrepancy, a third researcher evaluated the study in question.
Statistical analysisWe performed a meta-analysis for each lipoprotein parameter (four for LDL and five for HDL) and for each measure of exposure (Q4 vs. Q1 and 1 SD). We applied a random effects model for each meta-analysis, assessing between-study variance (Tau2), and between-study heterogeneity with Cochran's Q test and Higgins I2 statistic. If Tau2 was null or the Q test showed no significant heterogeneity, we chose a fixed effects model. If there was significant heterogeneity, the random effects model was fitted. If this did not correct the heterogeneity, we performed an analysis with the following moderating variables in their continuous form: number of variables adjusted in the multivariate model, years of follow-up, percentage of men in the studies, and mean age of subjects. If including the significant moderating variables still did not correct heterogeneity, we performed a sensitivity analysis using the leave-one-out method, which consists of re-fitting the model by removing one study at a time, then checking whether heterogeneity has improved and to what extent overall risk is affected.
The meta-analysis shows the type of particle; type of measure (quartiles or 1 SD); number of studies included; type of model fitted; overall effect with its 95% CI; Tau2 value and corresponding standard error; I2 value; Q test value with corresponding degrees of freedom and p value; and any moderating variables with their coefficient, error and adjusted p value. Where moderating variables were included, the overall effect for several values of these variables is presented. A forest plot was also produced for each meta-analysis.
Lastly, we analysed possible publication bias with a funnel plot for LDL-P and HDL-P with both exposure measures. All analyses were performed with the metaphor package for the statistical software R v.3.5.1.
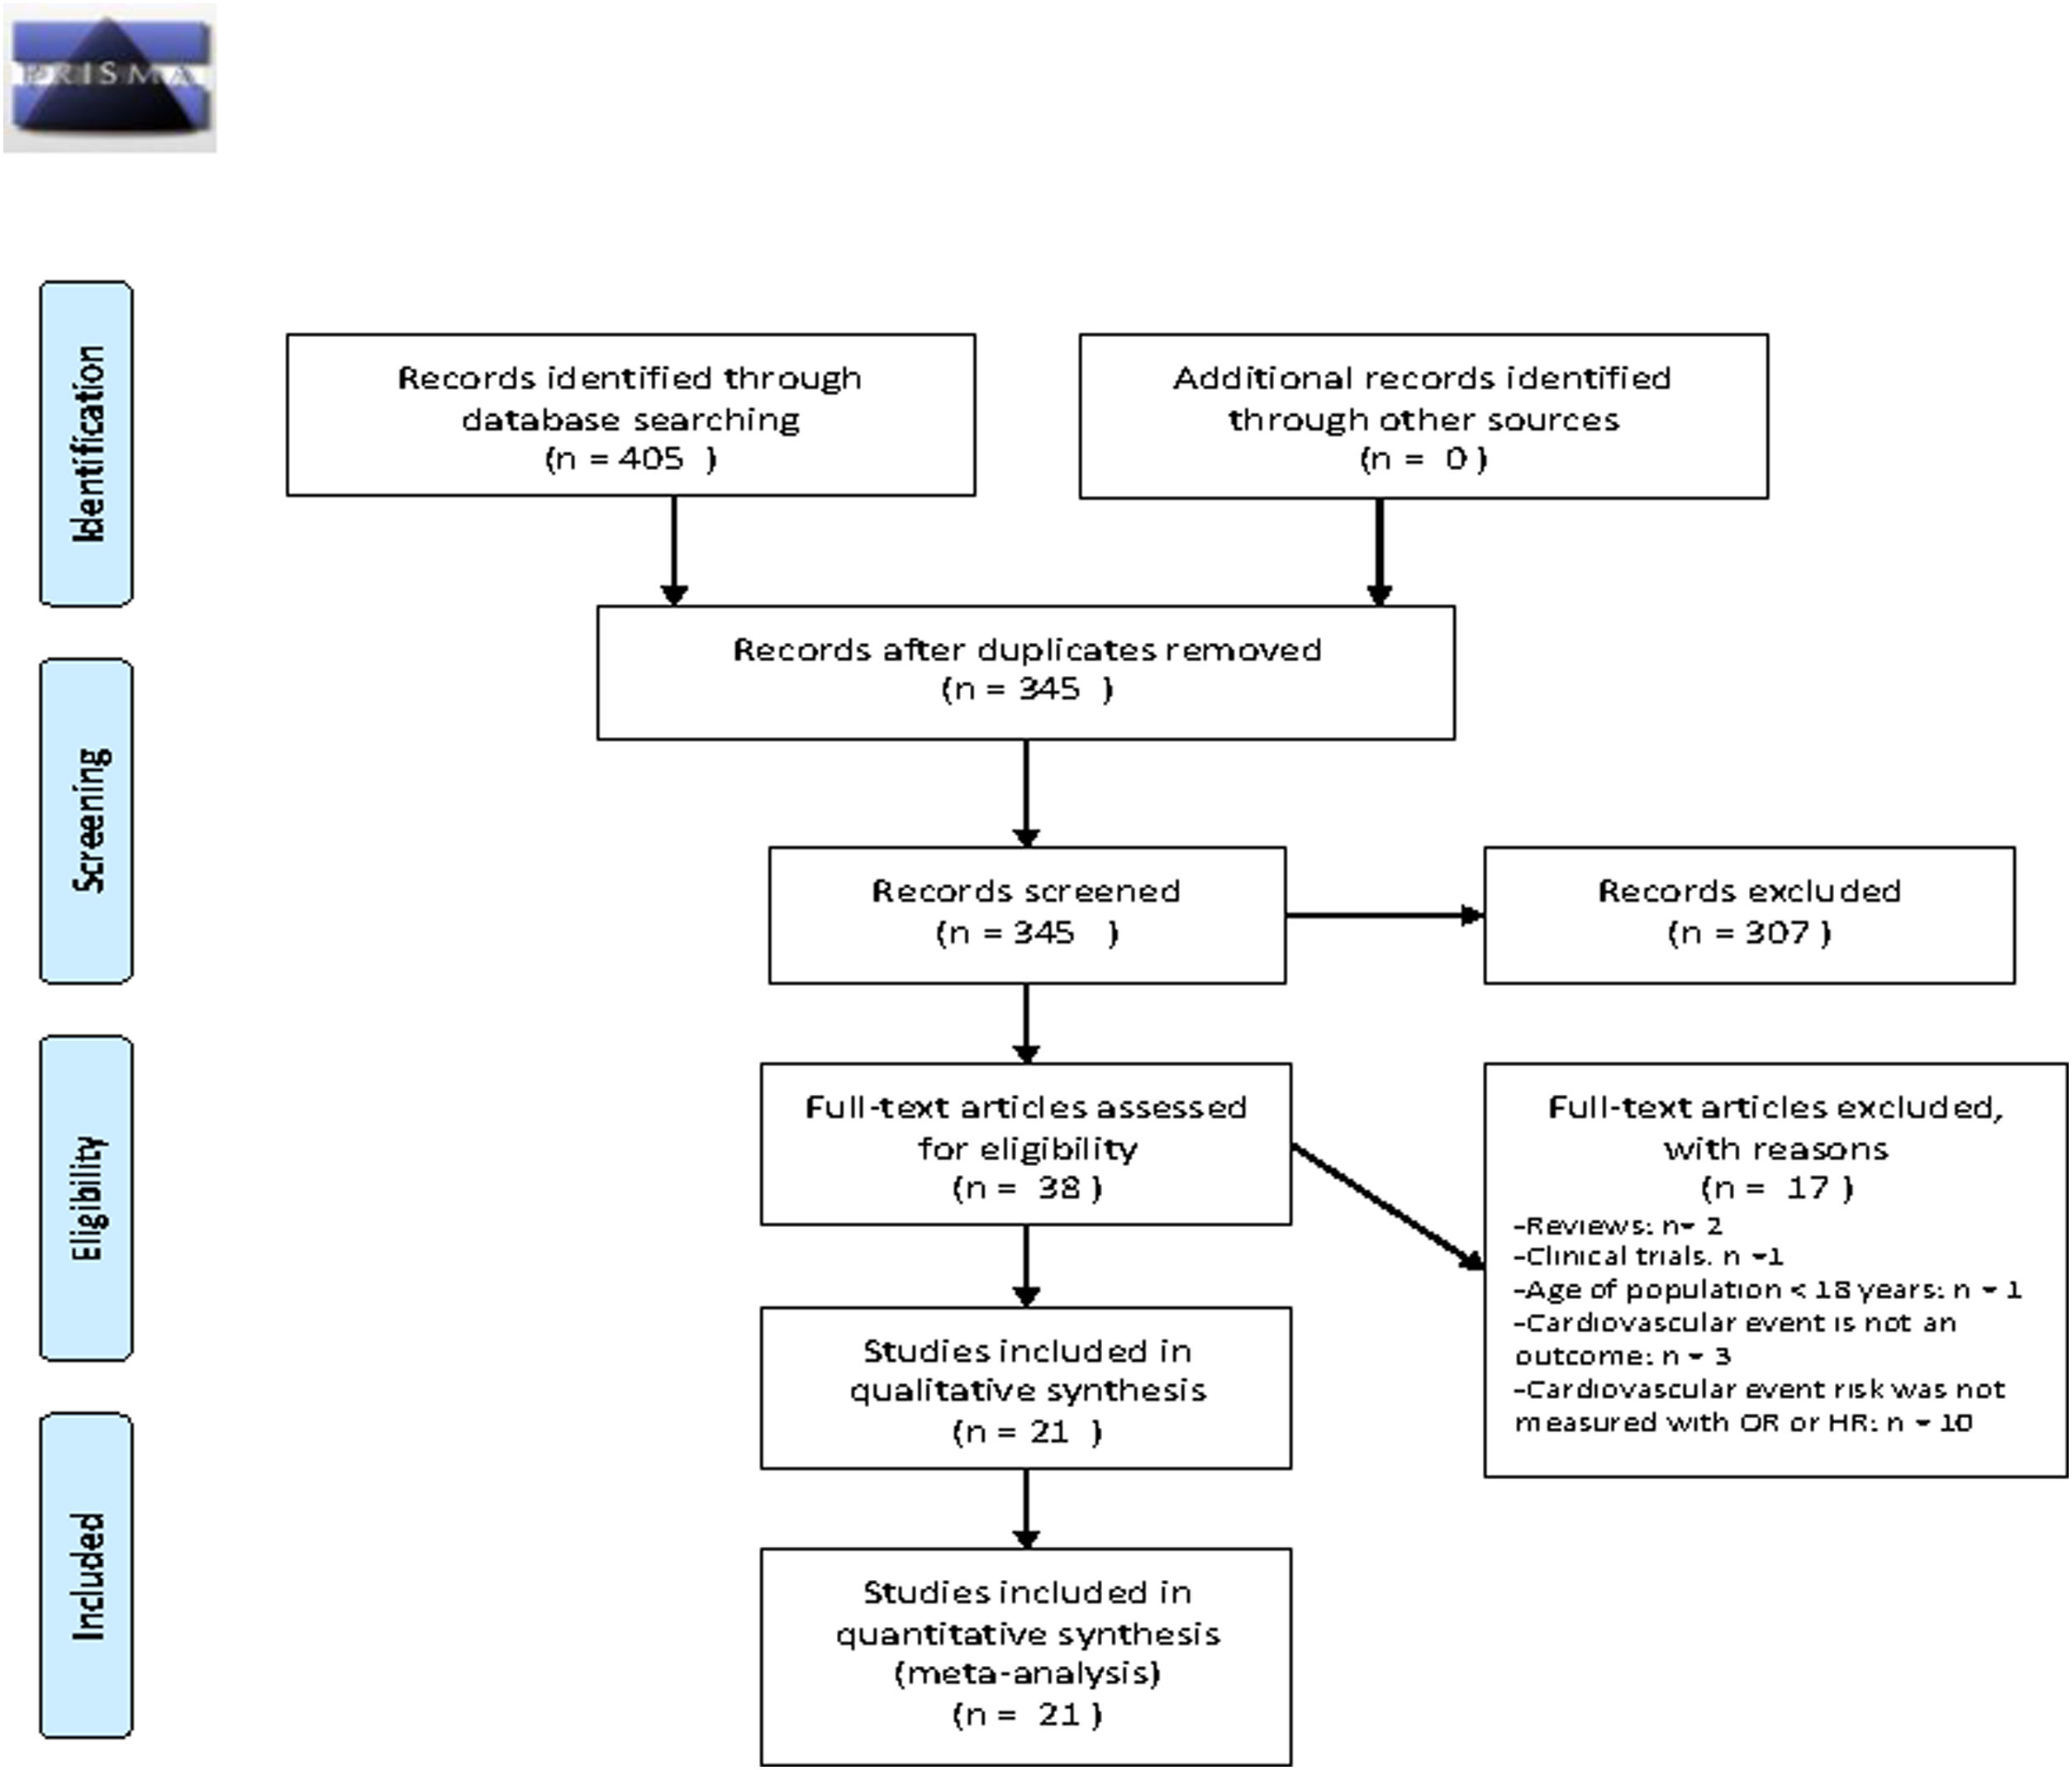
ResultsThe literature search produced 405 articles. We excluded 60 duplicates and revised the remaining 345 for eligibility. A further 307 articles were excluded in the first screen, leaving 38 for a full text review. During this stage of the process, we eliminated one study because it included patients under 18 years of age, three studies for not having a cohort or case–control design, three studies for not including cardiovascular event as an outcome measure, and ten for not expressing risk as OR or HR. After applying the inclusion and exclusion criteria, 21 articles remained for inclusion in the meta-analysis (Fig. 1). In three of these articles,17,21,25 the authors performed two different analyses. We included each as a separate study in our meta-analysis, giving a total of 24 studies.
Meta-analysis
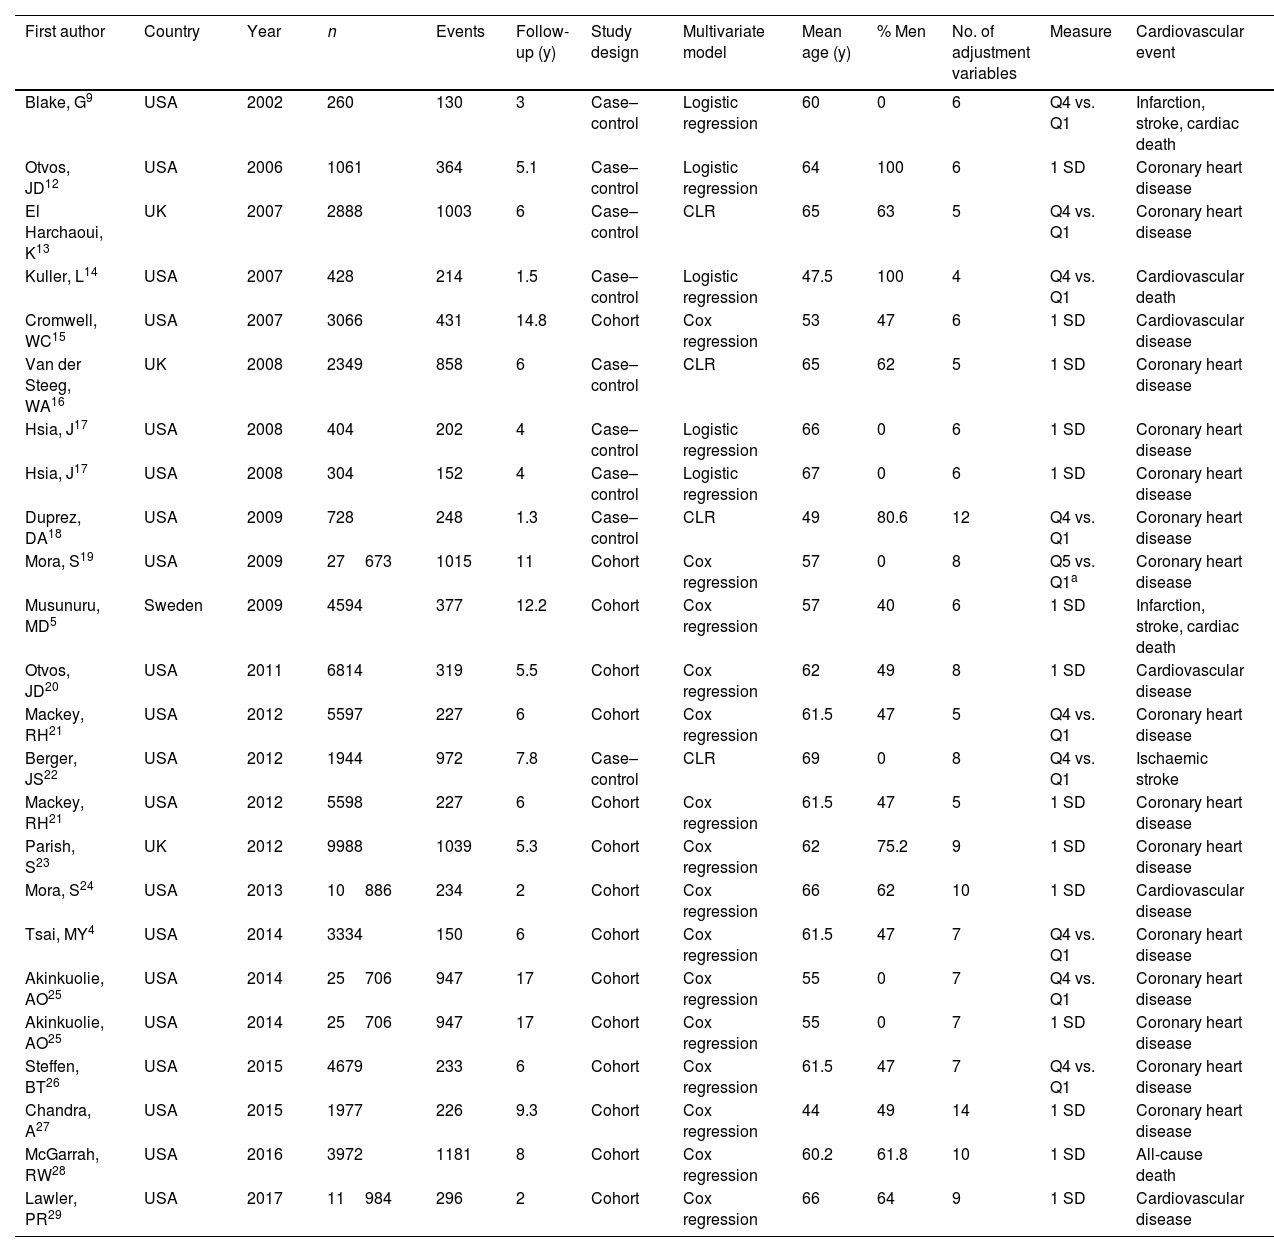
From the included studies we extracted 76 cardiovascular risk estimates for inclusion in the meta-analyses: 27 for LDL and 49 for HDL. Table 1 shows the main characteristics of the included studies. Summing up the samples from all the studies gave a total of 161940 patients, with 11992 cardiovascular events. The median follow-up period was 6 years, with a range of 1.3–17 years. Regarding location, 81.8% (n=20) of the studies were conducted in the USA; 13.6% (n=3) in the UK and one in Sweden. The mean age of the patients ranged from 44 to 69 years. The patients were aged from 44 to 69 years. Nine of the studies had a case-control design and 15 were cohort studies. All were published between 2002 and 2017.
General characteristics of the included studies.
| First author | Country | Year | n | Events | Follow-up (y) | Study design | Multivariate model | Mean age (y) | % Men | No. of adjustment variables | Measure | Cardiovascular event |
|---|---|---|---|---|---|---|---|---|---|---|---|---|
| Blake, G9 | USA | 2002 | 260 | 130 | 3 | Case–control | Logistic regression | 60 | 0 | 6 | Q4 vs. Q1 | Infarction, stroke, cardiac death |
| Otvos, JD12 | USA | 2006 | 1061 | 364 | 5.1 | Case–control | Logistic regression | 64 | 100 | 6 | 1 SD | Coronary heart disease |
| El Harchaoui, K13 | UK | 2007 | 2888 | 1003 | 6 | Case–control | CLR | 65 | 63 | 5 | Q4 vs. Q1 | Coronary heart disease |
| Kuller, L14 | USA | 2007 | 428 | 214 | 1.5 | Case–control | Logistic regression | 47.5 | 100 | 4 | Q4 vs. Q1 | Cardiovascular death |
| Cromwell, WC15 | USA | 2007 | 3066 | 431 | 14.8 | Cohort | Cox regression | 53 | 47 | 6 | 1 SD | Cardiovascular disease |
| Van der Steeg, WA16 | UK | 2008 | 2349 | 858 | 6 | Case–control | CLR | 65 | 62 | 5 | 1 SD | Coronary heart disease |
| Hsia, J17 | USA | 2008 | 404 | 202 | 4 | Case–control | Logistic regression | 66 | 0 | 6 | 1 SD | Coronary heart disease |
| Hsia, J17 | USA | 2008 | 304 | 152 | 4 | Case–control | Logistic regression | 67 | 0 | 6 | 1 SD | Coronary heart disease |
| Duprez, DA18 | USA | 2009 | 728 | 248 | 1.3 | Case–control | CLR | 49 | 80.6 | 12 | Q4 vs. Q1 | Coronary heart disease |
| Mora, S19 | USA | 2009 | 27673 | 1015 | 11 | Cohort | Cox regression | 57 | 0 | 8 | Q5 vs. Q1a | Coronary heart disease |
| Musunuru, MD5 | Sweden | 2009 | 4594 | 377 | 12.2 | Cohort | Cox regression | 57 | 40 | 6 | 1 SD | Infarction, stroke, cardiac death |
| Otvos, JD20 | USA | 2011 | 6814 | 319 | 5.5 | Cohort | Cox regression | 62 | 49 | 8 | 1 SD | Cardiovascular disease |
| Mackey, RH21 | USA | 2012 | 5597 | 227 | 6 | Cohort | Cox regression | 61.5 | 47 | 5 | Q4 vs. Q1 | Coronary heart disease |
| Berger, JS22 | USA | 2012 | 1944 | 972 | 7.8 | Case–control | CLR | 69 | 0 | 8 | Q4 vs. Q1 | Ischaemic stroke |
| Mackey, RH21 | USA | 2012 | 5598 | 227 | 6 | Cohort | Cox regression | 61.5 | 47 | 5 | 1 SD | Coronary heart disease |
| Parish, S23 | UK | 2012 | 9988 | 1039 | 5.3 | Cohort | Cox regression | 62 | 75.2 | 9 | 1 SD | Coronary heart disease |
| Mora, S24 | USA | 2013 | 10886 | 234 | 2 | Cohort | Cox regression | 66 | 62 | 10 | 1 SD | Cardiovascular disease |
| Tsai, MY4 | USA | 2014 | 3334 | 150 | 6 | Cohort | Cox regression | 61.5 | 47 | 7 | Q4 vs. Q1 | Coronary heart disease |
| Akinkuolie, AO25 | USA | 2014 | 25706 | 947 | 17 | Cohort | Cox regression | 55 | 0 | 7 | Q4 vs. Q1 | Coronary heart disease |
| Akinkuolie, AO25 | USA | 2014 | 25706 | 947 | 17 | Cohort | Cox regression | 55 | 0 | 7 | 1 SD | Coronary heart disease |
| Steffen, BT26 | USA | 2015 | 4679 | 233 | 6 | Cohort | Cox regression | 61.5 | 47 | 7 | Q4 vs. Q1 | Coronary heart disease |
| Chandra, A27 | USA | 2015 | 1977 | 226 | 9.3 | Cohort | Cox regression | 44 | 49 | 14 | 1 SD | Coronary heart disease |
| McGarrah, RW28 | USA | 2016 | 3972 | 1181 | 8 | Cohort | Cox regression | 60.2 | 61.8 | 10 | 1 SD | All-cause death |
| Lawler, PR29 | USA | 2017 | 11984 | 296 | 2 | Cohort | Cox regression | 66 | 64 | 9 | 1 SD | Cardiovascular disease |
y: years; USA: United States of America; Q4: highest quartile; Q1: lowest quartile; SD: standard deviation; UK: United Kingdom; CLR: conditional logistic regression.
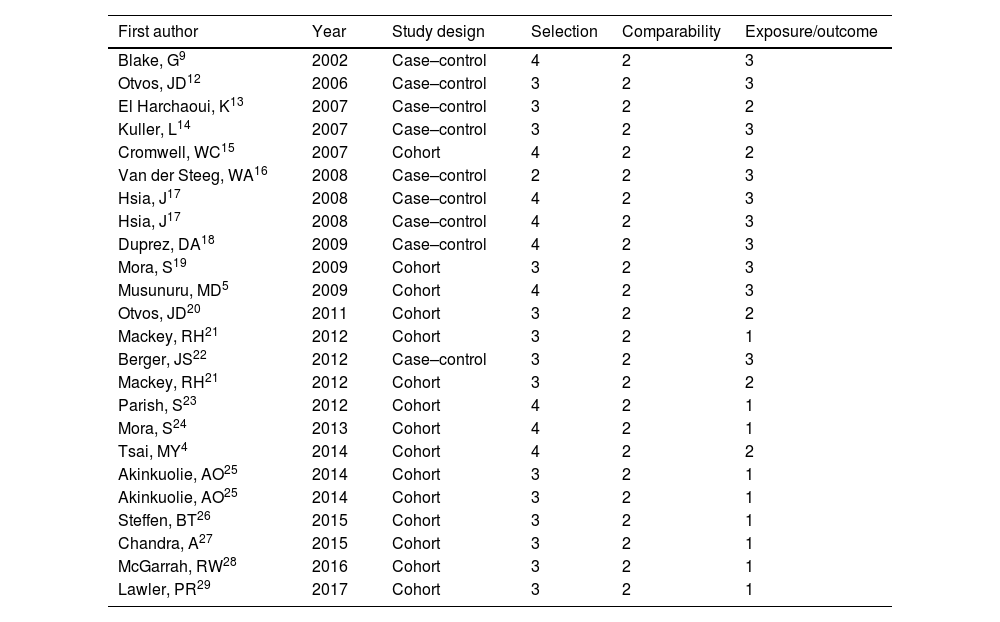
Table 2 shows the results of the quality assessment. There may have been a small selection bias in most of the studies, and recording of events was not of high quality in half.
Quality assessment using the Newcastle–Ottawa scale.
| First author | Year | Study design | Selection | Comparability | Exposure/outcome |
|---|---|---|---|---|---|
| Blake, G9 | 2002 | Case–control | 4 | 2 | 3 |
| Otvos, JD12 | 2006 | Case–control | 3 | 2 | 3 |
| El Harchaoui, K13 | 2007 | Case–control | 3 | 2 | 2 |
| Kuller, L14 | 2007 | Case–control | 3 | 2 | 3 |
| Cromwell, WC15 | 2007 | Cohort | 4 | 2 | 2 |
| Van der Steeg, WA16 | 2008 | Case–control | 2 | 2 | 3 |
| Hsia, J17 | 2008 | Case–control | 4 | 2 | 3 |
| Hsia, J17 | 2008 | Case–control | 4 | 2 | 3 |
| Duprez, DA18 | 2009 | Case–control | 4 | 2 | 3 |
| Mora, S19 | 2009 | Cohort | 3 | 2 | 3 |
| Musunuru, MD5 | 2009 | Cohort | 4 | 2 | 3 |
| Otvos, JD20 | 2011 | Cohort | 3 | 2 | 2 |
| Mackey, RH21 | 2012 | Cohort | 3 | 2 | 1 |
| Berger, JS22 | 2012 | Case–control | 3 | 2 | 3 |
| Mackey, RH21 | 2012 | Cohort | 3 | 2 | 2 |
| Parish, S23 | 2012 | Cohort | 4 | 2 | 1 |
| Mora, S24 | 2013 | Cohort | 4 | 2 | 1 |
| Tsai, MY4 | 2014 | Cohort | 4 | 2 | 2 |
| Akinkuolie, AO25 | 2014 | Cohort | 3 | 2 | 1 |
| Akinkuolie, AO25 | 2014 | Cohort | 3 | 2 | 1 |
| Steffen, BT26 | 2015 | Cohort | 3 | 2 | 1 |
| Chandra, A27 | 2015 | Cohort | 3 | 2 | 1 |
| McGarrah, RW28 | 2016 | Cohort | 3 | 2 | 1 |
| Lawler, PR29 | 2017 | Cohort | 3 | 2 | 1 |
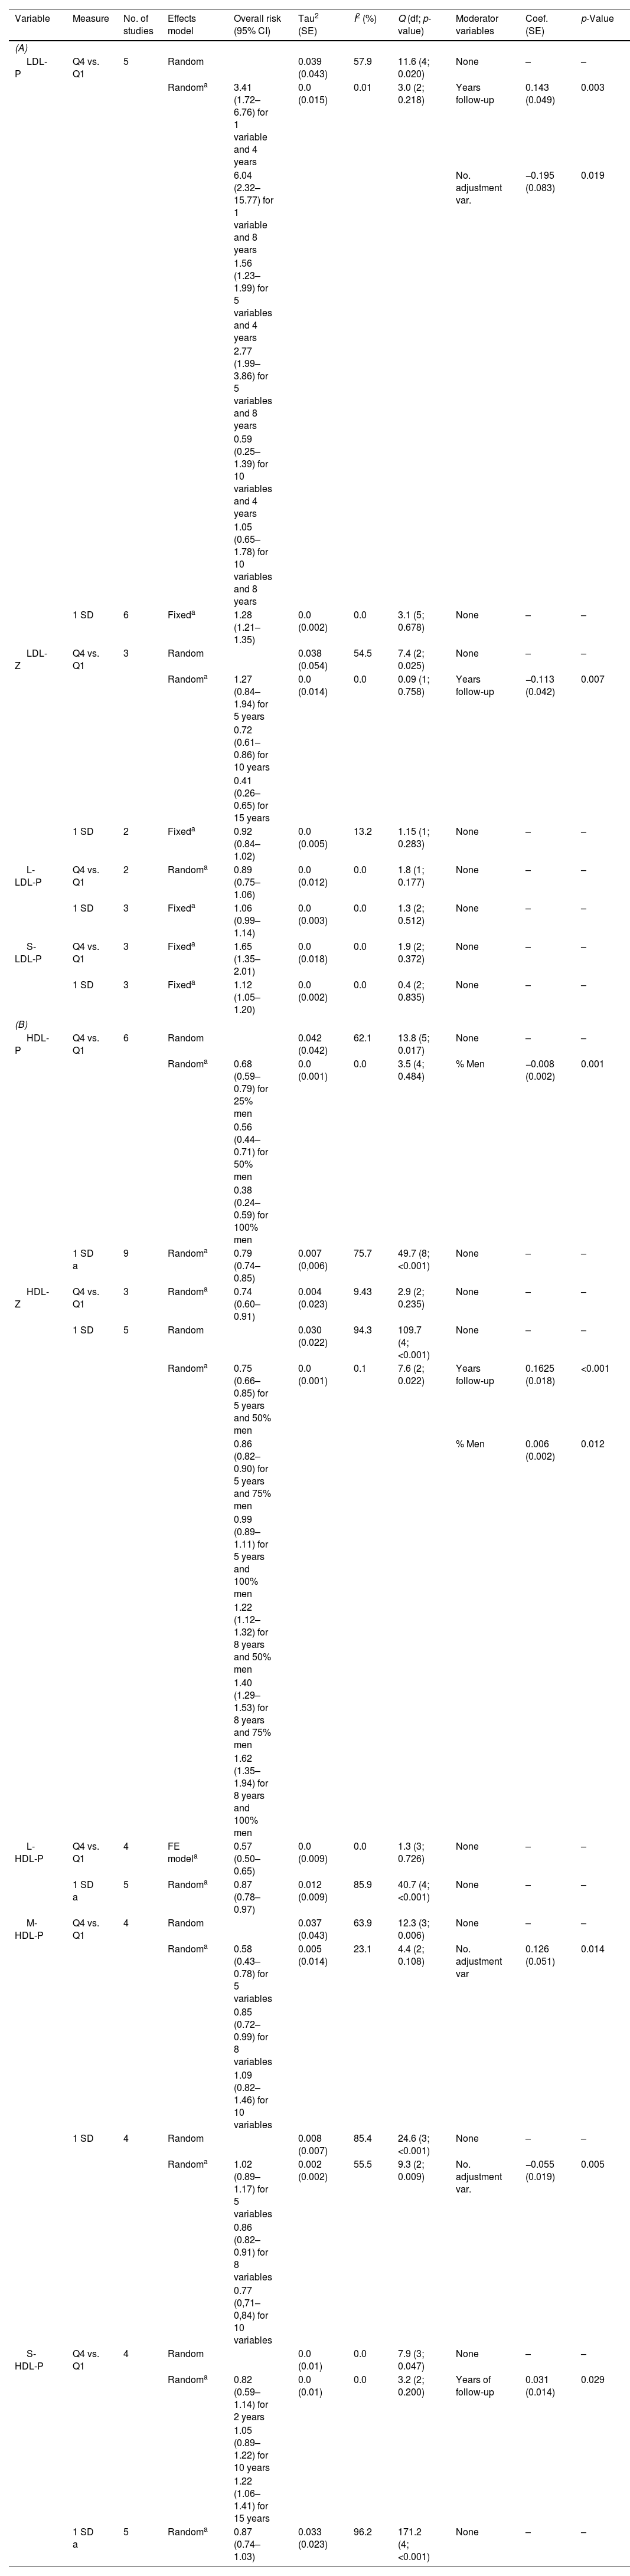
Table 3A shows the cardiovascular risk associated with different LDL parameters. We observed the following:
- •
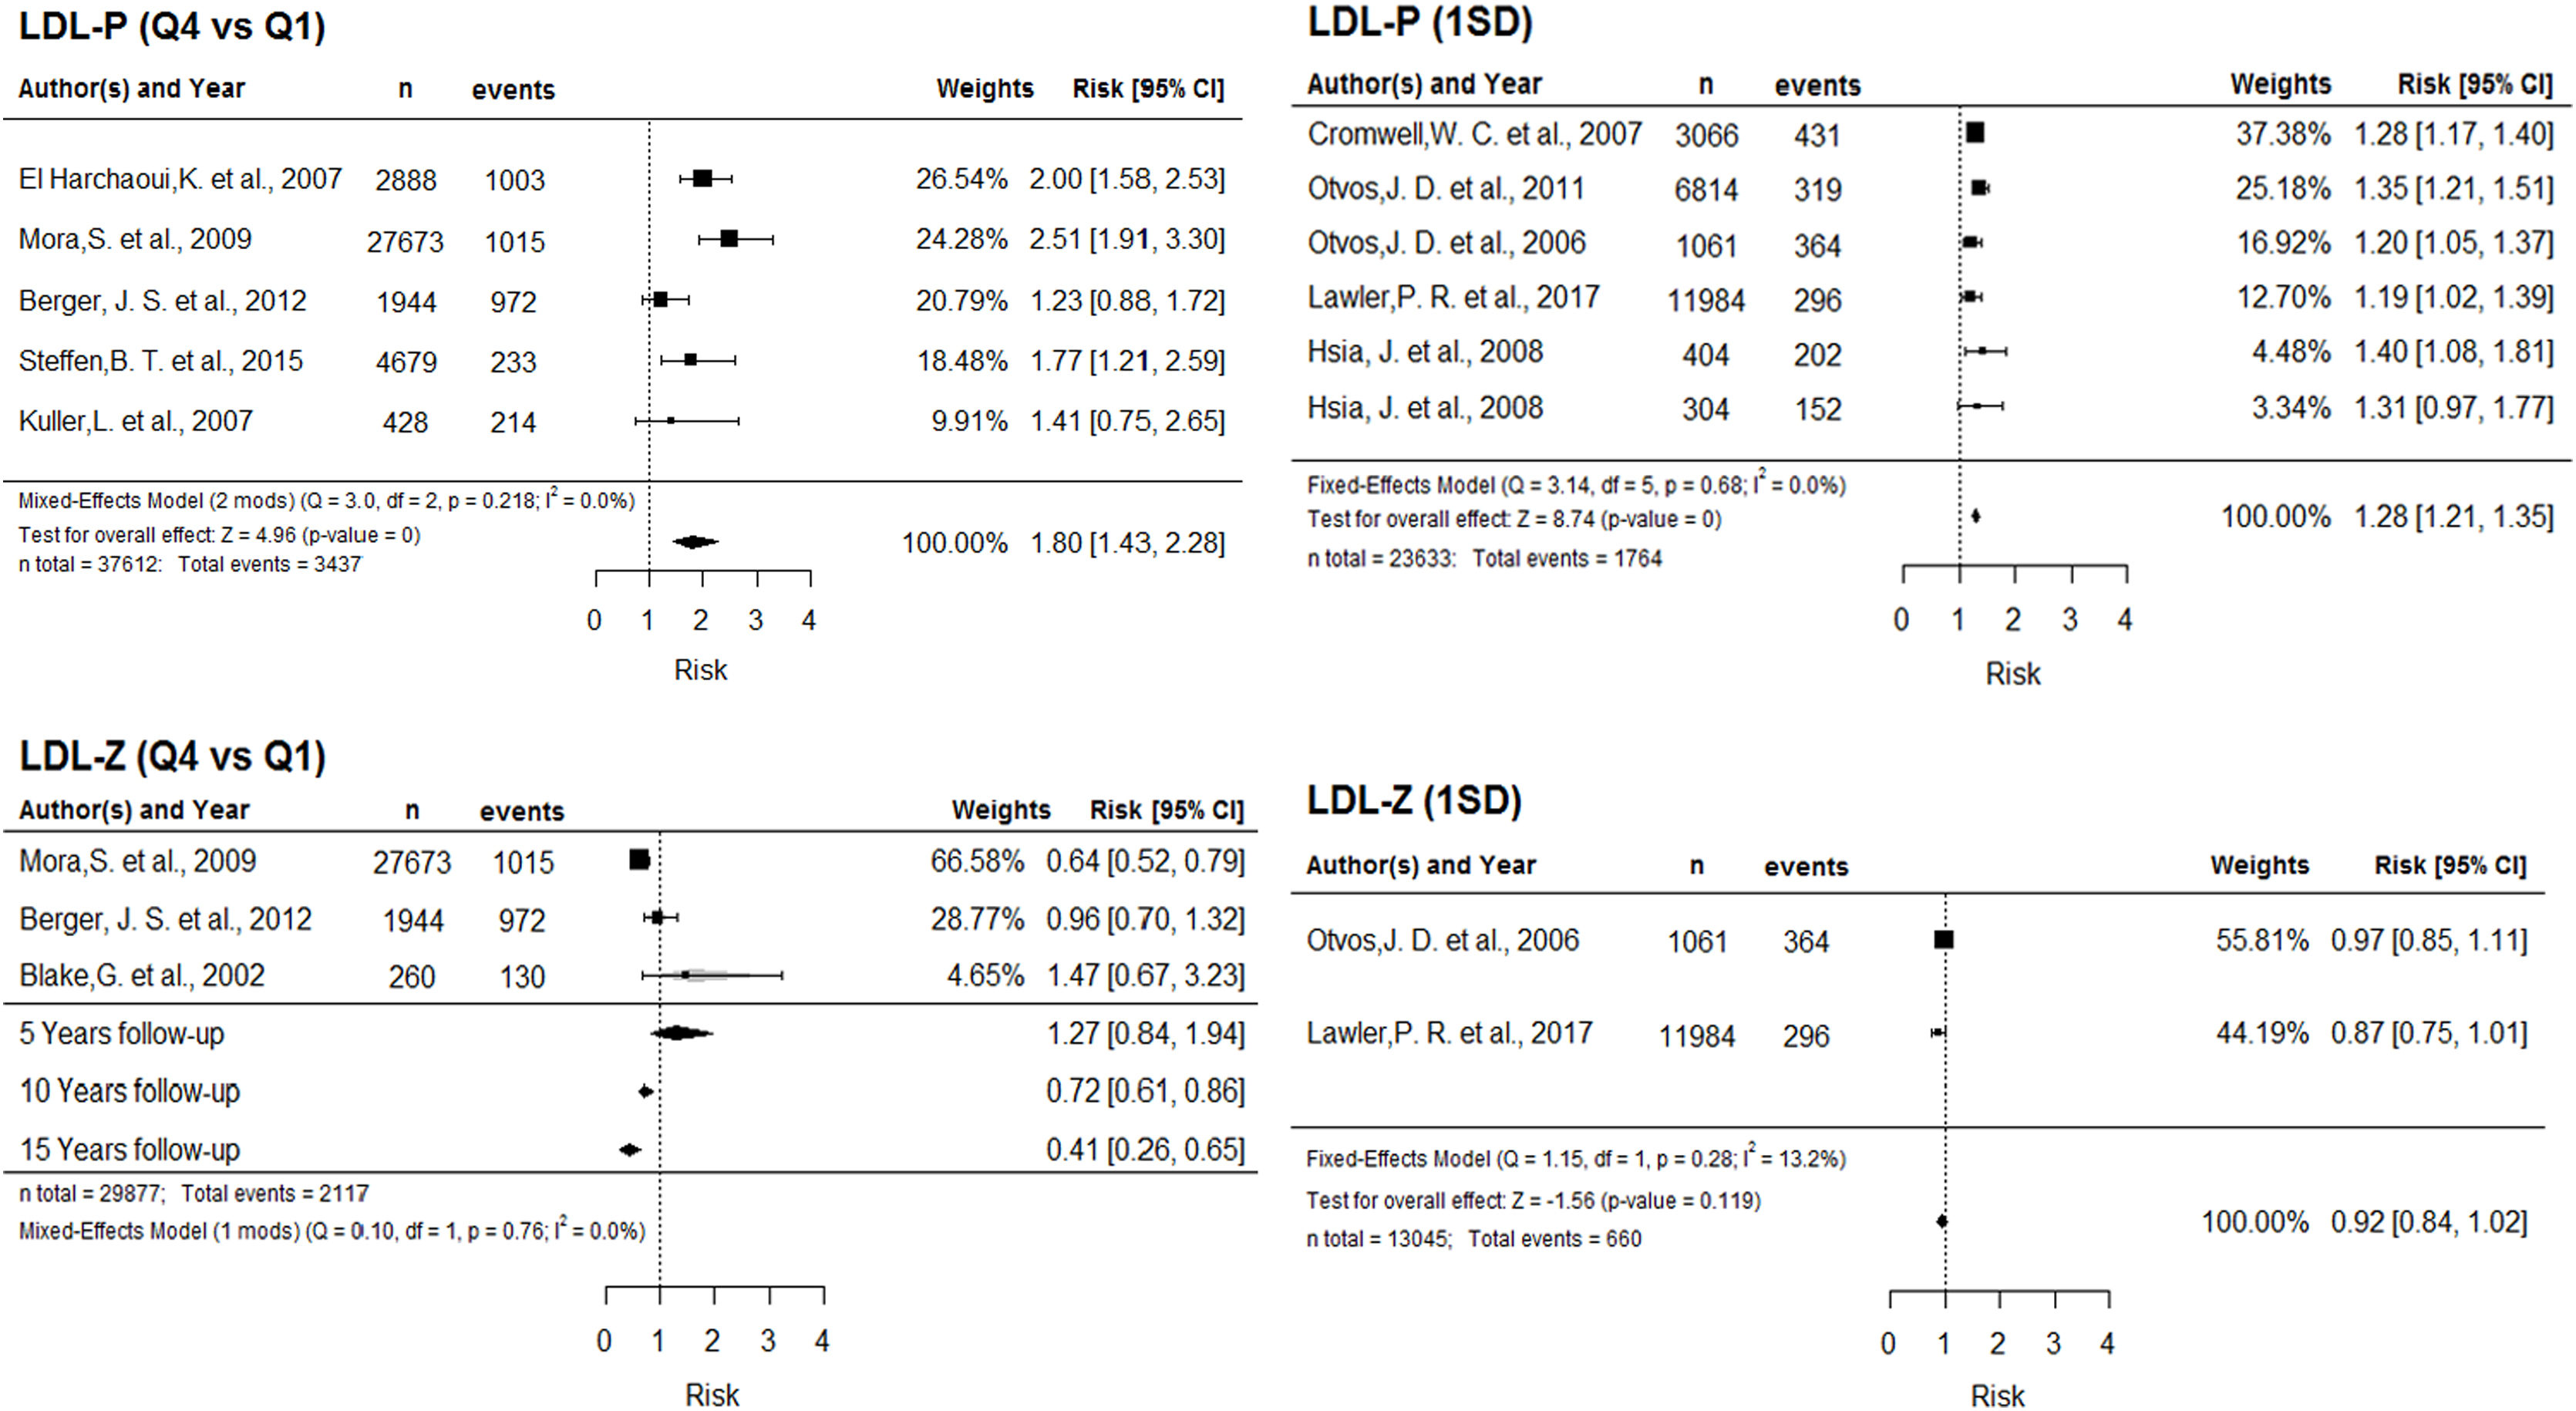
Greater cardiovascular risk with greater number of LDL particles. In the comparison of highest and lowest LDL-P quartiles, the overall effect depends on two moderating variables: number of adjustment variables in the multivariate model, and years of follow-up. The association between cardiovascular risk and LDL-P strengthens with increasing years of follow up, and is limited by the number of adjustment variables. Additionally, each increment of one standard deviation of LDL-P is associated with a 28% cardiovascular risk increase. Fig. 2 depicts the corresponding forest plots.
 and LDL-Z (below), according to Q4 vs. Q1 (left) and 1 SD (right). Abbreviations: LDL-P: number of LDL particles; Q4: highest quartile; Q1: lowest quartile; SD: standard deviation; Q: Cochran") Figure 2.
Figure 2.Forest plot for LDL-P (above) and LDL-Z (below), according to Q4 vs. Q1 (left) and 1 SD (right). Abbreviations: LDL-P: number of LDL particles; Q4: highest quartile; Q1: lowest quartile; SD: standard deviation; Q: Cochran's Q test for heterogeneity; df: degrees of freedom; I2: Higgins I2 statistic; LDL-Z: LDL particle size.
(0.58MB). - •
Greater risk with smaller LDL particle size. The relationship between LDL-Z and cardiovascular risk in the quartile comparison is inverse and significant from 10 years of follow-up, intensifying with increasing follow-up period. For each 1-SD increment in this parameter, we found a significant 8% decrease in risk (Fig. 2).
- •
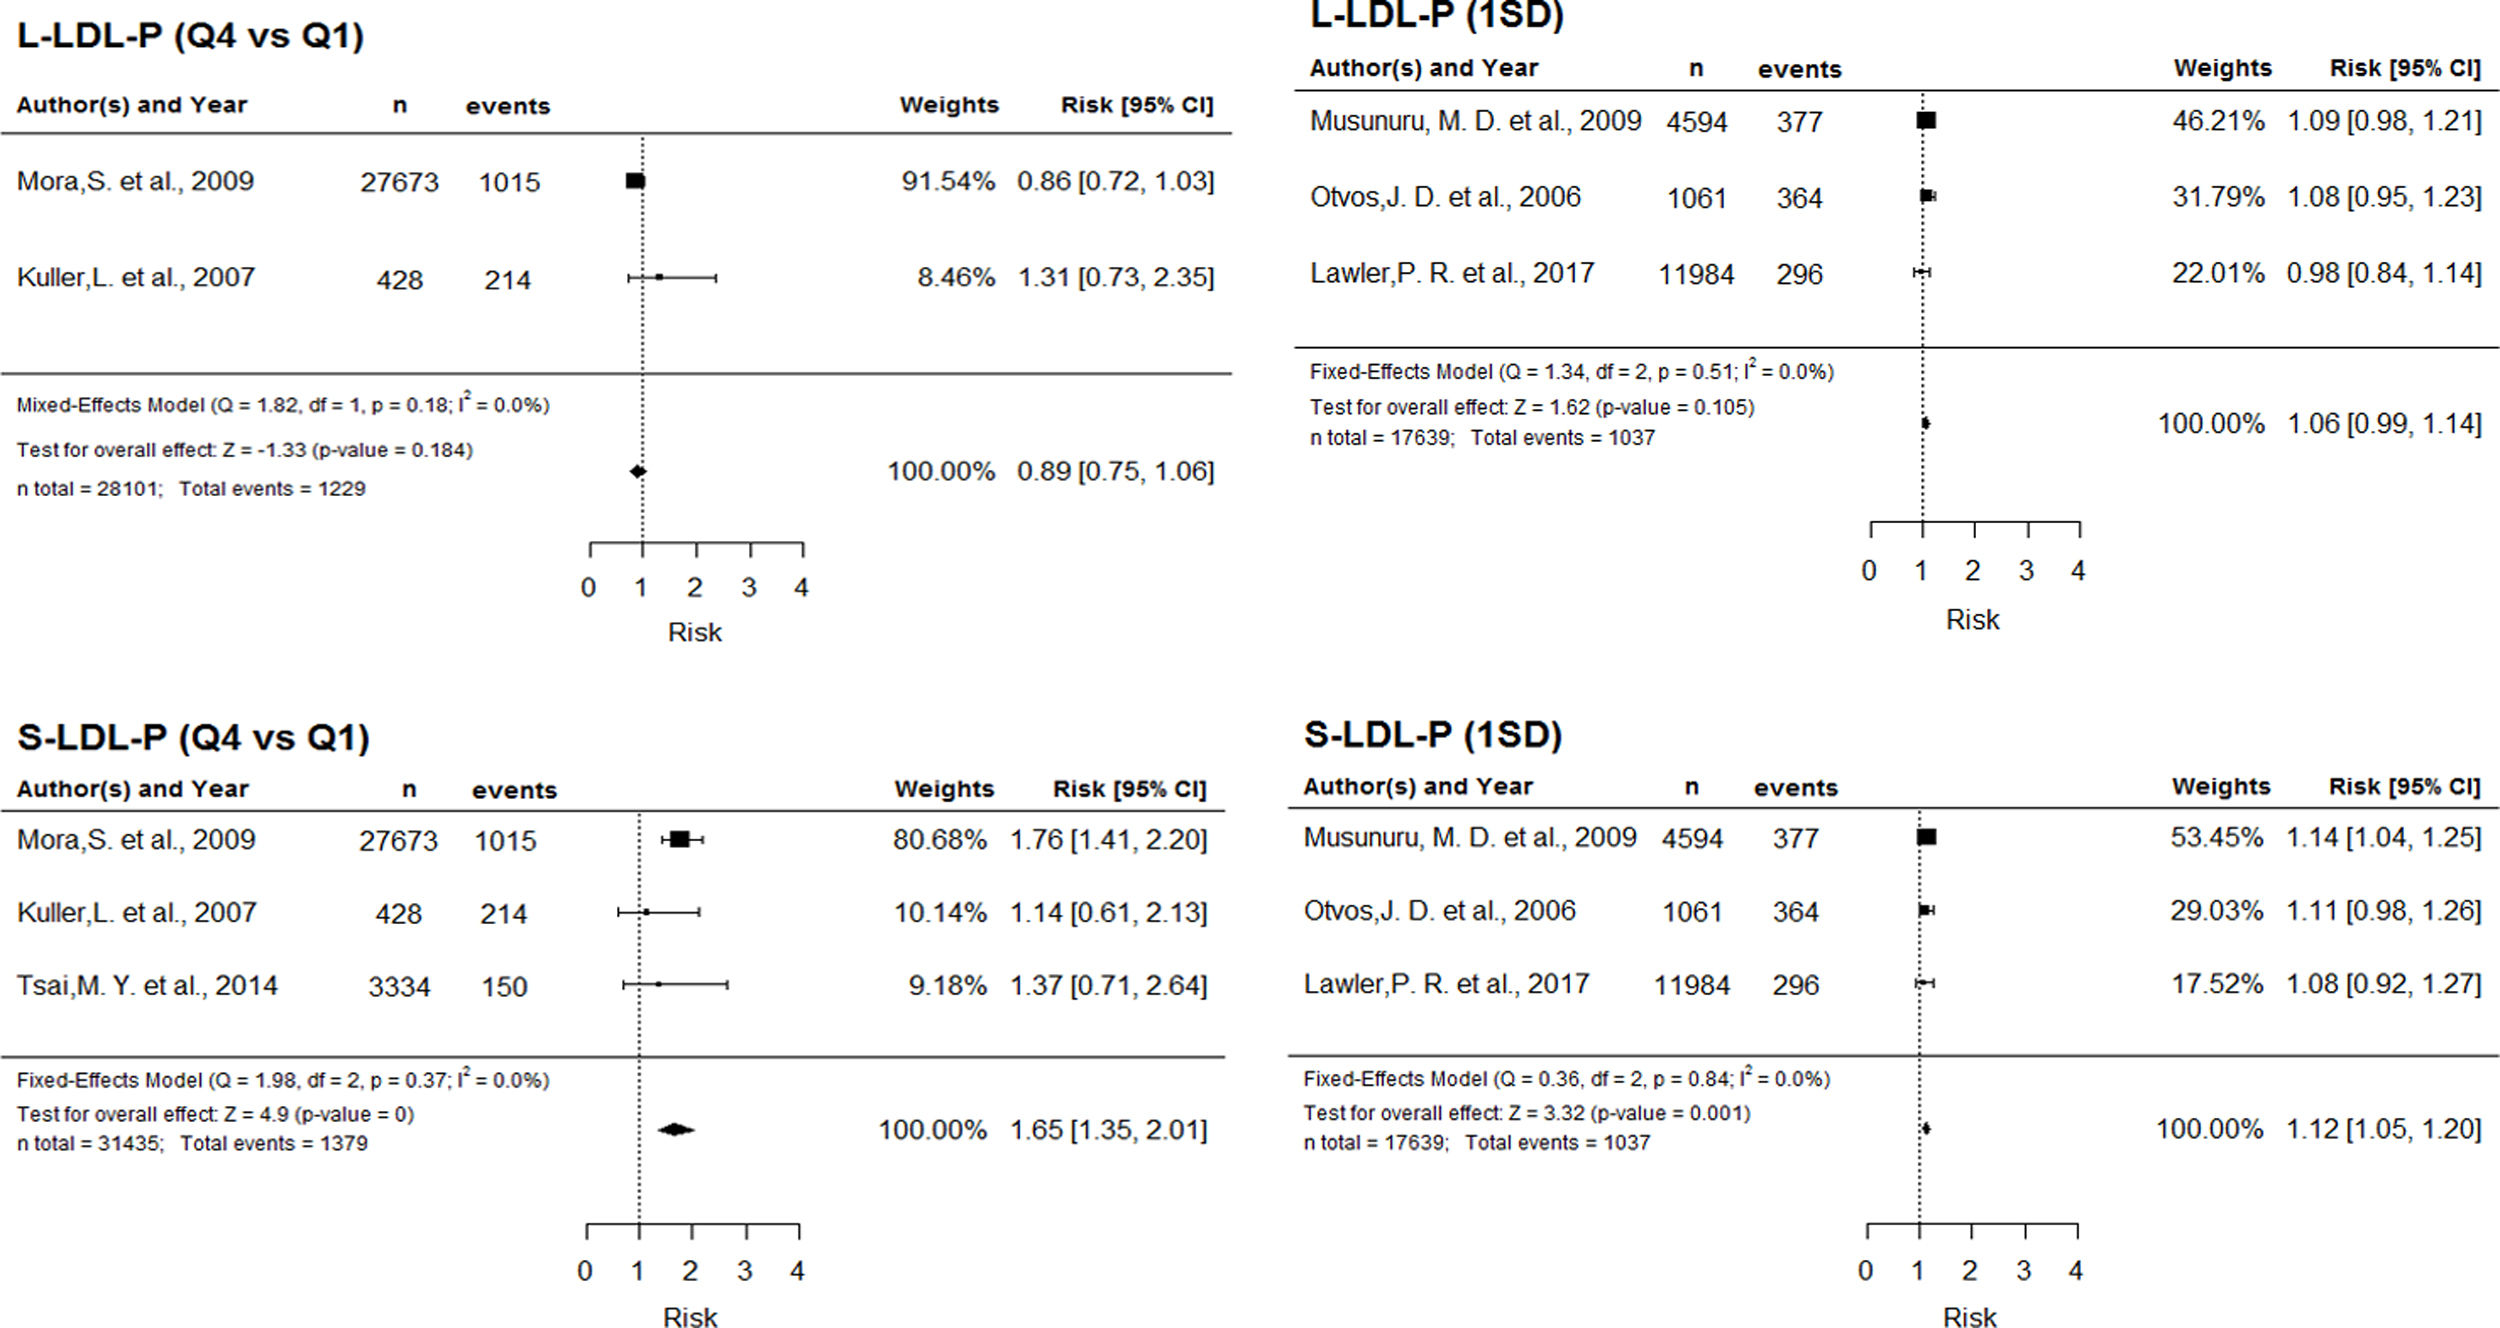
Greater risk with larger number of small LDL molecules. The assessment of LDL subclasses revealed no significant association between risk and number of large particles. For small LDL particles, however, the quartile comparison showed a 65% risk increase, and each SD increment was associated with a 12% risk increase (Supplementary Figure 1).
 and LDL-Z (below), according to Q4 vs. Q1 (left) and 1 SD (right). Abbreviations: LDL-P: number of LDL particles; Q4: highest quartile; Q1: lowest quartile; SD: standard deviation; Q: Cochran")
A) Cardiovascular risk associated with number of LDL particles, LDL particle size and LDL particle subclass numbers and B) Cardiovascular risk associated with number of HDL particles, HDL particle size and HDL particle subclass numbers. A), B).
| Variable | Measure | No. of studies | Effects model | Overall risk (95% CI) | Tau2 (SE) | I2 (%) | Q (df; p-value) | Moderator variables | Coef. (SE) | p-Value |
|---|---|---|---|---|---|---|---|---|---|---|
| (A) | ||||||||||
| LDL-P | Q4 vs. Q1 | 5 | Random | 0.039 (0.043) | 57.9 | 11.6 (4; 0.020) | None | – | – | |
| Randoma | 3.41 (1.72–6.76) for 1 variable and 4 years | 0.0 (0.015) | 0.01 | 3.0 (2; 0.218) | Years follow-up | 0.143 (0.049) | 0.003 | |||
| 6.04 (2.32–15.77) for 1 variable and 8 years | No. adjustment var. | −0.195 (0.083) | 0.019 | |||||||
| 1.56 (1.23–1.99) for 5 variables and 4 years | ||||||||||
| 2.77 (1.99–3.86) for 5 variables and 8 years | ||||||||||
| 0.59 (0.25–1.39) for 10 variables and 4 years | ||||||||||
| 1.05 (0.65–1.78) for 10 variables and 8 years | ||||||||||
| 1 SD | 6 | Fixeda | 1.28 (1.21–1.35) | 0.0 (0.002) | 0.0 | 3.1 (5; 0.678) | None | – | – | |
| LDL-Z | Q4 vs. Q1 | 3 | Random | 0.038 (0.054) | 54.5 | 7.4 (2; 0.025) | None | – | – | |
| Randoma | 1.27 (0.84–1.94) for 5 years | 0.0 (0.014) | 0.0 | 0.09 (1; 0.758) | Years follow-up | −0.113 (0.042) | 0.007 | |||
| 0.72 (0.61–0.86) for 10 years | ||||||||||
| 0.41 (0.26–0.65) for 15 years | ||||||||||
| 1 SD | 2 | Fixeda | 0.92 (0.84–1.02) | 0.0 (0.005) | 13.2 | 1.15 (1; 0.283) | None | – | – | |
| L-LDL-P | Q4 vs. Q1 | 2 | Randoma | 0.89 (0.75–1.06) | 0.0 (0.012) | 0.0 | 1.8 (1; 0.177) | None | – | – |
| 1 SD | 3 | Fixeda | 1.06 (0.99–1.14) | 0.0 (0.003) | 0.0 | 1.3 (2; 0.512) | None | – | – | |
| S-LDL-P | Q4 vs. Q1 | 3 | Fixeda | 1.65 (1.35–2.01) | 0.0 (0.018) | 0.0 | 1.9 (2; 0.372) | None | – | – |
| 1 SD | 3 | Fixeda | 1.12 (1.05–1.20) | 0.0 (0.002) | 0.0 | 0.4 (2; 0.835) | None | – | – | |
| (B) | ||||||||||
| HDL-P | Q4 vs. Q1 | 6 | Random | 0.042 (0.042) | 62.1 | 13.8 (5; 0.017) | None | – | – | |
| Randoma | 0.68 (0.59–0.79) for 25% men | 0.0 (0.001) | 0.0 | 3.5 (4; 0.484) | % Men | −0.008 (0.002) | 0.001 | |||
| 0.56 (0.44–0.71) for 50% men | ||||||||||
| 0.38 (0.24–0.59) for 100% men | ||||||||||
| 1 SD a | 9 | Randoma | 0.79 (0.74–0.85) | 0.007 (0,006) | 75.7 | 49.7 (8; <0.001) | None | – | – | |
| HDL-Z | Q4 vs. Q1 | 3 | Randoma | 0.74 (0.60–0.91) | 0.004 (0.023) | 9.43 | 2.9 (2; 0.235) | None | – | – |
| 1 SD | 5 | Random | 0.030 (0.022) | 94.3 | 109.7 (4; <0.001) | None | – | – | ||
| Randoma | 0.75 (0.66–0.85) for 5 years and 50% men | 0.0 (0.001) | 0.1 | 7.6 (2; 0.022) | Years follow-up | 0.1625 (0.018) | <0.001 | |||
| 0.86 (0.82–0.90) for 5 years and 75% men | % Men | 0.006 (0.002) | 0.012 | |||||||
| 0.99 (0.89–1.11) for 5 years and 100% men | ||||||||||
| 1.22 (1.12–1.32) for 8 years and 50% men | ||||||||||
| 1.40 (1.29–1.53) for 8 years and 75% men | ||||||||||
| 1.62 (1.35–1.94) for 8 years and 100% men | ||||||||||
| L-HDL-P | Q4 vs. Q1 | 4 | FE modela | 0.57 (0.50–0.65) | 0.0 (0.009) | 0.0 | 1.3 (3; 0.726) | None | – | – |
| 1 SD a | 5 | Randoma | 0.87 (0.78–0.97) | 0.012 (0.009) | 85.9 | 40.7 (4; <0.001) | None | – | – | |
| M-HDL-P | Q4 vs. Q1 | 4 | Random | 0.037 (0.043) | 63.9 | 12.3 (3; 0.006) | None | – | – | |
| Randoma | 0.58 (0.43–0.78) for 5 variables | 0.005 (0.014) | 23.1 | 4.4 (2; 0.108) | No. adjustment var | 0.126 (0.051) | 0.014 | |||
| 0.85 (0.72–0.99) for 8 variables | ||||||||||
| 1.09 (0.82–1.46) for 10 variables | ||||||||||
| 1 SD | 4 | Random | 0.008 (0.007) | 85.4 | 24.6 (3; <0.001) | None | – | – | ||
| Randoma | 1.02 (0.89–1.17) for 5 variables | 0.002 (0.002) | 55.5 | 9.3 (2; 0.009) | No. adjustment var. | −0.055 (0.019) | 0.005 | |||
| 0.86 (0.82–0.91) for 8 variables | ||||||||||
| 0.77 (0,71–0,84) for 10 variables | ||||||||||
| S-HDL-P | Q4 vs. Q1 | 4 | Random | 0.0 (0.01) | 0.0 | 7.9 (3; 0.047) | None | – | – | |
| Randoma | 0.82 (0.59–1.14) for 2 years | 0.0 (0.01) | 0.0 | 3.2 (2; 0.200) | Years of follow-up | 0.031 (0.014) | 0.029 | |||
| 1.05 (0.89–1.22) for 10 years | ||||||||||
| 1.22 (1.06–1.41) for 15 years | ||||||||||
| 1 SD a | 5 | Randoma | 0.87 (0.74–1.03) | 0.033 (0.023) | 96.2 | 171.2 (4; <0.001) | None | – | – | |
Tau2: between-study variance; I2: Higgins I2 statistic; Q: Cochran's Q test for heterogeneity; df: degrees of freedom; Coef.: coefficient; SE: standard error; CI: confidence interval; LDL-P: number of LDL particles; Q4: highest quartile; Q1: lowest quartile; SD: standard deviation; LDL-Z: LDL particle size; L-LDL-P: large LDL particle subclass; S-LDL-P: small LDL particle subclass; HDL-P: number of HDL particles; HDL-Z: HDL particle size; L-HDL-P: large HDL particle subclass; M-HDL-P: medium-sized HDL particle subclass
Table 3B presents the results of the HDL parameter assessment. We observed the following:
- •
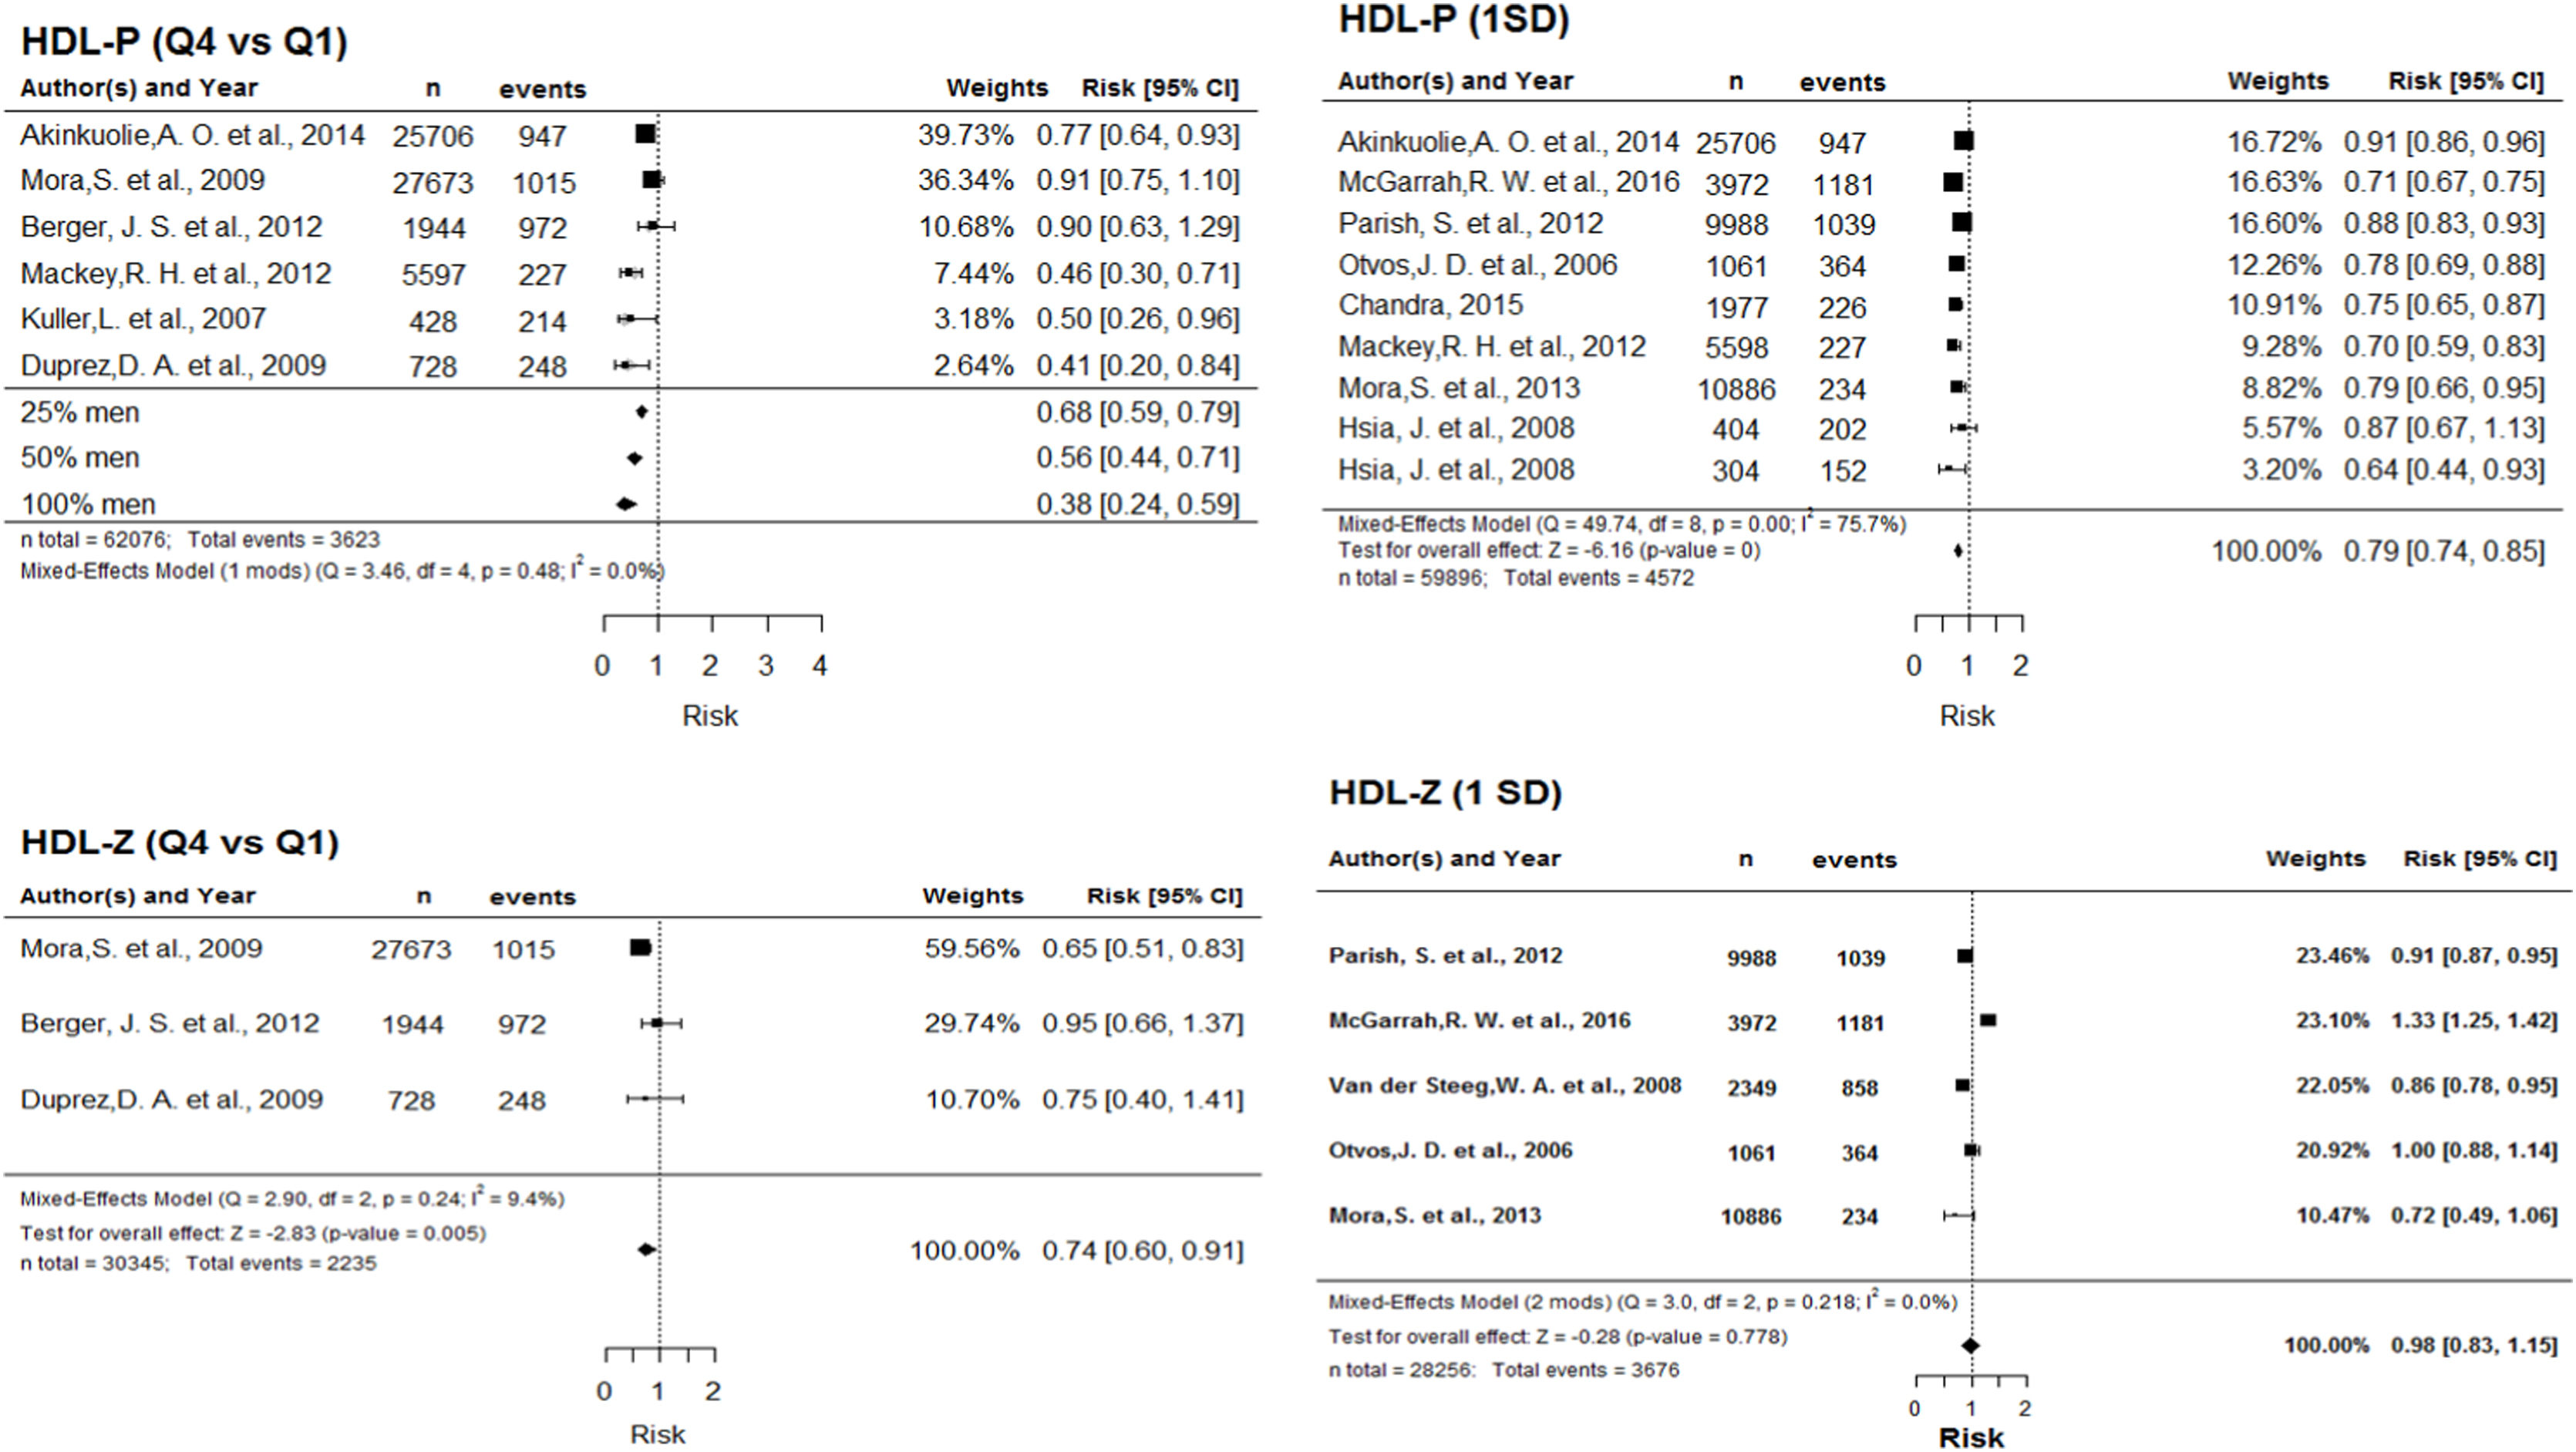
Smaller cardiovascular risk with larger number of HDL particles. The highest/lowest quartile comparison is adjusted for percentage of men in the studies. For all proportions of men, larger HDL-P provides greater protection, although this relationship intensifies as the percentage of men in the study increases. The assessment based on 1-SD increment shows a progressive and significant reduction of risk with increasing HDL-P (Fig. 3).
 and HDL-Z (below), according to Q4 vs. Q1 (left) and 1 SD (right). Abbreviations: HDL-P: number of HDL particles; Q4: highest quartile; Q1: lowest quartile; SD: standard deviation; Q: Cochran") Figure 3.
Figure 3.Forest plot for HDL-P (above) and HDL-Z (below), according to Q4 vs. Q1 (left) and 1 SD (right). Abbreviations: HDL-P: number of HDL particles; Q4: highest quartile; Q1: lowest quartile; SD: standard deviation; Q: Cochran's Q test for heterogeneity; df: degrees of freedom; I2: Higgins I2 statistic; HDL-Z: HDL particle size.
(0.57MB). - •
Smaller cardiovascular risk with larger HDL particle size. Cardiovascular risk is significantly reduced as particle size increases. In the comparison of quartiles, this association has a magnitude of 0.74. The effect of a 1-SD increment depends on years of follow up and percentage of men in the study, shifting from protective against to predictive of cardiovascular events as these two moderating variables increase (Fig. 3).
- •
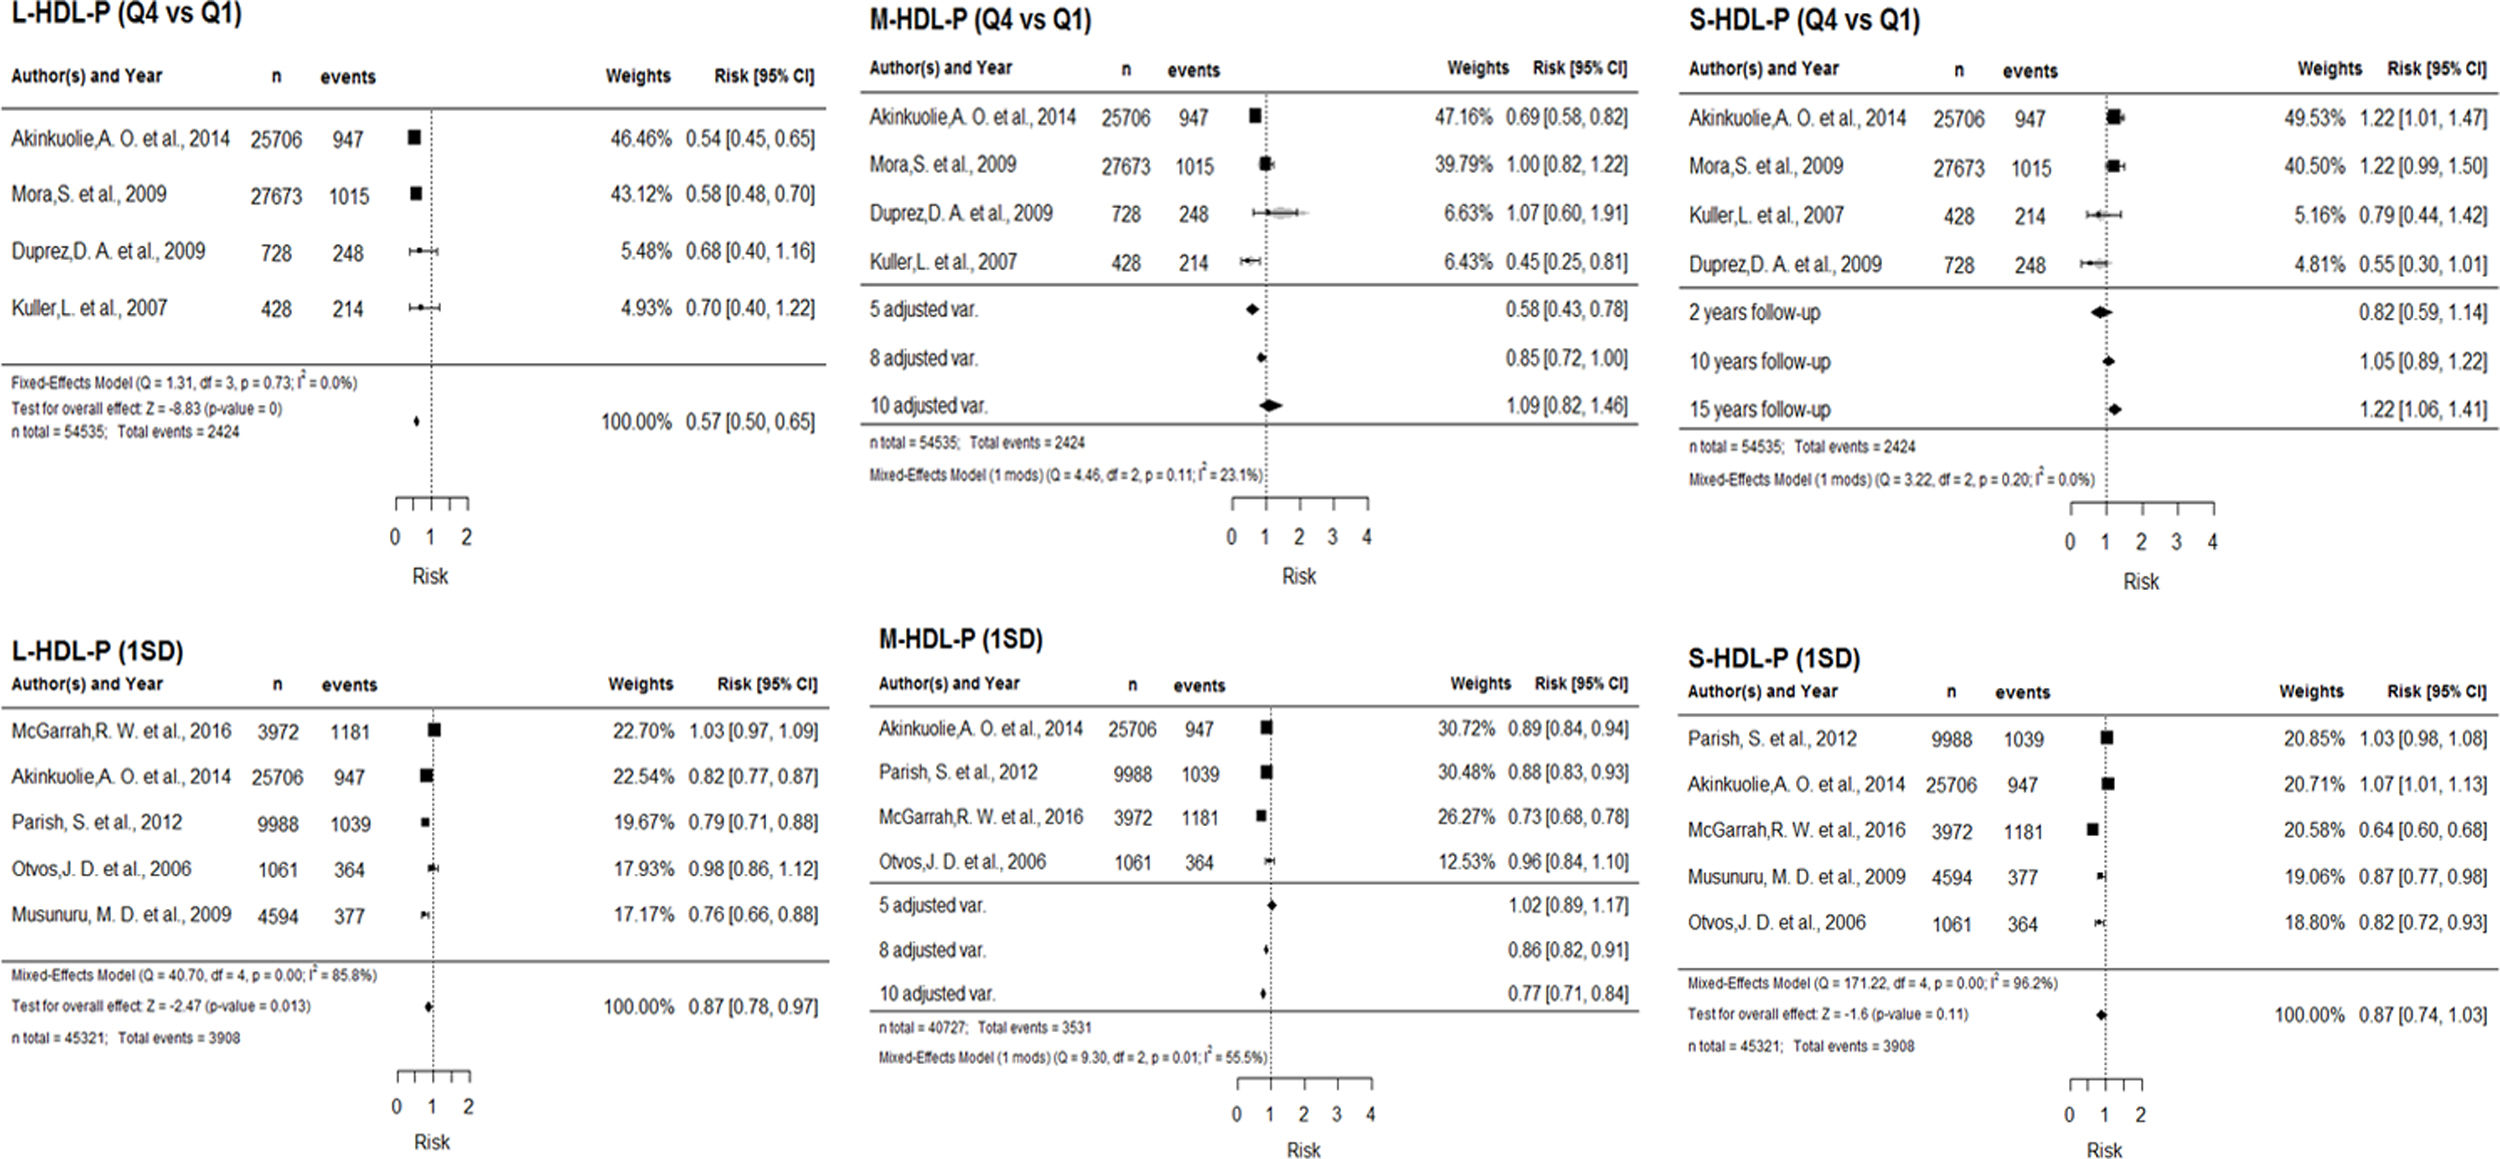
Greater protection with larger subclass particle size. Large particles provide a significant protective effect, with a magnitude of 0.57 in the Q4/Q1 quartile comparison, and 0.87 per SD increment of L-HDL-P. Medium-sized particles also provide a significant protective effect against cardiovascular risk, but the magnitude of this protection depends on the number of adjustment variables in the multivariate models. When we compare the highest and lowest quartiles of M-HDL-P, introducing number of adjustment variables corrects heterogeneity, and the protective effect ceases to be significant as the number of adjustment variables increases. For the 1-SD measure, including this moderating variable does not correct heterogeneity. The effect of small particles on cardiovascular risk depends on follow-up time: the risk is significant, with a magnitude of 1.22, only with a long follow-up period (15 years). Supplementary Figure 2 depicts the corresponding forest plots.
 and HDL-Z (below), according to Q4 vs. Q1 (left) and 1 SD (right). Abbreviations: HDL-P: number of HDL particles; Q4: highest quartile; Q1: lowest quartile; SD: standard deviation; Q: Cochran")
For the particle parameters HDL-P, L-HDL-P and S-HDL-P, with the 1-SD measure, neither fitting a random effects model nor including moderator variables corrected heterogeneity. In each case a sensitivity analysis was performed to determine whether removing studies one by one would improve or affect heterogeneity (Supplementary Tables 1, 2 and 3, respectively). Heterogeneity was not corrected for any of the three parameters. For HDL-P, however, the overall effect is stable and significantly protective after removing any study (Supplementary Table 1). For L-HDL-P there is some ambiguity regarding the overall effect (Supplementary Table 2), and for S-HDL-P a non-significant protective effect remains in almost all cases (Supplementary Table 3).
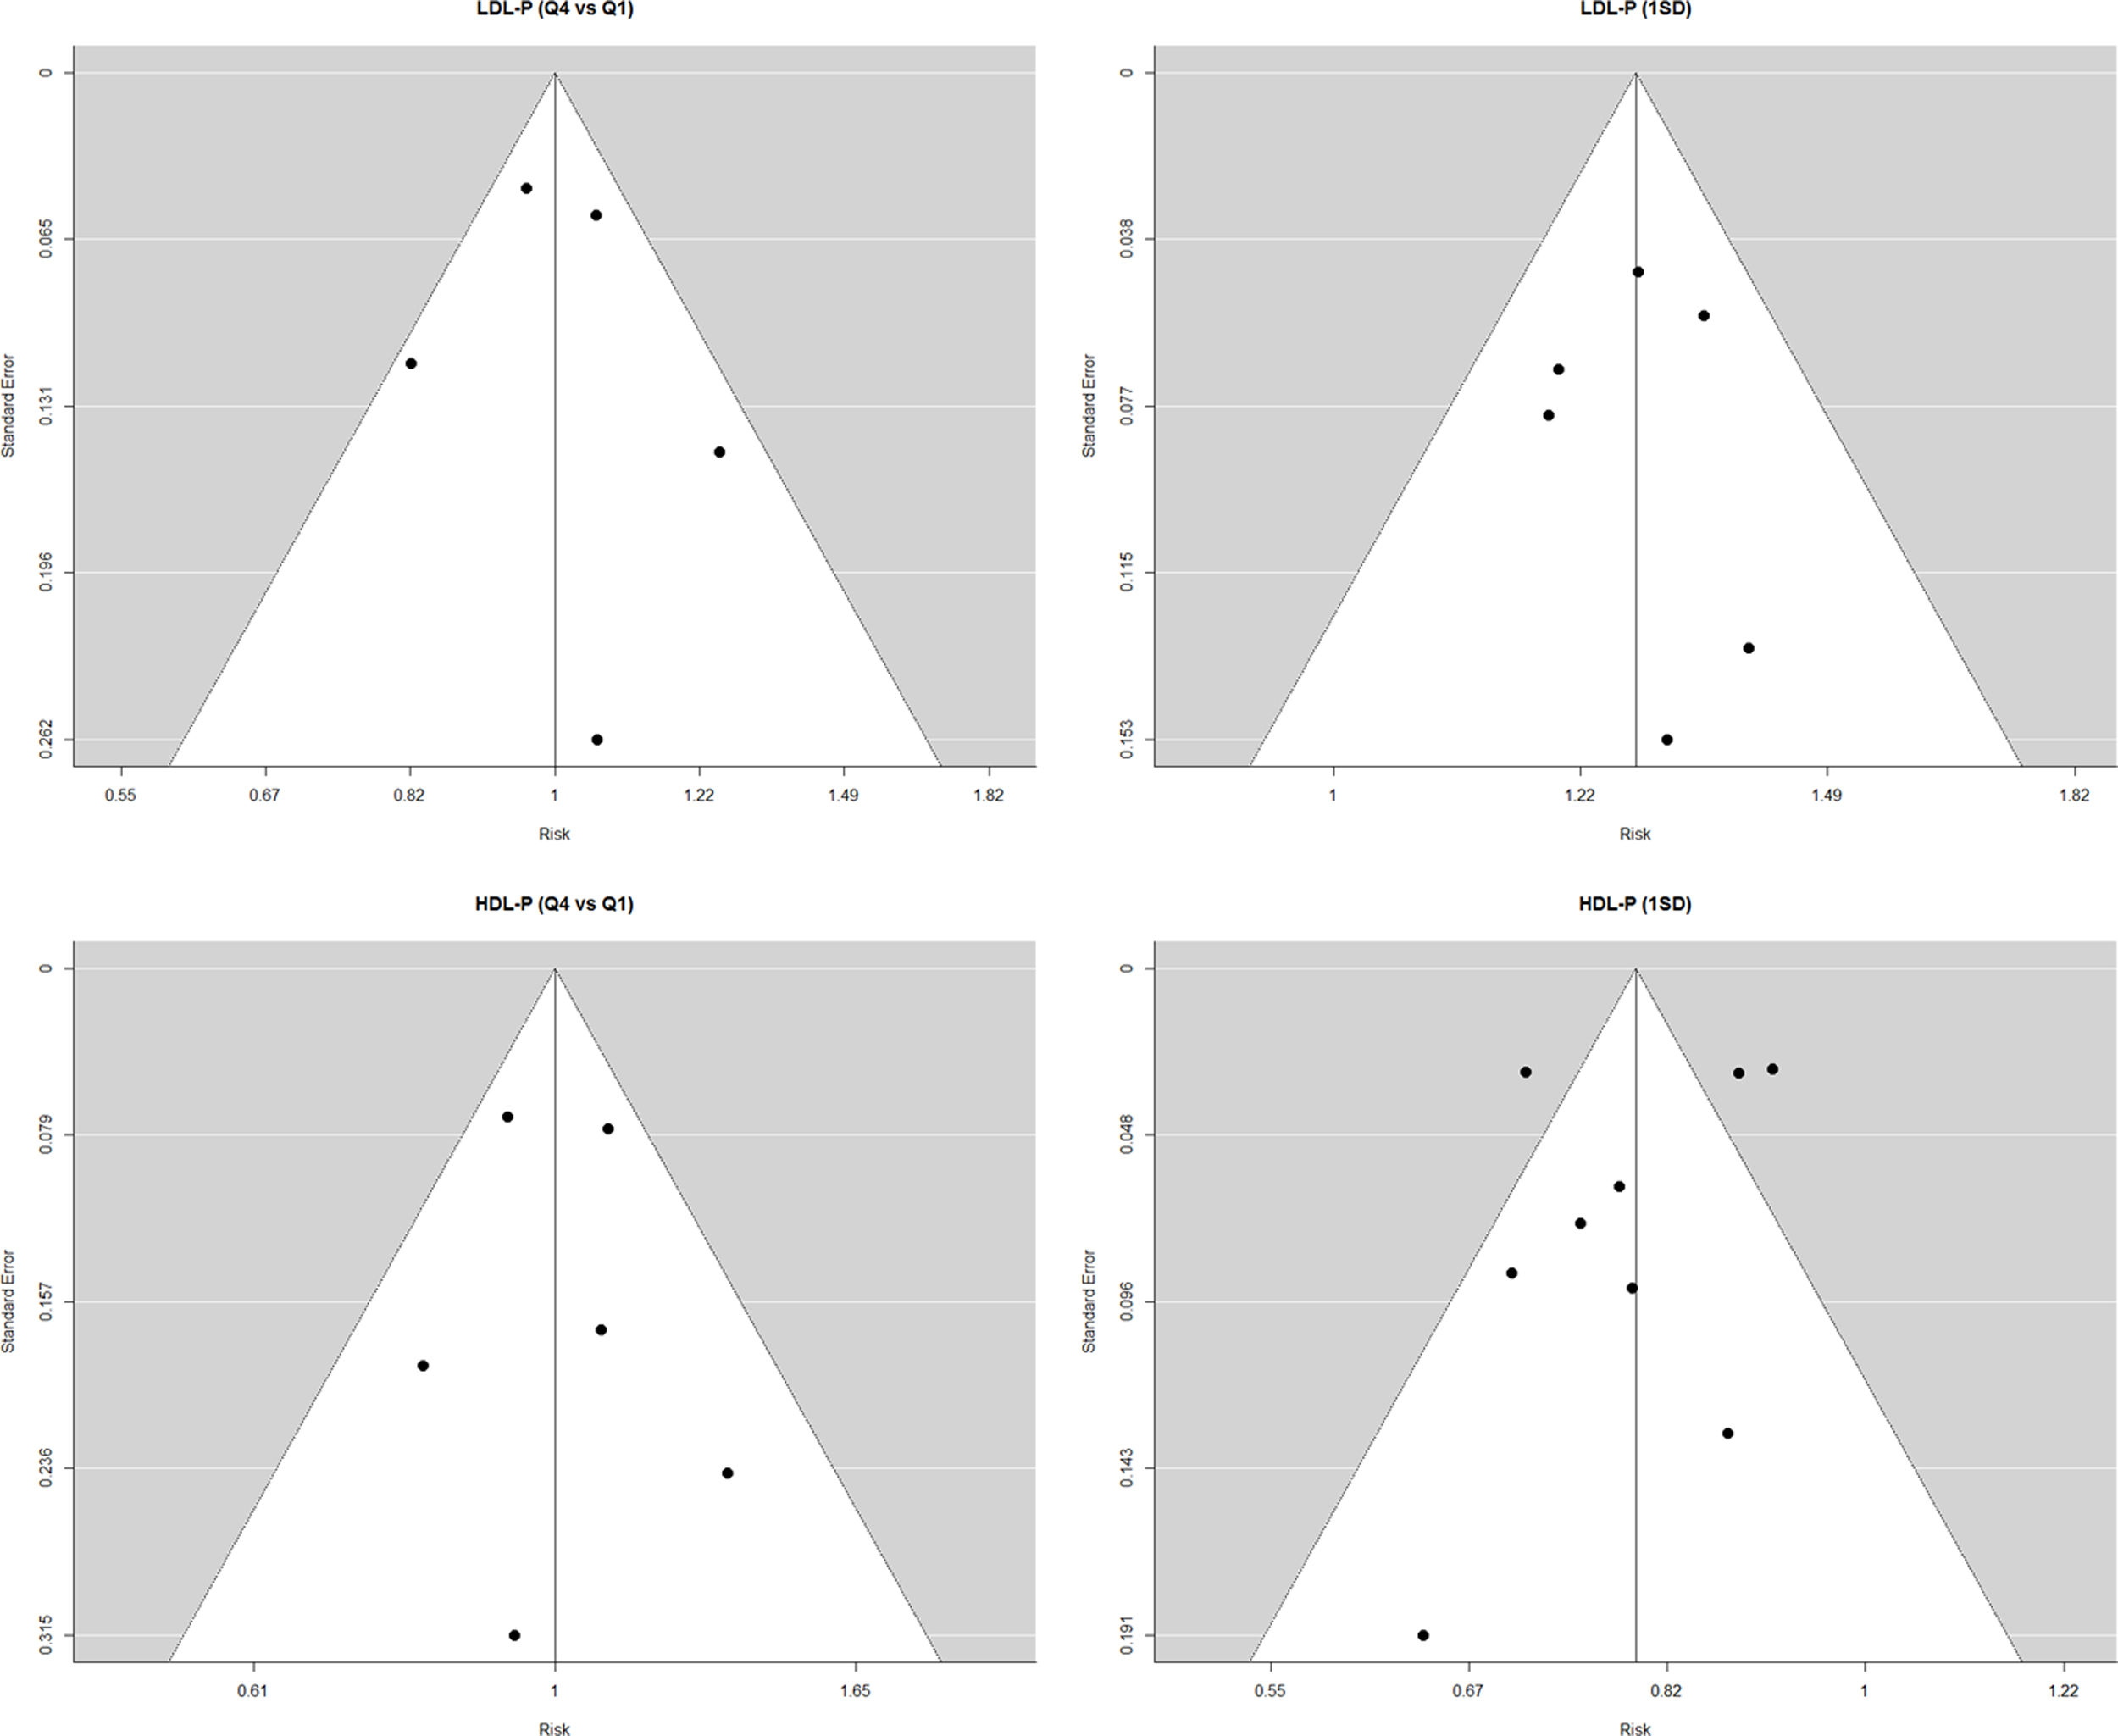
We assessed publication bias by creating funnel plots for the parameters LDL-P and HDL-P with their two exposure measures (Supplementary Figure 3). This evaluation showed no significant dispersion, indicating a low risk of publication bias, except in the case of HDL-P per SD increment, in which three of the nine studies are outside the 95% CI.
DiscussionThis systematic review demonstrates that the number and size of LDL and HDL particles exert a significant effect on cardiovascular risk. We observed a significant increase in cardiovascular risk with increasing numbers of LDL particles and small LDL particles. There was an inverse association between LDL particle size and cardiovascular risk, and this effect intensified with longer follow-up. In contrast, high numbers of HDL particles provide significant protection against cardiovascular events. This effect is clearer for the parameters HDL-P and L-HDL-P, and less clear for M-HDL-P and S-HDL-P. Larger HDL-Z provides a protective effect for up to 5 years of follow up; this effect is inverted with longer follow-up periods.
Despite the efficacy of hypercholesterolaemia treatment – which includes lifestyle changes and use of statins, cholesterol absorption inhibitors and, more recently, PCSK9 inhibitors – the incidence of cardiovascular episodes is high, even in patients with normal or low LDL-C.30,31 Furthermore, in a large proportion of patients admitted to hospital with acute coronary syndrome, the most frequent abnormality in the lipid profile is low HDL-C,32 reflecting a possible lack of protective factors against atherosclerosis.
LDLLipidomic analysis has shown that abnormal size and composition of HDL particles is related to the occurrence and severity of coronary heart disease determined by coronary angiography.33 Whether assessing the number of LDL particles can predict cardiovascular risk more accurately than conventional measurement of LDL-C and HDL-C concentrations remains controversial.26,34 It is generally agreed that cardiovascular risk is closely and positively associated with increasing number of LDL particles, although assessing LDL subclasses has not always added value to traditional risk stratification.35
Beyond the conventional method of LDL cholesterol measurement, quantifying small and dense LDL particles can help to identify patients with greater cardiovascular risk. We know that these particles have a greater tendency to oxidation and glycation, are less readily taken up by the liver, and have greater affinity for proteoglycans in the arterial wall and greater capacity to infiltrate the endothelium.4,36 However, they transport less cholesterol than the larger molecules and for this reason, patients with a high proportion of S-LDL-P may have low levels of LDL-C, despite their high atherogenic risk. It is estimated that a patient with a predominance of small particles may have 70% more particles than another patient with the same levels of LDL cholesterol transported in large particles.34 In some cases, total LDL-C is very unrepresentative of LDL particle numbers, as in diabetic patients, who do not have high LDL cholesterol concentrations but do have elevated LDL-P and S-LDL-P. We know that in people with low HDL and high triglycerides, LDL particles have lower cholesterol content than normal LDL and are denser with a lower lipid content in proportion to protein. This suggests that small, dense LDL particles could be a marker of atherogenesis.37 Although we still have much to learn about the complex mechanisms of lipid metabolism, we know that very-low-density lipoprotein cholesterol (VLDL-C) and triglycerides are key determinants of the distribution of LDL particles and its subtypes: an increase in these two parameters favours the development of smaller and denser LDL particles.38
There is evidence to show that in patients on statins, a high proportion of residual risk is due to small VLDL particles.29 Treatment with fibrates, on the other hand, is associated with an increase in the size and number of LDL particles, and the increase in HDL levels can be mostly explained by smaller HDL subparticles.12,39
HDLThe evidence relating HDL-C with cardiovascular disease and death is inconsistent and weak.40 Studies have shown that HDL-C levels in blood cannot accurately reflect atherogenic potential unless the characteristics of these molecules are also analysed. The antioxidant effect of HDL and its ability to extract cholesterol from cells and produce nitric oxide is not well represented by total HDL concentration, which greatly depends on the larger and more cholesterol-rich HDL subclasses.41 As with LDL, analysing the subclasses of HDL appears to provide more accurate information about its biological action, and thus its relationship with cardiovascular risk. The relationship between HDL-C/HDL-P and risk of cardiovascular disease progression supports the hypothesis that the potential of these lipoproteins to oppose atherosclerosis decreases when the particles are overloaded with cholesterol.24,28,42
It is widely agreed that cardiovascular risk decreases progressively as number of HDL particles increases, but robust evidence on the relationship between HDL particle subclasses and cardiovascular risk is lacking. In the literature we found studies such as JUPITER or HPS, which report no independent association,23,24 studies suggesting that the protective effect is mainly attributable to smaller subclasses,28,43,44 and other studies indicating the contrary.19 This reveals the complexity of these particles’ biological function and also the varying distributions between different populations. These divergent results have been attributed, at least in part, to the diverse methods of HDL subclass characterisation (ultracentrifugation, gel electrophoresis, ion mobility, proton NMR). Indeed, the results of the JUPITER study show a close association when HDL particles are measured by NMR, but no association when they are measured by ion mobility.45 In our analysis, the inverse relationship of HDL particle number and size with cardiovascular risk is intense and significant: greater protection with larger HDL-P, HDL-Z and L-HDL-P. However, the effect of medium-sized and small particle numbers is less clear.
The diversity in HDL particle composition and function could explain why strategies designed to increase HDL-C values have not succeeded in reducing cardiovascular risk, because they disrupt the balance between HDL particle subpopulations. Clinical trials of different pharmacological strategies for elevating serum HDL-C levels have reported no change in the incidence of cardiovascular complications, despite HDL-C increases of more than 100%.7,46 These results have been attributed to HDL dysfunction, and observational studies have shown that it is precisely the functionality of HDL particles that is independently associated with a lower incidence of cardiovascular complications.40,47,48 HDL-C-elevating drugs that did not improve cardiovascular outcomes in some studies include niacin,49 nicotinic acid and laropiprant7 and the CETP inhibitors torcetrapib50 and evacetrapib.51 Some authors have suggested that a large amount of cholesterol per HDL particle may reflect a potential dysfunction, as it shows the particles are overloaded with cholesterol and thus have less capacity to participate in reverse cholesterol transport.42
Our study has two main limitations. Firstly, because factors such as pharmacological treatments, diabetes, triglyceride levels and chronic inflammatory states can greatly influence the complex biological function of lipoproteins, the results of studies like ours are highly population-dependent. Secondly, the measures used in the included studies correspond to a still photo of a dynamic process that involves constant remodelling and compositional change of lipids, phospholipids and apolipoproteins.
Further studies are needed to discover more about the mechanisms of high atherogenic risk with a view to developing strategies for identifying and treating affected patients.
We found that cardiovascular risk is better reflected by the number and type of lipoprotein particles than by the amount of cholesterol they contain. Cardiovascular risk increases with larger number and smaller size of LDL particles, while risk decreases with increasing HDL particle size and number.
FundingThis work was partially funded by the Centro de Investigación Biomédica en Red de Enfermedades Cardiovasculares [CIBERCV 16/11/00420 and 16/11/00226], the Spanish national network for biomedical research on cardiovascular disease.
Conflicts of interestNone.
This study was supported by the project Prometeo/2017/173, of the Valencian regional ministry of education, research, culture and sport.


