


Elevated plantar pressure (PP) constitutes a risk factor for developing foot ulcers. Once present, elevated PP increases morbidity and mortality in patients with diabetes. Given the high prevalence of overweight and obesity in the Mexican population, this study aimed to describe the magnitudes and the distribution of the PP observed in a sample of newly diagnosed patients with diabetes, adjusting for body mass index (BMI) groups (normal weight, overweight, grade I obesity, and grade II and III obesity).
Materials and methodsA total of 250 volunteers attending a comprehensive care program for the management of type 2 diabetes received foot assessments that included vascular and neurological evaluation, the identification of musculoskeletal changes, and measurements of PP.
ResultsDiabetic neuropathy and peripheral arterial disease were present in 21.6% and 11.2% of all participants. Musculoskeletal alterations were present in 70.8% of participants. A positive and significant correlation (p<0.001) was observed between BMI and the peak PP of all anatomical regions assessed. After adjusting for BMI, significant differences (p<0.001) were seen between groups. The metatarsal region, particularly under the third metatarsal head, denoted the highest magnitudes across all BMI.
ConclusionsPeriodic PP assessment is recommended to identify the distribution of high-pressure points along the plantar surface. However, as a preventive measure, it is suggested to encourage patients with diabetes and overweight or obesity to wear appropriate footwear and pressure-relief insoles to relieve high-pressure areas – often seen in these populations – to help prevent foot complications.
La presión plantar (PP) elevada constituye un factor de riesgo para desarrollar úlceras en el pie, aumento de la morbilidad y la mortalidad en los pacientes con diabetes. Dada la alta prevalencia de sobrepeso y obesidad en la población mexicana, este estudio tuvo como objetivo describir las magnitudes y la distribución de la PP observada en una muestra de pacientes recién diagnosticados con diabetes, ajustando por grupo de índice de masa corporal (IMC): normopeso, sobrepeso, obesidad grado I, y obesidad grados II y III.
Materiales y métodosAsistieron 250 voluntarios a un programa de atención integral para el manejo de la diabetes tipo 2, recibieron evaluaciones de los pies que incluyeron: evaluación vascular, neurológica, de alteraciones musculoesqueléticas y de la PP.
ResultadosLa neuropatía diabética y la enfermedad arterial periférica estuvieron presentes en el 21,6% y el 11,2% de los participantes. Las alteraciones músculoesqueléticas estuvieron presentes en el 70,8% de los participantes. Se observó una correlación positiva y significativa (p<0,001) entre el IMC y la PP máxima de todas las regiones anatómicas evaluadas. Después de ajustar por el IMC, se observaron diferencias significativas (p<0,001) entre los grupos. La región metatarsiana, particularmente debajo de la cabeza del tercer metatarsiano, denotó las magnitudes más altas en todas las categorías del IMC.
ConclusionesSe recomienda una evaluación periódica de la PP para identificar la distribución de los puntos de alta presión plantar. Sin embargo, como medida preventiva, se sugiere alentar a los pacientes con diabetes y sobrepeso u obesidad a utilizar calzado adecuado y plantillas para descargar las zonas de alta presión para prevenir complicaciones en los pies.
Diabetic foot, a condition related to neurological, vascular, dermatological, metabolic, and musculoskeletal disorders, is defined by the World Health Organization (WHO) as a disease in which “neuropathy, ischemia, and infection lead to tissue disruption causing morbidity and possible amputation”.1 A common complication of this condition is foot ulcers, which could lead to lower limb amputations, with worldwide prevalences of 4% up to 10% and 15% up to 25%, respectively.2,3 In the Mexican population, these prevalences are 7% and 1.7%, respectively.4
Peripheral arterial disease (PAD) and distal neuropathy (DN) have been identified as factors that may contribute to the development of ulcers. PAD may affect local blood perfusion, and distal neuropathy leads to the eventual loss of protective sensibility. These promote the appearance of changes to the foot morphology that contribute to the increase of plantar pressure at the forefoot.5 Deformities, such as longitudinal arch collapse, hallux valgus, and hammer toes promote the exposure of the heads and increase the pressure underneath them.6,7 Connective and soft tissue glycation promotes biomechanical changes that make the forefoot prone to injuries since its thickness is 36% up to 48% thinner vs the one seen in the heel.8–11
Since it has been described that in the diabetic foot, the highest values of plantar pressure are usually located right to the site of the ulcer, its assessment has been recommended as a valuable method to identify and reduce the risk of ulceration and subsequent amputation of the lower limb in patients with diabetes.12–14 An ulceration pathway has been described through the interaction of elevated PP, constant mechanical stress in the plantar tissue, and neuropathy.15–17
In Mexico, the high prevalence of overweight (39.1%) and obesity (36.1%) has become a problem of public health4 in addition to diabetes. Since people with obesity (BMI ≥30kg/m2) frequently denote increased PP at the midfoot and metatarsal regions,18,19 this study aimed to describe the PP figures adjusted by body mass index (BMI) that were present in a sample of early-diagnosed volunteers with type 2 diabetes.
Materials and methodsStudy designWe conducted a descriptive and cross-sectional study, nested in the cohort of the protocol entitled “Validation of a comprehensive management model for patients with type 2 diabetes” in CAIPaDi (Spanish acronym for Center for the Comprehensive Management of Patients with Diabetes) of the National Institute of Medical Sciences and Nutrition Salvador Zubirán in Mexico City. The center Ethics and Research Committees (ref 1198) approved the protocol which has been registered in ClinicalTrials.gov: NCT0283608. The multidisciplinary program includes four initial monthly visits and two annual follow-up assessments that aim to achieve metabolic control goals.20,21
The above-mentioned program establishes the following inclusion criteria: patients with type 2 diabetes diagnosed less than five years ago, age between 18 and 70 years, non-smoking habit, and with no disabling complications such as lower limb amputation or those that require the use of some type of support device to walk that could modify pressure measurement. During each visit, the participant is assessed by professionals from nine different disciplines: endocrinology, diabetes education, nutrition, psychology, dentistry, psychiatry, physical therapy, ophthalmology, and foot care.
Foot care intervention involves dermatological, neurological, and vascular evaluations to determine the health condition of the foot and the quantitative evaluation of the plantar pressure for the identification of abnormal pressure points, which constitutes the subject matter of this study.
Data collectionAll patients with complete health records, glycated hemoglobin, lipid profile, and blood pressure measurements were included. Anthropometric parameters included BMI and body composition. BMI was classified as normal weight (18.5–24.9kg/m2), overweight (25–29.9kg/m2), grade I obesity (30–34.9kg/m2), and grade II and III obesity (35.0–44.9kg/m2).
A physical assessment of the skin and nails was performed on both feet. Onychomycosis, onychocryptosis, and plantar hyperkeratosis were classified as present or absent. The neurological evaluation was performed using the 128-Hz tuning fork test and the 10g Semmes–Weinstein monofilament to confirm the perception of vibration and pressure, respectively. The loss of perception to vibration (LVS) was considered if the patient stopped perceiving the stimulus in <8s. Loss of pressure sensation (LPS) was confirmed if the patient reported not perceiving the stimulus in 5 or more of the 10 evaluated anatomical points. DN was assumed when the patient tested positive to either one or the two tests.5,21 The vascular condition was also evaluated using the ankle-brachial index (ABI). PAD was considered with an ABI <0.9.22 Finally, musculoskeletal alterations were recorded through physical examination of both feet and legs and plantar footprint. Pes cavus, claw toes, hallux valgus, fallen plantar arch, talus valgus or varus and genu valgus or varus were evaluated.23–26
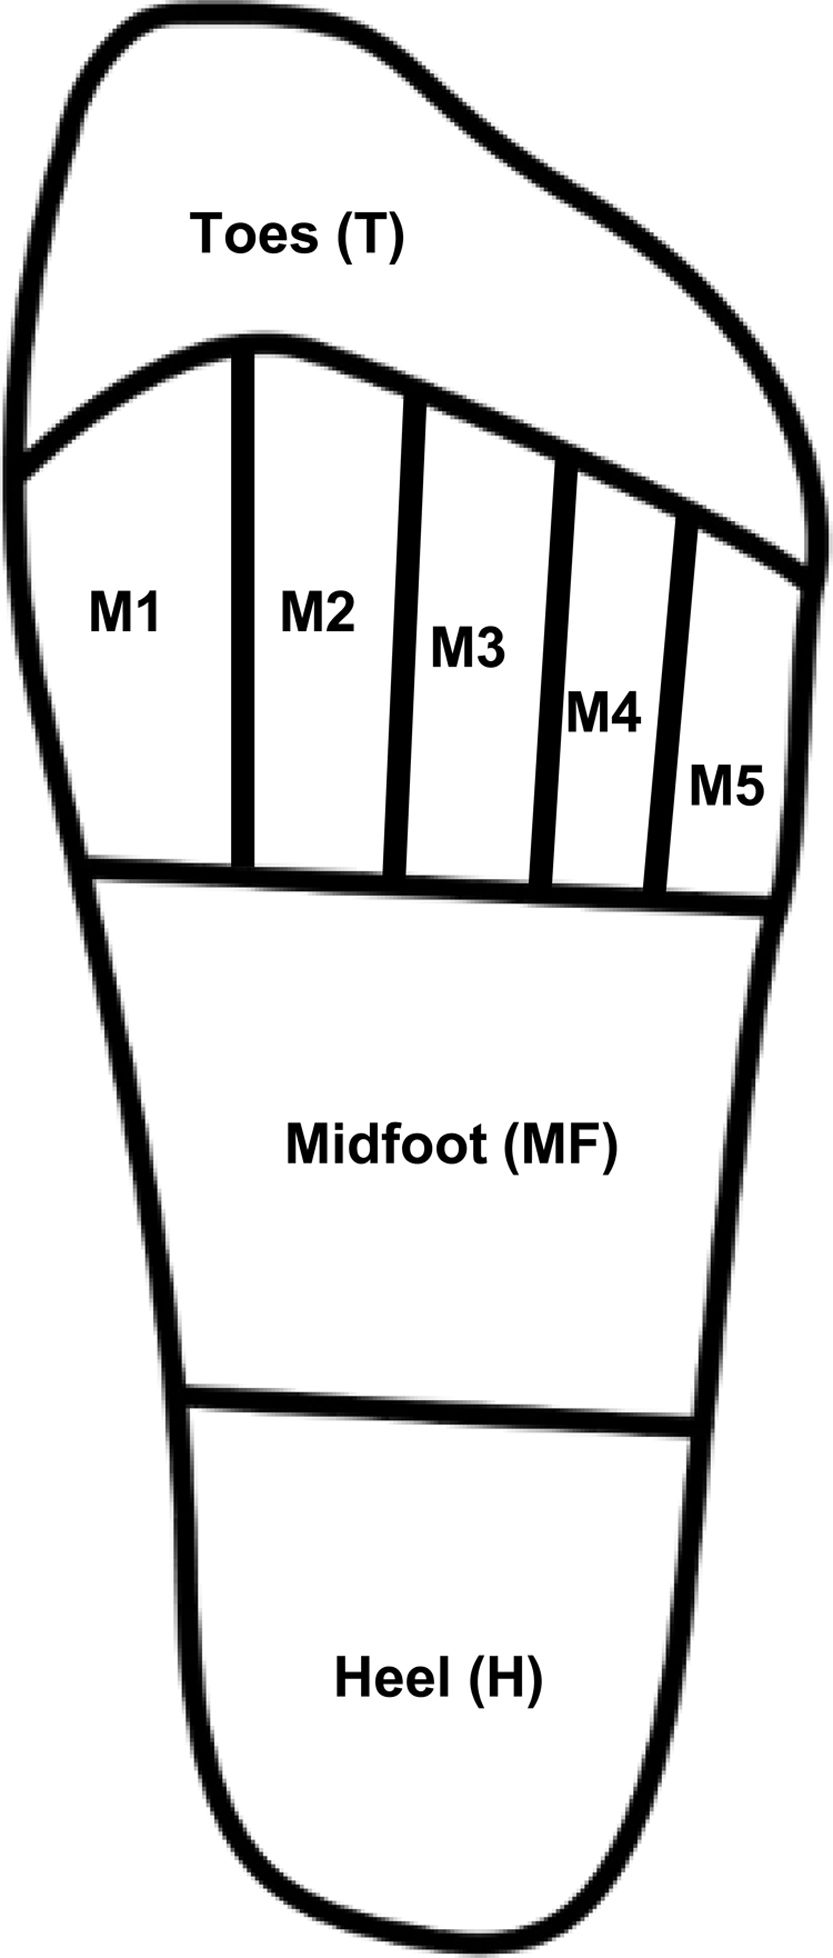
Plantar pressure measurementsBaropodometric techniques enable the qualitative and quantitative assessment of PP, either statically or during the gait cycle, and are useful to timely identify high-pressure zones and prevent plantar ulcer formation.17,27 Assessments included peak plantar pressure (PPP) mean values for the anatomical regions of the foot (Fig. 1), which included the hallux and lesser toes (T), the area comprised under each metatarsal head (M1, M2, M3, M4, and M5), the metatarsal region as a whole (MT), the midfoot (MF), and the heel region (H). Pressure–time integral (PTI) was computed for regions with the highest PPP value. A MatScan platform and the FootMat Research software (ver. 7.00-65) by Tekscan (Boston, MA, United States) were used to acquire and analyze plantar pressure registries.

Before PP assessment, the equipment was calibrated with the patient's weight following the manufacturer's instructions. Afterwards, the participants were asked to walk barefoot and at a self-selected speed through the gait pathway to become familiar with the procedure before being measured. A mean of five footprints for each foot was considered for analysis.
Statistical analysisThe sociodemographic variables were expressed as mean and standard deviation or median and range or prevalence. The normality of data was assessed using the Kolmogorov–Smirnov test. The mean values of the variables of interest were compared using a one-way ANOVA test. Post hoc analysis was conducted with Fisher's least significant difference (LSD) when significant differences were observed, and the Student t tests was used for comparison purposes. The Pearson correlation test was used to assess the association between continuous variables and the chi square test was used to investigate the association among discrete variables. Statistical significance was assumed at p<0.05. Data analysis was performed with the SPSS statistical package (IBM, version 21).
Data and resource availabilityThe data and resources are available upon request to the corresponding author.
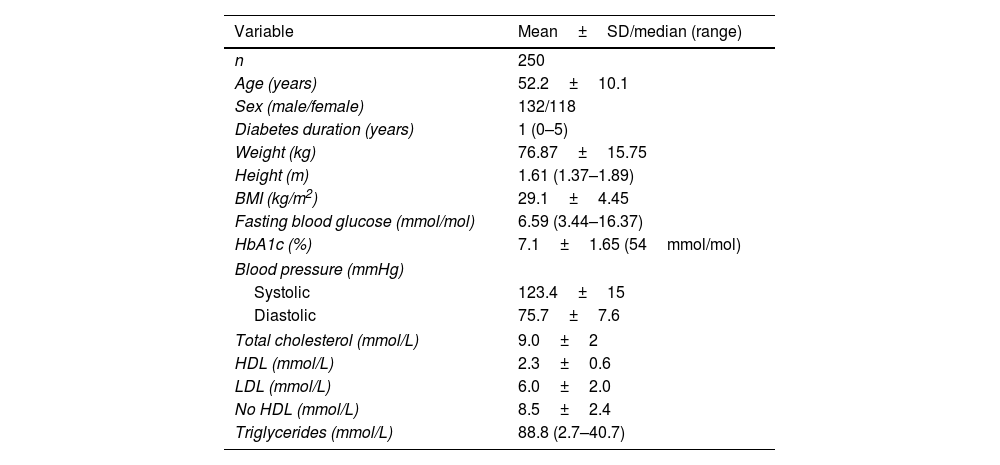
ResultsFrom February 2015 through January 2016, a sample of 250 patients (500 feet) was recruited: 132 women and 118 men, with a mean age of 52±0.1 years and a median history of diabetes of 1 year (0–5). The sociodemographic data and biochemical characteristics of the participants are shown in Table 1.
Demographic characteristics and biochemical markers of participants.
| Variable | Mean±SD/median (range) |
|---|---|
| n | 250 |
| Age (years) | 52.2±10.1 |
| Sex (male/female) | 132/118 |
| Diabetes duration (years) | 1 (0–5) |
| Weight (kg) | 76.87±15.75 |
| Height (m) | 1.61 (1.37–1.89) |
| BMI (kg/m2) | 29.1±4.45 |
| Fasting blood glucose (mmol/mol) | 6.59 (3.44–16.37) |
| HbA1c (%) | 7.1±1.65 (54mmol/mol) |
| Blood pressure (mmHg) | |
| Systolic | 123.4±15 |
| Diastolic | 75.7±7.6 |
| Total cholesterol (mmol/L) | 9.0±2 |
| HDL (mmol/L) | 2.3±0.6 |
| LDL (mmol/L) | 6.0±2.0 |
| No HDL (mmol/L) | 8.5±2.4 |
| Triglycerides (mmol/L) | 88.8 (2.7–40.7) |
BMI, body mass index; HbA1c, glycosylated hemoglobin; HDL, high-density lipoprotein; LDL, low-density lipoprotein.
Based on the physical examination of both feet, these were the prevalences of the following conditions: DN (21.6%), musculoskeletal alterations (at least one of the following: hallux valgus, flat foot, claw toes, pes cavus, talus valgus/varus, heel spur, genu valgus/varus) (70.8%), PAD (9.5%), and hyperkeratosis (45.2%). Furthermore, to identify an association between the latter and the increment of PPP, hyperkeratosis interquartile prevalence was determined resulting as follows: 1st quartile 38.7% (n=124), 2nd quartile 38.6% (n=114), 3rd quartile 46.7% (n=122) and 4th quartile 47.5% (n=120) (p=0.319). The presence of ulcers or amputation of foot segments was not reported.
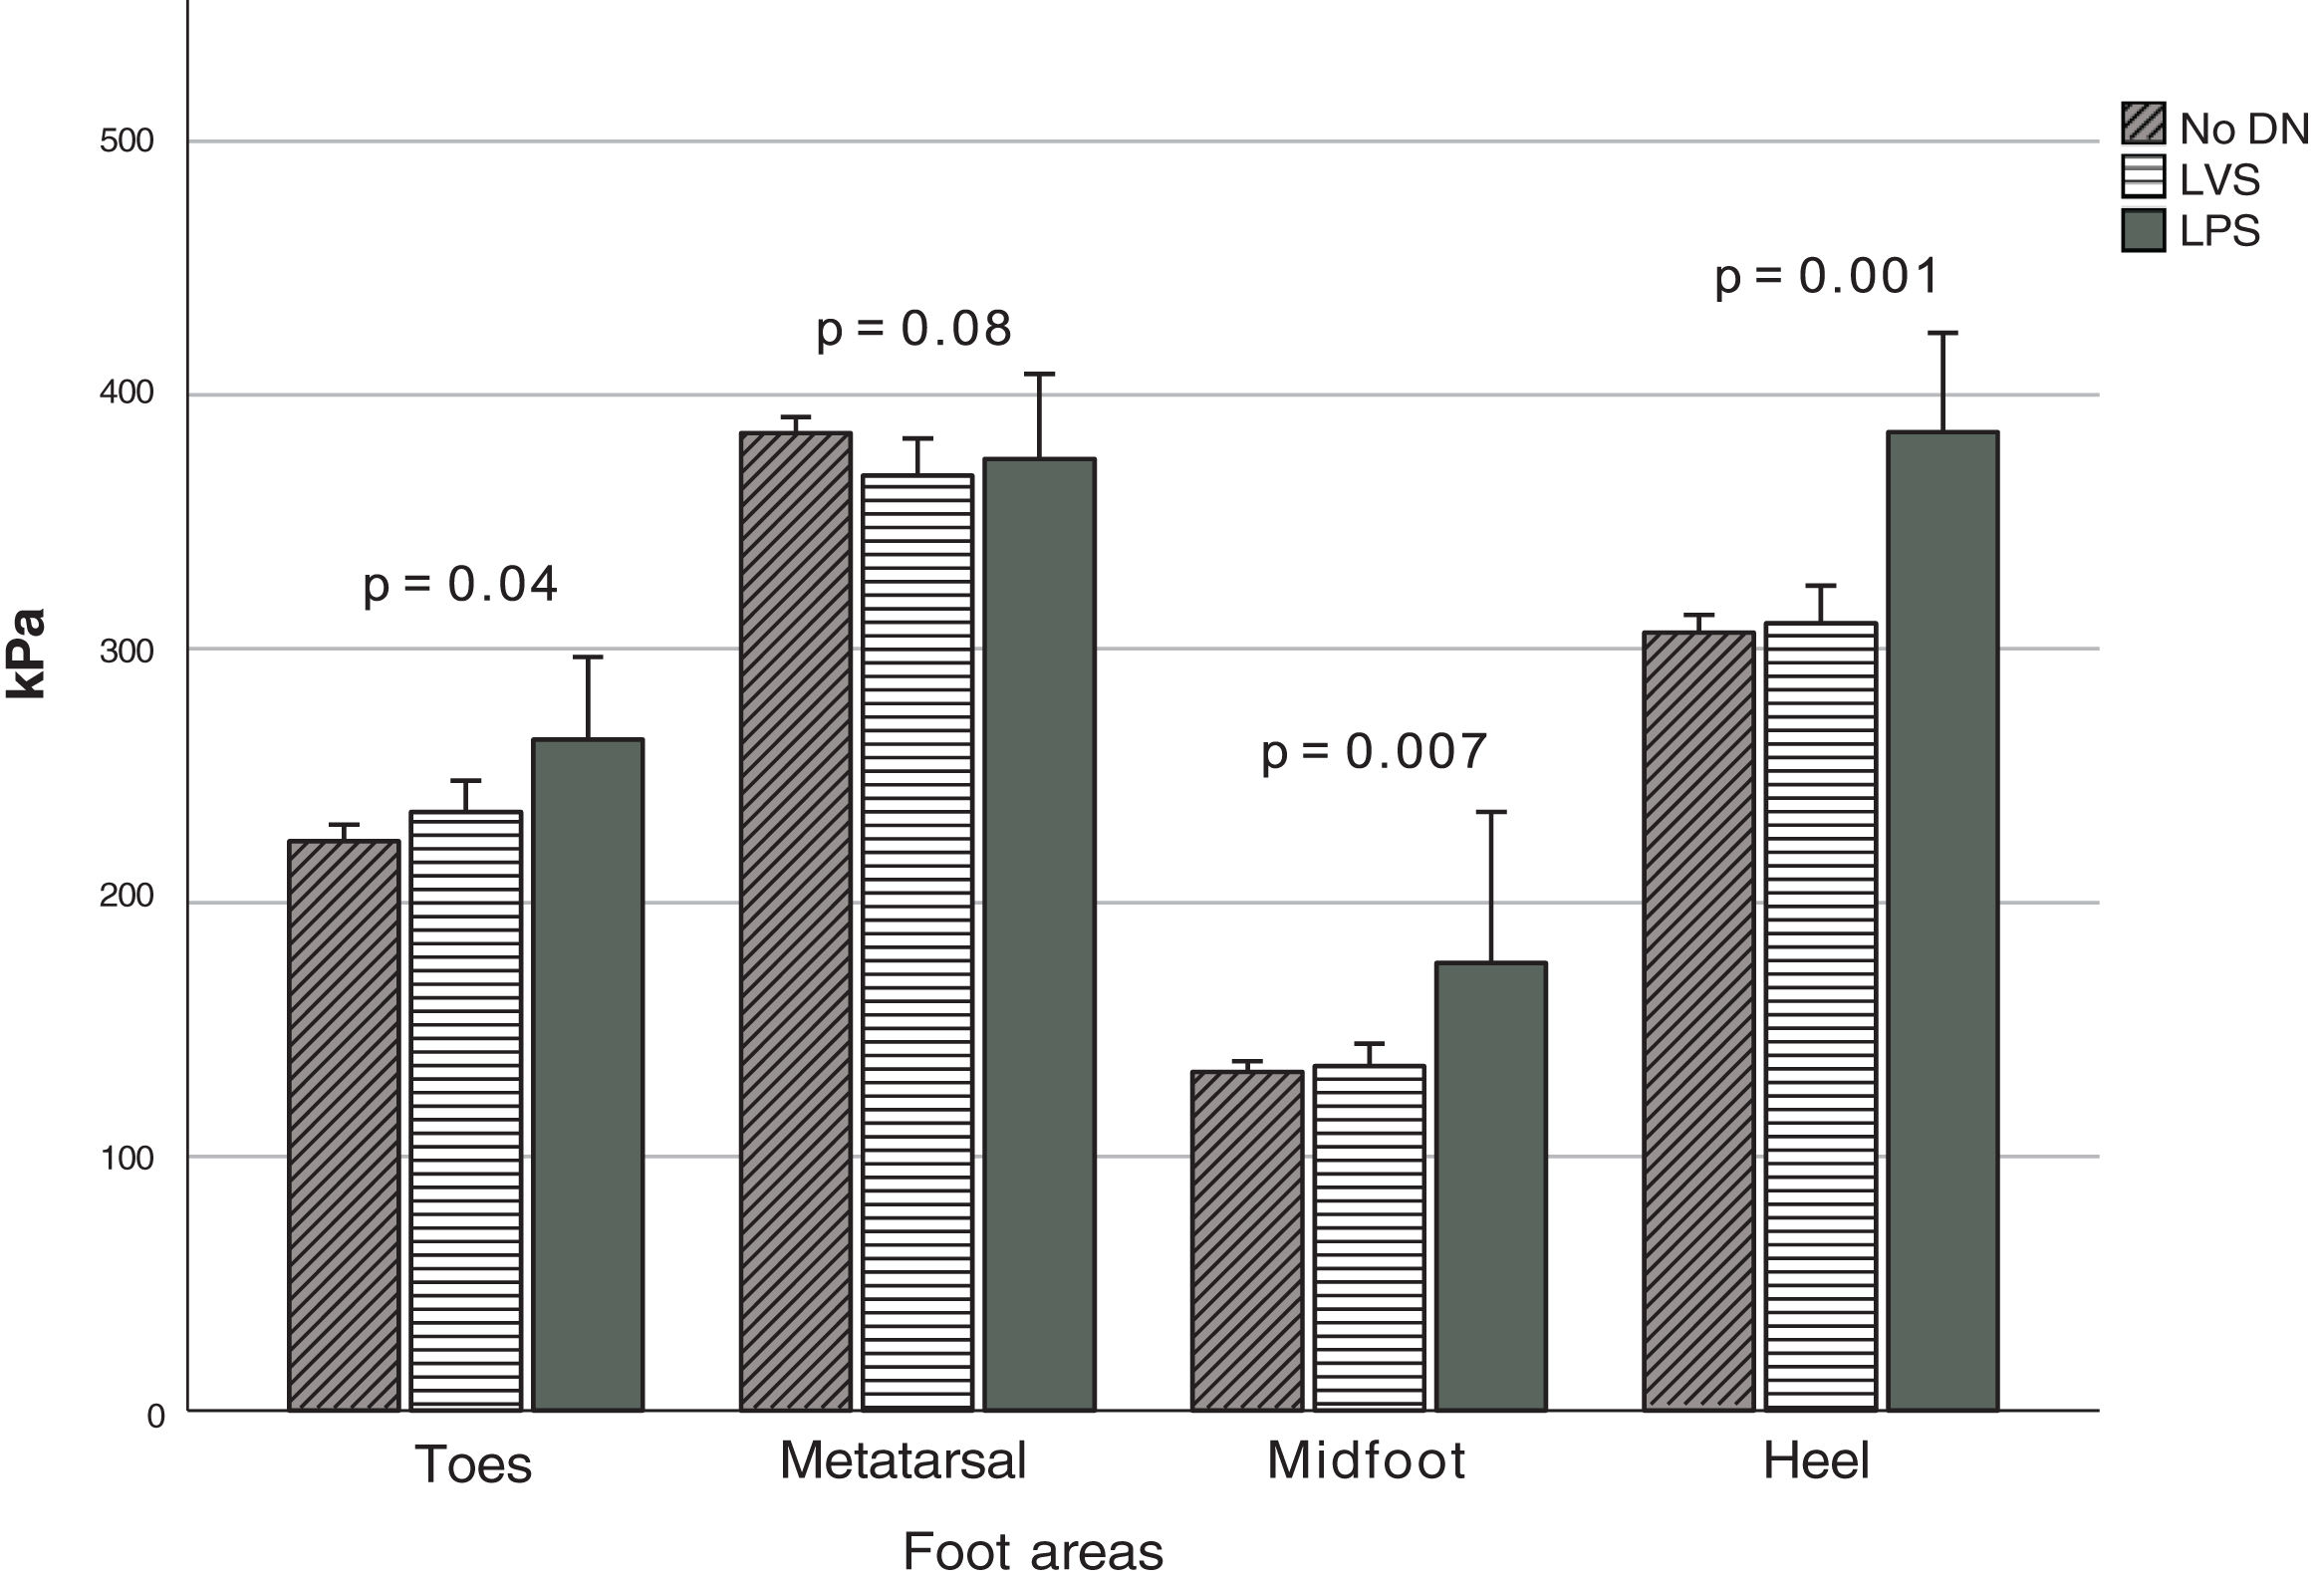
Fig. 2 depicts the PPP stratified based on the type of DN when detected, which was observed at the anatomical regions (Fig. 1). Significant differences were seen in the MF (p=0.007), T (p=0.04), and H (p=0.001) zones. Based on the Fisher's LSD test, post hoc analysis revealed that the LPS group showed significantly higher PPP values in the heel region with a mean of 385.5kPa (p=0.001 and p<0.001, vs the LVS and no DN group, respectively), followed by the region comprising the hallux and lesser toes with 264.4kPa. It differed significantly from the group without DN (p=0.04) but not from the LVS group. Furthermore, elevated figures of up to 176.4kPa were reported in the midfoot region, which was statistically different from those with LVS (p=0.004) and no DN (p=0.002). The MT region (M1–M5 considered simultaneously) denoted the highest PPP magnitudes in 80% of all cases, but no statistical differences were seen in the group (p=0.08). The computed mean PTI observed at this anatomical region (MT) in participants with no DN was 93.4±24.2kPa/s, while in those with LVS and LPS, it was 93.1±31.5kPa/s and 90.8±34.8kPa/s, respectively. No statistical differences were found between these figures (p=0.94).

Peak PP distribution based on the type of diabetic neuropathy. Abbreviations: No DN, nondiabetic neuropathy present; LVS, loss of vibration sensation; LPS, loss of pressure sensation; MT, metatarsal region; MF, midfoot region. The figure shows the PPP values at the four indicated regions when each type of neuropathy is present.
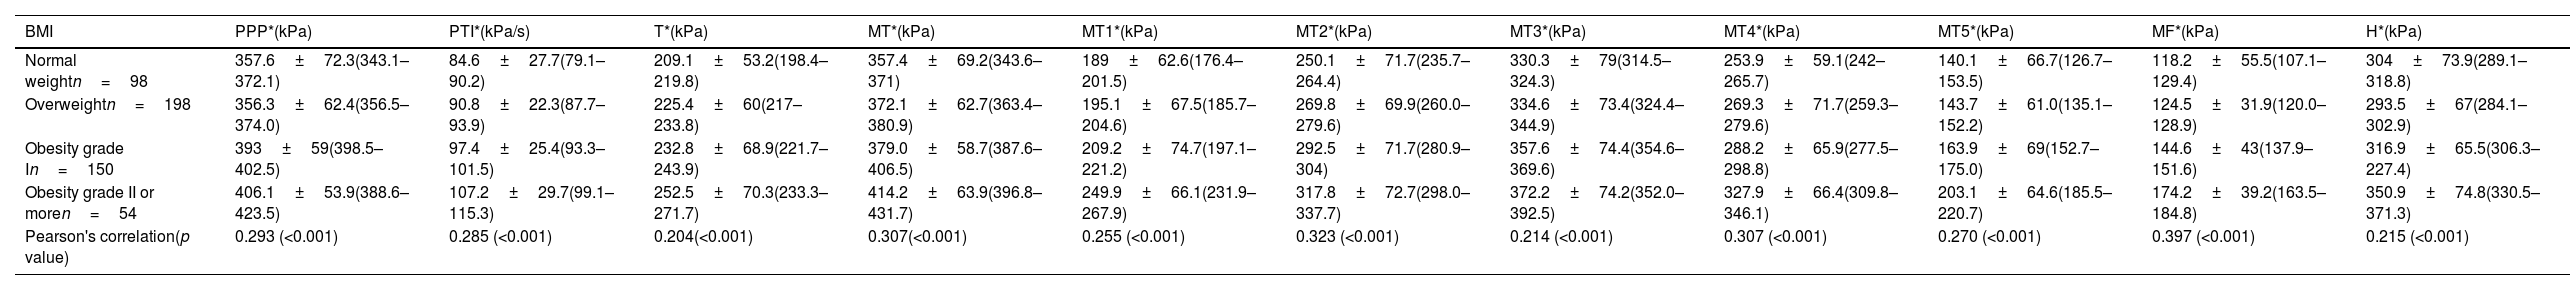
When adjusting for BMI, the highest magnitudes of the mean PPP were also found in the MT (M1–M5) region at the following rates: 83.7% in the normal-weight group, 85.0% in the overweight group, 77.3% in the grade I obesity group, and 77.7% in the grade II obesity group (Table 2). The third metatarsal head consistently presented the highest values, exceeding 300kPa in the four groups.
PPP distributed by anatomical region and stratified based on BMI.
| BMI | PPP*(kPa) | PTI*(kPa/s) | T*(kPa) | MT*(kPa) | MT1*(kPa) | MT2*(kPa) | MT3*(kPa) | MT4*(kPa) | MT5*(kPa) | MF*(kPa) | H*(kPa) |
|---|---|---|---|---|---|---|---|---|---|---|---|
| Normal weightn=98 | 357.6±72.3(343.1–372.1) | 84.6±27.7(79.1–90.2) | 209.1±53.2(198.4–219.8) | 357.4±69.2(343.6–371) | 189±62.6(176.4–201.5) | 250.1±71.7(235.7–264.4) | 330.3±79(314.5–324.3) | 253.9±59.1(242–265.7) | 140.1±66.7(126.7–153.5) | 118.2±55.5(107.1–129.4) | 304±73.9(289.1–318.8) |
| Overweightn=198 | 356.3±62.4(356.5–374.0) | 90.8±22.3(87.7–93.9) | 225.4±60(217–233.8) | 372.1±62.7(363.4–380.9) | 195.1±67.5(185.7–204.6) | 269.8±69.9(260.0–279.6) | 334.6±73.4(324.4–344.9) | 269.3±71.7(259.3–279.6) | 143.7±61.0(135.1–152.2) | 124.5±31.9(120.0–128.9) | 293.5±67(284.1–302.9) |
| Obesity grade In=150 | 393±59(398.5–402.5) | 97.4±25.4(93.3–101.5) | 232.8±68.9(221.7–243.9) | 379.0±58.7(387.6–406.5) | 209.2±74.7(197.1–221.2) | 292.5±71.7(280.9–304) | 357.6±74.4(354.6–369.6) | 288.2±65.9(277.5–298.8) | 163.9±69(152.7–175.0) | 144.6±43(137.9–151.6) | 316.9±65.5(306.3–227.4) |
| Obesity grade II or moren=54 | 406.1±53.9(388.6–423.5) | 107.2±29.7(99.1–115.3) | 252.5±70.3(233.3–271.7) | 414.2±63.9(396.8–431.7) | 249.9±66.1(231.9–267.9) | 317.8±72.7(298.0–337.7) | 372.2±74.2(352.0–392.5) | 327.9±66.4(309.8–346.1) | 203.1±64.6(185.5–220.7) | 174.2±39.2(163.5–184.8) | 350.9±74.8(330.5–371.3) |
| Pearson's correlation(p value) | 0.293 (<0.001) | 0.285 (<0.001) | 0.204(<0.001) | 0.307(<0.001) | 0.255 (<0.001) | 0.323 (<0.001) | 0.214 (<0.001) | 0.307 (<0.001) | 0.270 (<0.001) | 0.397 (<0.001) | 0.215 (<0.001) |
Values expressed as mean±SD (95% confidence interval). PPP, absolute peak plantar pressure; PTI, pressure–time integral; MT, metatarsal region; MT1–MT5, areas comprised beneath 1st–5th metatarsal heads; MF, midfoot region; H, heel region; Pearson's correlation denotes the association between pressure and BMI of each one. Significance level: p<0.05.
Between the BMI groups/categories, significant differences were observed in all the plantar pressure variables studied, and positive, moderate, and significant correlations (p<0.001) were found between the mean PPP of all analyzed regions of the foot and the BMI (Table 2). No statistical differences were found among study variables when gender was used for comparison purposes within BMI groups.
Finally, PPP denoted its highest values along the entire plantar surface when these alignment conditions were found: ankle varus (369.0kPa), ankle valgus (387.8kPa), and genu valgum (388.0kPa). Similarly, PTI reached its highest figures when claw toes (99.2kPa/s), pes cavus (98.0kPa/s), or ankle varus (95.9kPa/s) were observed.
DiscussionIn Mexico, the prevalence of overweight, obesity, and diabetes has reached a level of national concern. Diabetes often appears concomitantly with one of these first two conditions. Since it has been reported that the presence of high PP values may be associated with ulceration, especially when distal neuropathy is present, we considered it relevant to describe the magnitudes and distribution pattern of the PP present across BMI categories in a sample of volunteers with diabetes.
Previous studies have reported increased PP scores as body weight increases.28 In a population of older adults, body weight was a significant and independent predictor of most plantar load variables and could account for up to 16% of the variance of the PPP. Additionally, out of a sample of patients with obesity,18,28 some authors reported that the midfoot area reported statistically significantly higher PPP when compared with normal body weight figures. They attributed this to the collapse of the longitudinal arch due to the sustained and increased impact forces associated with excessive weight. Our results were consistent with these findings, and a significant increase was detected between normal and obese participants in the midfoot (MF) area (p<0.001).
Arnold et al. simulated overweight in the study population by adding 10 and 15kg to each participant's body weight.19 They demonstrated a significant increase (p<0.01) in the PPP below the calcaneal region and the 2nd through 5th metatarsal heads for each loading condition.19 Our study observed a significant increment underneath the five metatarsal heads between these groups (normal and overweight). An increasing trend persists throughout the rest of the groups (obesity grade I and grade II or more) as supported by the positive and significant correlation (p<0.001) observed.
Alternatively, and to complement the findings described above, Robinson et al. reported that volunteers with prediabetes and diabetes were prone to show significantly higher pressure levels (p=0.01) and augmented PTI values (p<0.001) in the metatarsal region vs those participants without diabetes.29 In our study, PTI was not computed for each anatomical region. However, global PTI denoted a slight but positive correlation as weight increased (r=0.25, p<0.001) and was significantly higher in those participants with obesity.
A prevalent concern among clinicians is determining an ulceration cut-off point regarding PP figures. Some ulceration risk cut-off points have already been proposed, but a consensus has not yet been reached. Reported PPP figures may range from 348.6 up to 821.0kPa from volunteers who walk barefoot and with ulcers. However, in a more comprehensive approach, Fawzy et al. suggested a cut-off point of 355kPa in the mean PPP of the forefoot to indicate a high risk for ulceration.16 They further clarify that this proposed figure validity may be strengthened when used along with other contributing risk factors, such as the duration of diabetes, smoking habit, blood glucose levels, degree of foot deformity, and the presence of peripheral neuropathy.
Although we must be cautious when generalizing the above results to other populations, in our study, the overall mean PPP was 376.5kPa, placing it at the lower limit of the above range. It must be outstated that the studied population did not present positive smoking habits and mainly stood within the metabolic control goal.
In our study, the mean PPP observed (376.5kPa) was above the proposed cut-off point, even in volunteers without DN (384.6kPa) and in those within the normal weight range (357.4kPa). However, the low prevalence of DN observed, the short evolution of diabetes, and the absence of smoking habits in our study population should be pointed out and may contribute to our findings.
Being consistent with other studies, the PTI was recorded. No significant differences were observed regarding the PTI between the groups with and without DN (p=0.93). Various findings have been made surrounding the PTI. In a meta-analysis, Fernando et al. reported that in patients with diabetic peripheral neuropathy, the PTI was higher when ulceration was present.30 In a systematic review, Bus et al. stated that this parameter would not be more effective than PPP in predicting the appearance of ulcers.31
Although our results were not significant (p=0.18), they reported higher PPP figures in patients with altered sensitivity. No significant differences were seen in the PTI between the groups with and without DN (p=0.94). However, a growing trend was observed in those groups with altered sensitivity. In a recent study by Bartolo et al., when evaluating PPP and PTI in groups of patients without DN, with DN, and with a history or current neuropathic ulcer, minimal significant changes were seen in the PPP between the ulcerated and non-ulcerated groups. However, the PTI values increased significantly in the ulcerated groups in all regions of plantar ulceration.32 Logistic regression testing demonstrated that as PTIs under the hallux increase, the likelihood that an individual living with DN will develop ulceration increases.32 This study proposes the PTI as a clinical tool for evaluating high-risk diabetic foot, so it could be important to pay attention to this parameter in patients with higher BMI since, according to our own results, the PTI is higher in overweight and obesity groups.
Studies that subdivided the footprint into delimited anatomical regions for analysis report that the area most often denotes the highest PPP values can be found under the 3rd metatarsal head.18,33 Our findings were consistent with former reports: mean PPP values were persistently elevated in the metatarsal region and particularly underneath the 3rd metatarsal head across all BMI categories (330.3–372.2kPa). From grade I obesity onwards, the values at the above-mentioned site exceeded the value proposed by Fawzy et al. as a cut-off point for ulceration risk (355kPa).16
Finally, although not statistically significant, in this study an upward trend in the prevalence of hyperkeratosis was seen as the magnitude of PPP increased; however, a significant and positive correlation of PP with BMI was identified. Recently, in a systematic review and meta-analyses in which hyperkeratosis was classified as a pre-ulcerative sign, van Netten et al. reported that if treated (callus removal), a slight but immediate reduction of in-shoe and barefoot PP may be attained. This group of researchers also pointed out that the use of pressure-optimized therapeutic footwear/insoles vs standard therapeutic footwear/insoles might reduce the risk of plantar ulceration.33 These facts are relevant to health care professionals in the sense that an assessment of the presence of hyperkeratosis at the foot and of the type of footwear a patient uses can easily be performed without the need for sophisticated technology.
According to our findings, a recommendation for clinicians is to pay special attention to individuals with early-diagnosed diabetes who are presently in the range of overweight or obesity, regardless of their metabolic control. Management of elevated pressure at the studied sites can be done via the recommendation of adequate footwear (wide and square-shaped tip) and customized and total-contact-adapted insoles. Early management of hyper-pressure points in the central forefoot region and midfoot may prevent future foot complications, especially in individuals with neuropathy.
A limitation of this study is that the reported PP figures should be taken with caution as a reference to extrapolate to other populations that may not have such a short duration of diabetes, a positive smoking habit, or adequate metabolic control. These were distinctive characteristics of our sample. As Fawzy et al. proposed, these, among other factors, may increase ulceration risk.16 Another limitation of our study is that the foot size of the participants was not considered for the analysis, given that foot size commonly determines plantar area, which may affect PP. Also, in this study the presence, or not, of hyperkeratosis was registered, but when present, its location was not described. This knowledge is relevant in the sense that hyperkeratosis implies a noticeable punctual increase in pressure.
Future lines of research should include the study of the association between the presence and distribution of hyperkeratosis with pressure, as a potential factor in triggering the appearance of ulcers. Additionally, more prospective and survival analysis studies evaluating plantar pressure over time are needed to accurately determine cut-off points that can alert clinicians about the presence of high-risk pressure levels that may lead to the development of plantar ulcers, given the presence of other factors.
This study is an initial effort to evaluate baropodometric data in a large number of Mexican patients recently diagnosed with type 2 diabetes and describes its PP distribution pattern. These findings may be useful to health care workers who assist people with diabetes to pay special attention to those who are within the BMI ranges of obesity and overweight, to implement rigorous foot care measures and recommend to them the use of appropriate footwear/pressure-relief insoles that helps reduce the risk of ulceration.
ConclusionsThis study included a population with a low prevalence of diabetic neuropathy and peripheral arterial disease, with a relatively short course of the disease. The PP variables studied denoted a generalized increase in the different anatomical regions of the foot as the BMI increased. The highest pressure levels recorded were consistently present in the central forefoot (3rd metatarsal head). In patients with overweight and obesity, pressure approached or exceeded the levels proposed as safe to avoid ulceration. However, they did not present aggregate factors (evolution time, smoking) that may contribute to increased ulceration risk. Based on these findings, early intervention to raise awareness – especially in patients with overweight and obesity – about the use of appropriate footwear and insoles to manage high-pressure points would be advisable to reduce the risk of foot ulcers.
Key findings- •
Different changes evaluated in the feet of patients with newly diagnosed type 2 diabetes turn out to be prevalent, mainly deformities and plantar hyperkeratosis.
- •
The area that denotes the highest plantar pressure values during the gait cycle is below the metatarsal region.
- •
Higher figures of plantar pressures were recorded on the third metatarsals and heel region in people with overweight and obesity.
The CAIPaDi program has received funding from Astra Zeneca, Fundación Conde de Valenciana, Novartis, The National Council of Science and Technology (CONACyT: 214718), Nutrición Médica y Tecnología, Novo Nordisk, Boehringer Ingelheim, Dirección General de Calidad y Educación en Salud, Eli Lilly, Merck Serono, MSD, Silanes, Chinoin and Instituto de Salud Carlos Slim.
Conflicts of interestNone declared.
We wish to thank the following contributors: María Teresa Alcántara-Garcés, Denise Arcila-Martínez, Rodrigo Arizmendi-Rodríguez, Humberto Del Valle-Ramírez, Arturo Flores García, Eduardo González-Flores, Mariana Granados-Arcos, Arely Hernández Jasso, Diana Hernández Juárez, María Victoria Landa-Anell, Claudia Lechuga-Fonseca, Marco Antonio Melgarejo-Hernández, Valeria Miranda Gil, Angélica Palacios-Vargas, Liliana Pérez-Peralta, Sofía Ríos-Villavicencio, David Rivera de la Parra, Alejandra Rodríguez-Ramírez, Sandra Sainos-Muñoz, Nancy Serrano-Pérez, Héctor Velázquez-Jurado, Andrea Villegas-Narváez, Luz Elena Urbina-Arronte, Verónica Zurita-Cortés, Carlos A. Aguilar-Salinas, Francisco J. Gómez-Pérez, and David Kershenobich-Stalnikowitz.
