


The aim of this study was to analyze the body weight satisfaction and the diet quality in a group of female university students and to assess the differences between degrees in different fields of knowledge. Participants were 47 women volunteers classified as normal weight, 29 from the degree in Human Nutrition and Dietetics and 18 from the degree in Social Work. Dietary intake was evaluated by a validated food frequency questionnaire. This information was used to estimate the Diet Quality Index. Recalled weight and desired weight were used to measure weight satisfaction. Furthermore, lifestyle variables were registered. Data were analyzed using SPSS vs 17.0. The proportion of students who were satisfied with their body weight was 27.7%, 57.4% were dissatisfied and 14.9% very dissatisfied. Differences between degree courses were not found in weight satisfaction classification. The mean Diet Quality Index was 38.5±6.7, and 83% of participants had a diet classified as “needs to improve”. Human Nutrition and Dietetics students had higher Diet Quality Index scores (41.5±5.1) than Social Work students (33.7±6.5) (p<0.001). In conclusion, a large proportion of participants were dissatisfied with their body weight and they wished to weigh less than current weight values. It seems that the knowledge of nutrition affects university student participants’ food practice, but this is not enough to achieve a healthy diet and to reduce their body dissatisfaction.
El objetivo del estudio fue evaluar la satisfacción con el peso corporal y la calidad de la dieta en un grupo de estudiantes universitarias, y analizar las diferencias entre titulaciones de distintos ámbitos de conocimiento. La muestra estuvo formada por 47 mujeres voluntarias clasificadas como normopeso, 29 de la Diplomatura en Nutrición Humana y Dietética y 18 de Trabajo Social. La ingesta dietética se valoró con un cuestionario de frecuencias de consumo validado y a partir de estos datos se calculó el Índice de Calidad de la Dieta. Para evaluar la satisfacción con el peso corporal se utilizó el peso autodeclarado y el deseado. Además, se registraron datos sobre estilo de vida. Los resultados se analizaron con el programa estadístico SPSS V. 17.0. El 27,7% de las participantes estaban satisfechas con su peso corporal, el 57,4% insatisfechas y el 14,9% muy insatisfechas. No se registraron diferencias significativas entre grupos en la insatisfacción con el peso corporal. La puntuación media para el Índice de Calidad de la Dieta fue de 38,5±6,7 y el 83% de las participantes presentaba una dieta clasificada como «necesita mejorar». Las estudiantes de Nutrición obtuvieron mayores puntuaciones para el Índice de Calidad de la Dieta (41,5±5,1) que las de Trabajo Social (33,7±6,5) (p<0,001). En conclusión, un elevado porcentaje de las participantes se sentían insatisfechas con su peso corporal y deseaba pesar menos. Al parecer, los conocimientos de las estudiantes de Nutrición participantes repercuten en su práctica alimentaria, pero no son suficientes para conseguir una dieta saludable y reducir su insatisfacción corporal.
Some population groups, notably young women, are subject to great social pressure which imposes an esthetic model of extreme thinness.1 The ever-increasing importance of image, more particularly of a thin image, has contributed to both the dissatisfaction of people in general with their bodies and an increase in behavior aimed at losing weight and changing body shape.2
Body dissatisfaction is associated with depressive symptoms, stress, and decreased self-esteem, and promotes unhealthy dietary practices. These are risk factors for the development of eating disorders.3 However, eating behavior does not only depend on bodily satisfaction. There are many factors involved in dietary habits. As individuals acquire the autonomy to decide on meals and mealtimes, social, cultural, and economic factors, in addition to food preferences, contribute to establishing and changing consumption pattern.4
Various authors have noted that university students are a particularly vulnerable group from the nutritional viewpoint because they skip meals frequently, take snacks between meals, show a preference for fast food, and often drink alcohol.5 Students usually first assume responsibility for their diet during their stay at university. This is, therefore, a critical period for education in the development of dietary habits which are very important for future health.
In addition, an understanding of subjects related to diet may be a determinant of dietary factors. It may be thought that the greater the students’ knowledge of dietetics and nutrition, the better their dietary habits. However, even if this population is informed and has a basic knowledge about healthy diet, such knowledge does not always result in the actual consumption of food items which are part of a balanced diet. Knowledge must also be converted into positive attitudes that promote the recommended behavior. As shown by a meta-analysis of 138 studies, the intention to practice healthier behavior patterns is more strongly determined by attitudes than by knowledge.6
Because of the foregoing, a pilot study was undertaken to assess satisfaction with body weight, diet quality, and variables related to lifestyle (alcohol consumption and physical activity) in a group of female university students with normal body weight. An additional specific study objective was to analyze the potential differences between students of Human Nutrition and Dietetics (HND) and other degrees with no dietary and nutritional training component such as social work (SW). Both university degrees (HND and SW) are taught on the same campus and have similar timetables and a common university lunch room.
Materials and methodsParticipantsForty-seven female volunteers from the Alava campus of the Universidad del País Vasco (UPV/EHU) participated in this pilot study. Convenience non-probability sampling was used. All participants were female because most students of the degrees analyzed were women (80% in HND and 84% in SW)7 and because, as noted by several authors, social pressure for body image is greater in women.8 SW was selected because it is the degree with no training in dietetics and nutrition with the most female students on the Alava campus.7
The participants were informed that the research addressed dietary habits, other aspects related to lifestyle, and body weight. They were also informed about the procedures and measurements to be performed in the study, and provided informed consent. Data collected were coded to respect confidentiality.
Of the participants, 29 and 18 respectively were studying for a degree in HND and SW. They were all in the 2nd or 3rd year of their degree course when the data were collected. The mean age of the total sample was 20.0±1.3, and there were no significant age differences between the groups (Mann–Whitney's U [1]=222.0; p=0.359). All students were considered to have normal weight based on body mass index (BMI=weight/height2, kg/m2) according to the WHO classification.9
Women with low weight (n=3) and overweight or obesity (n=5) were excluded because a sample as homogeneous as possible was wanted for study and because, as reported by several authors, women with low weight or overweight/obesity tend to overestimate or underestimate their weight and/or height and have greater dissatisfaction with body weight.10 Ninety-eight percent of the target population participated in the study, and prevalence rates of low weight, overweight, and obesity were similar to those found in a large sample of university students in the Basque Country (n=745).11
MeasurementsAll data were recorded using questionnaires which were self-completed in a room for suitable for this purpose. A qualified person explained to the participants how the questionnaire should be completed and answered any questions arising during its administration.
Thus, self-reported and desired weight data and self-reported height data were recorded. Questions answered included: “What is your weight without clothes and shoes?”, “What is your height without shoes?”, “Ideally, what would you like to weigh?”. BMI was calculated from these self-reported weight and height measurements. Self-reported data were used because, as stated by other authors, correlation coefficients between self-reported weight and height and actual data are very high in a young adult university population.12
Self-reported and desired weights were used to assess satisfaction with body weight. The discrepancy between these two data has been validated as a body satisfaction measurement by Thompson and Van Den Berg.13 Identical and different self-reported and desired weights represent satisfaction and dissatisfaction with weight respectively. These results were interpreted in agreement with criteria established by Mendes Soares de Araújo and Gil Soares de Araújo,14 which classify individuals with differences less than 1 kg between self-reported and desired weight as satisfied, those with differences from 1 and 5kg as dissatisfied, and those with values higher than 5kg as highly dissatisfied.
It was also checked whether participants wanted to gain, maintain, or lose weight by asking the following question: “Would you like to lose or put on weight, or are you satisfied with your current weight?”.15
Dietary intake was assessed using a previously validated questionnaire of food consumption frequency.16 A Diet Quality Index (DQI) based on the one reported by Bowman et al. was estimated from data collected in the frequency questionnaire.17 The Bowman et al. index was previously used in other studies conducted in Spanish populations.18,19 The DQI included five components corresponding to the number of servings of each of the food groups (cereals, vegetables, fruit, milk products, and protein food products), as well as diet variety. Each component was scored from 0 to 10. The maximum DQI score was therefore 60 points.
Data on the number of servings from each food group were compared to the recommendations given in the dietary guide of the food pyramid by age and sex categories.20 A maximum score was assigned when the value of the servings or the number of meals was equal to or higher than the recommended value.17 That is, if consumption of four servings from a recommended group was recommended and a person consumed two servings, five points were assigned. If three servings were taken, 7.5 points were given. Bowman et al.17 criteria were adapted to define diet quality as “good” (DQI score>48 points), “needs to be improved” (DQI ranging from 30.6 and 48 points) and “poor” (DQI<30.6).
Age and lifestyle data (alcohol use and physical activity) were also recorded. For alcohol consumption, recorded in the food consumption frequency questionnaire, the standard drinking unit (SDU) was used to estimate the usual contents of absolute alcohol by type of drink according to Llopis et al. criteria.21 Risk consumption, defined as the consumption pattern that may involve a high risk of future damage for physical or mental health but not leading to current medical or psychiatric problems, was calculated from data on SDUs/week. The following groups were made based on alcohol consumption: teetotaler (no alcohol use), low risk (<11SDUs/week), medium risk (11–17SDUs/week), and high risk (>17SDUs/week).22
To analyze physical activity, a questionnaire was used which included questions about the daily number of hours spent sleeping and walking, watching TV or using a computer, the number of times per week exercise was practiced, and the number of years they had been practicing regular exercise.
Statistical analysisStatistical analysis was performed using SPSS V. 17.0 software. Results are presented as mean, standard deviation, and frequency. A Kolmogorov–Smirnov–Lilliefors normality test was performed, and non-parametric tests were used for data with a non-normal distribution. Differences between the groups of HND and SW students were assessed using a Student's t test and a Chi-square test for continuous and discrete variables respectively. When the distribution of continuous variables was not normal (physical activity data, score assigned to the group of milk products, protein foods, and diet variety), a non-parametric Mann–Whitney test was used.
In means comparisons, an analysis of effect size was also performed using Cohen's d statistic23 to estimate the magnitude and relevance of the results obtained. For interpretation of size effect data, the reference values proposed by Cohen were used: small effect (d≥0.20), medium effect (d≥0.50), and large effect (d≥0.80).
In the Chi-square analysis, when the expected frequency was less than 5, continuity correction (Yates correction) and exact tests were used. A Wilcoxon test was used to test for differences between dependent samples. A value of p<0.05 was considered statistically significant in all cases.
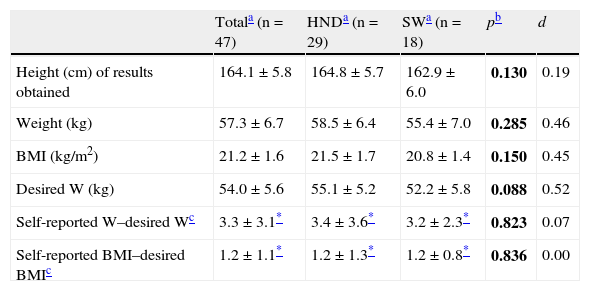
ResultsTable 1 shows self-reported measurements and indices derived from the overall sample and by group. No statistically significant differences were found in any variable between student groups (HDN and SW), but effect size (Cohen's d) was medium for self-reported and desired weight and for BMI. Differences between self-reported and desired weights reflected the desire to lose a mean of 3.3kg in the overall sample. Although body weight satisfaction did not differ between the groups, differences between self-reported and desired weights were significant for the overall sample and by groups (p<0.001). No significant differences were seen in BMI according to the studies conducted (t [1]=1.5; p=0.150).
Self-reported anthropometric mesurements.
| Totala (n=47) | HNDa (n=29) | SWa (n=18) | pb | d | |
| Height (cm) of results obtained | 164.1±5.8 | 164.8±5.7 | 162.9±6.0 | 0.130 | 0.19 |
| Weight (kg) | 57.3±6.7 | 58.5±6.4 | 55.4±7.0 | 0.285 | 0.46 |
| BMI (kg/m2) | 21.2±1.6 | 21.5±1.7 | 20.8±1.4 | 0.150 | 0.45 |
| Desired W (kg) | 54.0±5.6 | 55.1±5.2 | 52.2±5.8 | 0.088 | 0.52 |
| Self-reported W–desired Wc | 3.3±3.1* | 3.4±3.6* | 3.2±2.3* | 0.823 | 0.07 |
| Self-reported BMI–desired BMIc | 1.2±1.1* | 1.2±1.3* | 1.2±0.8* | 0.836 | 0.00 |
In the overall sample, 2.1% of participants stated that they wanted to gain weight, while 76.6% wanted to lose weight, and the remaining 21.3% wanted to maintain weight. There were no significant differences by degree in classification by the desire to gain, lose, or maintain body weight (Chi-square [1]=1.273; p=0.529). According to differences between self-reported and desired weights, 27.7% of all participants were satisfied, 57.4% dissatisfied, and 14.9% highly dissatisfied with their body weights. Differences between groups were not significant (Chi-square [1]=3.056; p=0.217).
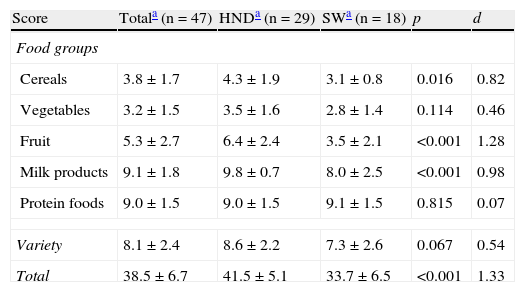
Table 2 shows the scores assigned to each of the DQI items and total scores by group. Higher scores for cereals, fruit, and milk products were recorded in the HND as compared to the SW group. Moreover, the total DQI score was higher in HND as compared to SW students (t [1]=4.6; p<0.001). Effect size (Cohen's d) was high for total DQI score and for the food groups of cereals, fruit, and milk products. By contrast, a medium effect size was found for scores assigned to vegetables and diet variety.
Scores of components of the Diet Quality Index.
| Score | Totala (n=47) | HNDa (n=29) | SWa (n=18) | p | d |
| Food groups | |||||
| Cereals | 3.8±1.7 | 4.3±1.9 | 3.1±0.8 | 0.016 | 0.82 |
| Vegetables | 3.2±1.5 | 3.5±1.6 | 2.8±1.4 | 0.114 | 0.46 |
| Fruit | 5.3±2.7 | 6.4±2.4 | 3.5±2.1 | <0.001 | 1.28 |
| Milk products | 9.1±1.8 | 9.8±0.7 | 8.0±2.5 | <0.001 | 0.98 |
| Protein foods | 9.0±1.5 | 9.0±1.5 | 9.1±1.5 | 0.815 | 0.07 |
| Variety | 8.1±2.4 | 8.6±2.2 | 7.3±2.6 | 0.067 | 0.54 |
| Total | 38.5±6.7 | 41.5±5.1 | 33.7±6.5 | <0.001 | 1.33 |
A comparison of data recorded for each of the DQI components to the recommendations given in the dietary guide showed that 10.6% of the sample had a “poor” diet, 83% a diet that “needs to be improved”, and 6.4% a “good” diet. In the HND group, 10.3% were reported to follow a “good” diet, and 89.7% a diet that “needs to be improved” In the SW group, 27.8% were reported to follow a “poor” diet, and 72.2% a diet that “needs to be improved”.
As regards the number of servings from each food group, 40.4% of the total sample did not take the recommended protein food servings. Recommendations for fruit were not met by 91.5%. Recommendations for milk products and cereals were not met by 31.9% and 97.9% of participants respectively. Finally, no student met the recommendations established for vegetables.
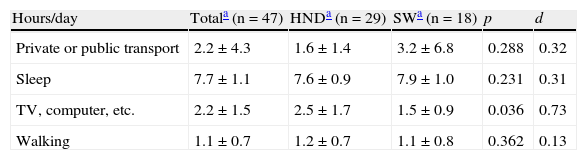
With regard to the use of alcohol, mean weekly number of SDUs was 4.0±3.6 in the overall sample, and the differences between groups were not statistically significant (t [1]=1.1; p=0.268). In addition, effect size (Cohen's d) was medium-low for alcohol consumption depending on degree (d=0.37). Based on alcohol use, 6.4% of the total sample was classified as teetotalers, 87.2% had a low risk, and 6.4% had a medium risk. There were no statistically significant differences between the groups in classification by alcohol consumption (Chi-square [Yates correction][1]=0.653; p=0.426).
Table 3 shows the physical activity of participants. Statistically significant differences were recorded in the number of hours spent watching TV or using a computer, which was greater in the HND as compared to the SW group (t [1]=2.3; p<0.05). Size effect (Cohen's d) for this variable (TV or computer) was medium, and was medium-low for travel and sleep time. Regular exercise was reported by 31.9% of participants, 27.6% in the HND group and 38.9% in the SW group.
The group which practiced regular exercise had been doing so for 3.0±5.0 years. There were no significant differences between the groups in the mean number of years they had practiced exercise (Mann–Whitney's U [1]=255.5; p=0.891). Mean frequency of exercise reported was 1.7±1.7 times per week. Exercise frequency did not differ between the groups by degree (Mann–Whitney's U [1]=240.0; p=0.637).
DiscussionThe overall objectives of this study were to report satisfaction with body weight, diet quality, and variables related to lifestyle in a group of university students with normal weight, and to analyze the differences between students with training in nutrition (HND) and with no specific training in nutrition (SW). The mean BMI of participants was similar to that reported by other authors in studies using both convenience samples14 and random samples in the same setting.24
In the overall sample, mean differences between self-reported and desired weight and between self-reported and desired BMI were similar to those found by Neighbors and Sobal25 in university female students. Such discrepancies between self-reported and desired weight may lead to negative emotional states that increase emotional stress and result in the adoption of body-modifying behaviors that may even involve a risk of malnutrition.26
Most participants in this study wanted to lose weight, and a small proportion wanted to gain weight. Other authors have also reported that a majority of women with normal weight want to lose weight.27 With regard to body weight dissatisfaction, other authors have recorded proportions of “dissatisfied” women similar to those found in our study, but lower proportions of “satisfied” women (18.8%) and higher proportions of “highly dissatisfied” women (25.1%).14 Body dissatisfaction may be attributed on the one hand to esthetic reasons,27 and on the other hand to motivation for health maintenance and disease prevention purposes.28 But it is probably esthetic motivation which is the main reason for this desire to be thinner, as shown by the BMI decrease in beauty models in recent years27 and by the fact that even if women are within a normal BMI range, they want to reduce weight, as is shown by this study.
This study found no differences between students of HND and SW degrees in classification by body weight dissatisfaction. This suggests that pressure to achieve an ideal body image, and the desire to adapt to an ideal model of “slim” beauty, are not more prevalent among HND as compared to SW students. In any case, such body weight dissatisfaction is especially relevant in nutrition students because it may influence their interaction with patients. Other studies have also emphasized that body weight satisfaction may interfere with the work of dieticians.29
As regards diet quality in the overall sample, very few university students followed an adequate diet. The diet of most participants was rated as “needs to be improved” despite the extensive knowledge of dietetics and nutrition of many of them. These results agree with those reported by other studies on female university students with normal weights.30 The lowest scores in the DQI were given to the fruit, vegetable, and cereal groups, and a high proportion of participants did not meet the recommendations for these food groups. These data are similar to those found by other authors in studies conducted on university students.31
HND participants achieved higher DQI scores as compared to SW students. In addition, HND students achieved higher scores than SW students for the DQI groups of cereals, fruit, and milk products. Such between-group differences may be due to the level of knowledge in diet and nutrition, which may condition individual dietary habits.29 However, other authors such as Montero et al.32 found no differences in dietary habits by level of knowledge in nutrition in students of different degrees. This shows that acquisition of knowledge is not a sufficient condition for modifying eating habits and behavior.
Although DQI scores were higher for the HND group, most of these students followed a diet rated as “needs to be improved”. As reported by other authors, knowledge about nutrition is not always reflected in the practice of a healthy diet.32 In addition to food preferences, multiple factors condition inadequate dietary habits, including social, cultural, and economic factors.
No differences were seen either in lifestyle (alcohol consumption and physical activity) between HND and SW students. Low risk alcohol consumption was found in almost all students, which agrees with data from women in the same age group from the general population of the Basque Region.33 As regards daily activity, differences were found in the number of hours spent watching TV or using a computer, which was higher in the HND vs the SW group. Other authors recorded longer times (from 5 to 6h) spent in such activities.28 In this study, the mean sleep time of students was similar to that found in the health survey conducted in the Region of Valencia on women of the same age group.24
Only one third of the total sample practiced regular exercise (1.7 times/week on average), a result similar to those reported in other studies.24,31 Other authors have noted that the main reason why university students do not perform physical exercise is “lack of time”.34 It should be reminded that a physically active lifestyle is usually associated with healthier habits, a lower incidence of smoking, and less alcohol consumption.35
One of the limitations of this study is sample size, which may condition the external validity of the results. However, this pilot study provides information about knowledge, attitudes, and expectations related to the body (body satisfaction) and behavioral measurements (diet quality and lifestyle) in nutrition students as compared to students with no training in nutrition and dietetics. This information is found in only a few studies.6 On the other hand, the use of self-reported measurements may involve a bias of underestimation or overestimation that impacts on the identification of cases with low weight, overweight, or obesity. For this reason, the authors of this study are conducting a study to confirm these measurements by comparing them to validated measurements.
On the other hand, use of direct measurements (through a questionnaire) of body dissatisfaction could hide true attitudes. Implicit measurements of attitudes (to thinness and obesity) predict for body weight changes, image dissatisfaction, and risk attitudes more strongly than explicit measurements (using questionnaires).36 Despite this limitation, this study found that a high proportion of participants were dissatisfied with their body weight and wanted to lose weight, despite the fact that they were considered to have normal weight. While HND students had a better quality of diet as compared to SW students, DQI scores in both groups showed the need for an improved diet quality.
In conclusion, this study shows that knowledge about nutrition and dietetics is not sufficient to change attitudes related to the body or to manage social and cultural pressures on body image, as demonstrated by the answers of HND students, who follow a healthier diet but are as dissatisfied with their body weight as SW students with no training in nutrition. It appears that the female beauty esthetic model that stresses a slim figure is internalized by women with normal weight, which makes them feel dissatisfied with their weight. This trend affects both women with and without knowledge of nutrition.
This study is a first exploration of a subject that will be analyzed in more depth in subsequent research with university students. We think that future studies following this line of research may contribute to the design of educational interventions aimed at changing attitudes and at promoting in young women a realistic compromise between desired and actual body image, and thus personal acceptance and self-esteem. These interventions will not only require the transmission of knowledge, but, above all, a change in attitudes and emotional reactions to both body and diet.
Conflict of interestThe authors state that they have no conflicts of interest.
Authors thank all participants for their cooperation.
Please cite this article as: Amaral Alves D, et al. Satisfacción corporal y calidad de la dieta en estudiantes universitarias del País Vasco. Endocrinol Nutr. 2012;59:239–45.