


Anorexia nervosa (AN) is associated with significant physical and psychological stress. Stress causes changes at a cellular level and mitochondria may reflect this stress via changes such as alterations in DNA quantity or in their function. Mitochondria are unique in that they possess their own DNA, distinct from nuclear DNA, of which there are many copies within the cell. An indirect measure of mitochondrial function is the assessment of mitochondrial DNA copy number (mtDNAcn). Telomere length (TL) represents a marker of normal biological ageing, and TL can be shortened by stressors. We sought to test the following hypotheses: (1) that increased mtDNAcn would be found in patients with AN in comparison to healthy controls, (2) that mtDNAcn is related to duration and severity of AN, and (3) mtDNAcn is correlated with TL.
MethodsUsing quantitative real-time polymerase chain reaction, we calculated mtDNAcn and TL using peripheral whole blood DNA collected from patients with AN (n = 23) compared to samples from age- and sex-matched healthy controls (n = 33). Clinical characteristics were also obtained.
ResultsWe found no difference between mtDNAcn in patients with AN in comparison to controls. mtDNAcn was positively associated with duration of illness, but not with illness severity. There was no association between mtDNAcn and TL.
ConclusionsFurther investigations may clarify whether compensatory mechanisms increase mtDNAcn with increased illness duration.
The mitochondrion is a double-membraned cell organelle that uses the mitochondrial respiratory chain to produce energy in the form of adenosine triphosphate (ATP), and regulates intracellular signalling, cellular homeostasis, and apoptosis.1 Mitochondria are unique in that they possess their own DNA, which is independent of the nuclear DNA genome. Mitochondrial DNA contains: 37 genes, encoding 13 proteins that participate in oxidative phosphorylation; 22 tRNAs; and two rRNAs.1 Hundreds of mitochondria are contained within each cell, with each mitochondrion containing 2‒10 copies of the mitochondrial DNA genome.
Compared to nuclear DNA, mitochondrial DNA has an increased risk of being exposed to oxidative damage from reactive oxygen species and this, twinned with its limited DNA repair system, can have a negative impact on functioning of the mitochondrion.1 Stress or damage to the mitochondrion is thought to result in changes in the number of copies of mitochondrial DNA. Indeed, mitochondrial DNA copy number (mtDNAcn) can increase or decrease in response to stressors. Mechanisms may exist where mtDNAcn is increased as an adaptive response to stress through a process known as upregulation.2 However, when a stressful event persists, the continued exposure to reactive oxygen species (ROS) leads to a reduction in the mitochondrion's ability to replicate and results in an accumulation of defective mitochondria.3 This then contributes to a reduction in mtDNAcn. Furthermore, chronic stress may downregulate brain-derived neurotrophic factor (BDNF) in the cerebral cortex and hippocampus, leading to impaired glucocorticoid receptor (GR) signalling and resulting in glucocorticoid resistance.4 Chronically increased levels of glucose can damage mitochondria and mitochondrial DNA due to the production of toxic products and systemic inflammation and thereby contribute to reduced mtDNAcn.5 Furthermore, alterations in mtDNAcn are associated with cardiovascular disease, cancer and renal disease and with overall mortality.6 This suggests that the measurement of mtDNAcn in peripheral blood may be an accessible and readily available method of identifying those with increased risk of comorbid disease in states where the body experiences significant physical stress, such as AN.
Patients with anorexia nervosa (AN) experience major stressors in the form of extreme physical stress, with severely reduced body mass index (BMI) secondary to calorie restriction and/or excessive exercise. Studies suggest that mtDNAcn increases with a reducing BMI in females.7 There may be an inverse relationship between mtDNAcn and weight, waist-hip ration, waist size, and BMI.8 mtDNAcn has also been shown to increase with exercise intensity.9 However, while many studies of mtDNAcn have been conducted in participants with a normal or raised BMI,10 there are no studies investigating mtDNAcn and severely reduced BMI and, to our knowledge, there have been no studies conducted to date examining mtDNAcn in AN.
Those with AN also experience significant psychological stress secondary to the effects of their psychiatric illness. In fact, mitochondrial dysfunction has been linked to various psychiatric conditions associated with stress such as mood disorders.11 Tyrka, et al.12 reported significantly increased mtDNAcn in those who had experienced psychological stress in the form of early life stress, compared to controls without a history of childhood maltreatment and parental loss. We have recently reported elevated blood mtDNAcn in severely depressed patients undergoing treatment with electroconvulsive therapy.13 Similarly, Cai, et al.14 reported increased mtDNAcn in major depression in females.
Telomeres, which contain repetitive DNA sequences, are located at the terminal ends of chromosomes and protect chromosomes from degradation.10 We have previously reported increased TL in patients with AN compared to healthy controls.15 The preservation of TL in patients with AN may occur secondary to the protective effect of diet and exercise on TL. However, there have been no studies examining the relationship between TL and mtDNAcn in patients with AN to date. Alterations in both TL and mtDNAcn may be indicative of the biological aging process, and studies show that mtDNAcn and TL appear to be co-regulated and positively associated.10 Reactive oxygen species (ROS) may result in shortened TL and lead to telomere dysfunction and cellular senescence.2 Telomere dysfunction can then negatively impact on mitochondrial biogenesis by downregulating peroxisome proliferator-activated receptor- ɣ coactivator 1α (PGC-1 α), affecting mitochondrial DNA copy number.16 Several studies show that there is a positive relationship between TL and mtDNAcn.8,17–19
We therefore sought to test the following hypotheses using a cross-sectional, case-control design: (1) mtDNAcn is increased in patients with AN compared to healthy controls, (2) mtDNAcn is increased with increasing duration and severity of illness, and (3) mtDNAcn is positively correlated with TL.
Material and methodsParticipants and sample collectionParticipant recruitment and outcome measures for this study are described in a previously published study using the same participant cohort.15 Briefly, we recruited patients with AN from August 2018 to April 2019 in St Patrick's University Hospital, Ireland. The inclusion criteria were as follows: ≥18 years old; diagnosis of AN per Diagnostic and Statistical Manual of Mental Disorders 5th edition (DSM-5). We confirmed a diagnosis of AN, or the restrictive and binge-purge AN subtypes, using the Mini-International Neuropsychiatric Interview (M.I.N.I.) for DSM-5, version 7.20 The exclusion criteria for this study were as follows: chronic physical illness unrelated to AN, active substance dependence, involuntary status. We recruited healthy controls who had no history of psychiatric or current physical illness and a normal BMI using word of mouth, social media, and advertisements in local volunteer groups.
We collected fasting, peripheral whole blood samples into K2EDTA tubes (BD, UK). Tubes were stored at −20 °C for 24 h and then at −80 °C prior to analysis.
Demographic and clinical dataWe documented demographic and clinical data for all participants. The Eating Disorders Examination (EDE) edition 17.0D21 was used to assess the severity of AN. This scale provides a score based on eating disorder psychopathology including restraint, and concern regarding eating, weight, and shape. All prescribed medications for the AN group were documented. Full blood count (FBC) samples were taken from patients with AN following admission to the eating disorders ward.
DNA extractionBlood samples were sent to the Trinity College Dublin Biobank facility (https://www-tcd-ie.elib.tcd.ie/ttmi/facilities/trinity-biobank/) for DNA extraction. DNA was extracted using the Autopure LS ® (Qiagen, Germany) and subsequently stored at −20 °C until analysis. Purified DNA had an A260/A280 ratio of 1.6‒1.9.
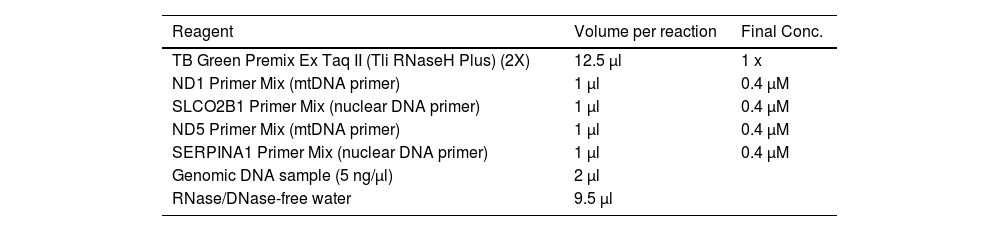
Mitochondrial DNA copy number assayAs previously described,13 we used the Takara® Human Mitochondrial DNA monitoring primer set (Takara Bio Inc., Sweden) to assess relative mtDNAcn using quantitative real-time polymerase chain reaction (qRT-PCR). Briefly, each sample was run in duplicate in a 25 µl reaction, as outlined in Table 1. Each sample was run using two primers for mtDNA (ND1 and ND5) and two primers for nuclear DNA (SLCO2B1 and SERPINA1), included in the Takara set. qRT-PCR was performed using a StepOnePlus™ Real-Time PCR system (Applied Biosystems, Thermo Fisher Scientific, USA) with the following cycling conditions: 95 °C for 30 s followed by 40 cycles of 95 °C for 5 s and 60 °C for 30 s.
qRT-PCR Reaction set-up.
Relative mtDNAcn per diploid genome was calculated using the mtDNA Copy Number Tool from Takara using the following formula: 2−ΔCt for the values ΔCt1 and ΔCt2, where ΔCt1 = (Ct for SLCO2B1–Ct for ND1) and ΔCt2 = (Ct for SERPINA1–Ct for ND5). An example calculation is provided in Supplemental File 1.
To control for inter-assay variability, three interplate calibrator DNA samples, obtained from healthy volunteers aged 29 to 55 years, were included on each PCR plate. The intra-assay coefficient of variation (CV) was <3.7 % and the inter-assay CV was <2.3 %.
Telomere length assayThe method for the telomere length (TL) assay is reported in a previously published study on the same cohort of participants.15 TL data obtained in that study15 were included in analyses reported here. Therefore, the same participant sample is used for both the TL and mtDNAcn assays. Briefly, each sample for the TL analyses was run in duplicate plates. A five-point standard curve of HeLa cell DNA was prepared so that the quantity of targeted templates in each sample could be quantified relative to the standard curve. The cycling profile for the telomere rection was 95 °C for 5 min followed by 30 cycles of 95 °C for 15 s and 54 °C for 2 min. The cycling profile for the Single-copy gene was 95 °C for 5 min followed by 40 cycles of 95 °C for 15 s and 58 °C for 20 s, and 72 °C for 28 s.
Statistical analysesAll statistical analyses were performed using SPSS, version 27 (IBM Corporation, USA). A Shapiro-Wilk test was used to assess data for normality. The Fisher's Exact test and Chi Square Goodness-of-fit test were used to determine differences in categorical demographic and clinical data. Independent t tests and Mann Whitney U tests were used to analyse continuous demographic and clinical data. Differences between groups were assessed using general linear models, adjusting for covariates where appropriate. Associations between continuous variables were assessed using Pearson's and Spearman's correlation tests, while associations between continuous and dichotomous variables were determined using point-biserial correlations. Age, sex, educational attainment, smoking status, BMI,13 antipsychotic medication,22 and vitamin B12 supplementation23 were included as covariates as these can affect mtDNAcn. We conducted both (1) unadjusted analyses and (2) analyses adjusted for age, sex, level of educational attainment, smoking status, antipsychotic medication, BMI, and vitamin B12. Because this was an exploratory study no correction was made for multiple comparison. Data are presented as mean mtDNAcn ± standard deviation (S.D). Differences with a p value ≤0.05 were deemed statistically significant. Analyses were two-tailed. Because there are so few previous studies reporting mtDNAcn in AN, it was not possible to definitively estimate a sample size for this exploratory study. However, we performed a post hoc power analysis, using G*Power (version 3.1.9.7) (https://www.psychologie.hhu.de/en/arbeitsgruppen/allgemeine-psychologie-und-arbeitspsychologie/gpower). With a sample size of 23 patients and 33 controls and setting alpha at 0.05 (two-sided), there is 80 % power to be able to detect an effect size of 0.8 for the difference in mtDNAcn between the AN and control groups; this represents a large and clinically relevant effect size.
EthicsThis study adhered to the Declaration of Helsinki24 and was approved by the St Patrick's University Hospital Research Ethics Committee. All ethical procedures were performed, and the privacy of participants was always observed. Participants provided written informed consent for experimentation before being included in the study.
ResultsDemographic and clinical characteristicsFifty-six participants were recruited to this study, as previously described.15 Briefly, 23 patients with AN (21 females; mean age 30.3 years, SD 13.1) and 33 healthy controls (32 females, mean age 30.6 years, SD 12.) were included. There was no significant difference between the groups with regard to age, sex, or smoking status (all p > 0.05). However, the control group had a higher level of education (p ≤ 0.001), and as expected, a higher BMI (p ≤ 0.001), and lower EDE scores (p ≤ 0.001). The mean age of onset of AN was 17.1 years and the mean duration of AN was 13.2 years. Nineteen patients had a diagnosis of restrictive-type AN, and four patients had a diagnosis of binge-purge-type AN. A summary of clinical and demographic details for the whole group, and prescribed medications for the AN group, are described in the online supplemental file 2. This file supplemented a previously published study that used the same participant cohort.15 The control group was not being treated with any prescribed medications. Full blood count samples were obtained from the AN cohort following admission and are described in Table 2.
Full blood count results.
Neutrophil normal range: 2.0–7.0 × 10⁹/L; Lymphocyte normal range: 1.0‒3.0 × 10⁹/L; Platelet normal range: 150‒410 × 109/L.
MtDNAcn was positively correlated with age for the group as a whole (r = 0.39, p = 0.003) and for the AN group (r = 0.49, p = 0.02). However, there was no correlation between age and mtDNAcn in the control group (r = 0.31, p = 0.08). There was no significant correlation between mtDNAcn and sex, BMI, level of educational attainment, or smoking status either in the whole group or when both groups were individually examined (all p > 0.05).
Comparison of mtDNAcn between AN and control groupsRaw mtDNAcn data were not normally distributed, but following natural log transformation data were normally distributed. Mean mtDNAcn was 2.08 ± 0.12 in the AN group and 2.04 ± 0.09 in the control group (effect size: r = 0.18), and no significant difference was noted between the groups (Fig. 1; t=−1.17, df=54, p = 0.25). Moreover, statistical adjustment for potential covariates did not change the results (F(1, 47)=0.53, p = 0.47).
 values in Healthy Controls (mean 2.04 ± 0.09) compared to patients with Anorexia Nervosa (mean 2.08 ± 0.12). The mean mtDNAcn values for each group are indicated by each horizontal line. There was no statistically significant difference between the groups, either before or after adjusting for covariates (p > 0.05).")
Raw unadjusted mitochondrial DNA copy number (mtDNAcn) values in Healthy Controls (mean 2.04 ± 0.09) compared to patients with Anorexia Nervosa (mean 2.08 ± 0.12). The mean mtDNAcn values for each group are indicated by each horizontal line. There was no statistically significant difference between the groups, either before or after adjusting for covariates (p > 0.05).
In the AN group, mtDNAcn was significantly positively correlated with illness duration (Fig. 2; r = 0.59, p = 0.003), which remained significant following adjustment for age (r = 0.44, p = 0.04). There was no statistically significant correlation between mtDNAcn and illness severity measured by the EDE global score (r = 0.08, p = 0.57), and this did not change following adjustment for age (r = 0.13, p = 0.35).
Correlations between mtDNAcn and TL values (log transformed) and duration of Anorexia Nervosa (p = 0.003).")
There was no statistically significant correlation between mtDNAcn and TL in the group as a whole (Fig. 3, r=−0.24, p = 0.08), even following adjustment for age (r = 0.06, p = 0.67), or in the AN group, both before and after controlling for age (r=−0.19, p = 0.34 and r=−0.05, p = 0.82, respectively). In the control group, there was a statistically significant inverse correlation between mtDNAcn and TL (r=−0.42, p = 0.01); however, this was no longer statistically significant after controlling for age (r=−0.32, p = 0.08).
Discussion and mitochondrial DNA copy number (mtDNAcn) values either before or after adjusting for age (p > 0.05) in the group as a whole (n = 56).")
To our knowledge, this study is the first to examine mtDNAcn in blood from patients with AN. Contrary to our primary hypothesis, our results show no significant difference in mtDNAcn between patients with AN compared to healthy controls. Regarding our second hypothesis, there was a positive correlation between mtDNAcn and illness duration, though there was no significant correlation identified between mtDNAcn and severity of illness. It is worth noting that the EDE may not accurately reflect the biological severity of the disease as this clinician-rated questionnaire is based on the patient's concerns regarding their weight, shape, eating habits, and restraint tendencies and does not quantify the level of exercise or calorie expenditure or analyse BMI. Finally, we found no correlation between mtDNAcn and TL.
There may be several reasons for the link between mtDNAcn and the duration of illness noted here. First, an increase in mtDNAcn might occur as a mechanism to compensate for reduced mitochondrial energetics induced by physical or psychological stressors.25 Second, studies show that patients with AN can have altered cell distributions and develop haematological abnormalities. For example, up to 17 % of hospitalised patients with severe AN develop thrombocytosis.26 Different cell types show vast differences in mtDNAcn.25 For instance, lymphocytes have an mtDNAcn in the range of 150‒600 copies per cell, neutrophils have an mtDNAcn in the region of ∼150 copies per cell, and platelets, which have no nucleus, contain an “infinite” mtDNAcn.25 Thus, as mtDNAcn calculations are based on the relative number of copies of mitochondrial DNA using the nuclear genome as the denominator, in the case of platelets this denominator is zero; therefore, an increased number of platelets in the circulation, as is the case with thrombocytosis, may artificially increase the mtDNAcn and subsequently affect the overall mtDNAcn count.25 Patients with AN are also found to have increased lymphocyte numbers.27 Since there is lower mtDNAcn in neutrophils compared to lymphocytes, a higher neutrophil to lymphocyte ratio would result in lower mtDNAcn.25 Full blood counts were not acquired for patients included in this study on the same day as sample collection; thus, we were unable to adjust our analyses to take into account variations in blood cell numbers. However, we did have full blood count data available for patients taken an average of five days prior to recruitment. Using these data, ∼27 % of our patient cohort had a lymphocyte count below the normal range and ∼36 % had a reduced neutrophil count (these were not the same people). The majority of our patient cohort had a platelet count that was within the normal range of 150‒410 × 109/L, with the data showing that only one patient had a platelet count slightly above the normal range (i.e., 428 × 109/L) and one had a count slightly below the normal range (i.e., 125 × 109/L). Thus, it is possible that blood cell counts may have impacted on our results as interpretation is limited by the lack of same day blood cell counts. Therefore, future studies should ensure that full blood count data are acquired at the same time as study sample collection to enable statistical adjustment for blood cell numbers to gain a better picture of mtDNAcn in this patient population.
It is worth noting that the measurement of mtDNAcn is only one of many ways to indirectly quantify mitochondrial content, and the measurement of mtDNAcn alone does not inform us of the efficiency of the whole mitochondrion.25 Mitochondria are involved in a range of functions. Assessment of a range of different mitochondrial function measurements, such as mitochondrial content, integrity, and respiratory capacity, may be a more holistic and accurate way to report on mitochondrial content and function. On the whole, the comparison of studies on mtDNAcn remains challenging because multiple factors can affect mtDNAcn, including the cell population studied, the tissue type, and changes in energy requirements. Factors such as age, stress and diurnal variation can affect cell distribution. Furthermore, not all mtDNAcn quantification methods are equivalent and kits used for DNA extraction also affect mtDNAcn quantification.25 Therefore, it is vital that there is a consistency of approach in future studies of mtDNAcn in psychiatry, in particular for AN.
A strength of this study is the fact that this is the first report of mtDNAcn in patients with AN compared to a healthy control group. This is interesting from a translational perspective as further larger scale studies may shed light on the impact of AN on the mitochondrion. In addition, though the sample size was small, a positive relationship was identified between mtDNAcn and duration of illness. This study has several limitations. First, mtDNAcn was determined using whole blood instead of using isolated cell-subtypes. Furthermore, we do not have a full blood count for these patients taken at the timepoint of blood collection for this study; so, we were unable to conduct analyses to control for platelet count. Second, we measured mtDNAcn in peripheral blood samples. A change in mtDNAcn in the peripheral blood may not be indicative of mtDNA content or function in the brain. Third, our mtDNAcn measurements were cross-sectional, and so it was not possible for us to assess changes in mtDNAcn over time, limiting conclusions about causality. Fourth, our sample size was small, which limits the generalisability of our results. Additionally, as this was an exploratory study, we did not correct for multiple comparison and larger scale studies would be required to validate our findings. Fifth, physical exercise and dietary restraint may affect mtDNAcn; however, we did not have a measure of physical exercise or details about the exact caloric intake for this cohort. Finally, most of our patients were receiving treatment with prescribed psychotropic medications, the effects of which on mtDNAcn are unknown. Furthermore, many of the AN patients are prescribed dietary supplements, including vitamin B12 that has a positive correlation with mtDNAcn.23
ConclusionsWe found no overall difference in mtDNAcn between patients with AN and healthy controls. However, we did identify a positive association between mtDNAcn and duration of illness, suggestive, perhaps, of a mechanism of mitochondrial adaptation with progression of AN. Picard and McEwen28 describe an increase in mtDNAcn secondary to compensatory upregulation of mitochondrial biogenesis as an adaptive response to stress by the cell. Animal studies of mtDNAcn and chronic stress report an increase in mtDNAcn as measured in peripheral tissues following chronic stress.14,29 Furthermore, studies examining rodents trained with treadmill running reported that mtDNA was either partially or completely protected against stress-induced reductions in copy numbers.30 Similarly, in humans, chronic physical activity and exercise may have also have a protective effect on mtDNA, therefore preserving copy number.31 Our results reflect the complexity of stressors on mtDNAcn and highlight the need for studies examining mtDNAcn and various types of stressors, such as those that vary with nature (physical stress, psychological stress) and with duration (acute and chronic) of illness with AN. Although we reported no correlation between mtDNAcn and illness severity, it would be important to examine changes in copy number with various levels of stress (mild, moderate, severe), and investigate lifetime exposure to stress to examine the effect of stress in early life versus later life. Larger scale studies are required to increase the sample size and overcome some of the limitations of the present study. Longitudinal and prospective study designs would help to establish the association between stressors to fully examine mtDNAcn and mitochondrial function in AN and AN-like states and advance our understanding of the impact of AN on the mitochondrion.