


The topology of the electrical distribution systems is somehow similar to the topology of leaves as a natural optimal system. The leaves having internal loops (ILs) are more reliable than ones having radial structure. In this paper, a novel approach using ILs is proposed to optimize the distribution systems reliability. As using ILs in electrical distribution system improves the system reliability and requires additional costs, a cost-benefit analysis is necessary. Using a novel way such as ILs to improve the power grid reliability in compare to conventional approaches is one contribution of this paper. Considering the economic effects in addition to technical aspects is another advantage of the proposed method. In this paper, the cost of energy not-supplied (CENS) reduction is used to investigate the benefits of ILs that simplifies and reduces the computations regarding the system CENS without ILs and through using them. The introduced objective function (OF) consists of the saved cost due to reduction of CENS and also the additional investment of using ILs. The method is applied to a realistic 34-bus system of Tehran Regional Electrical Company (TREC). The genetic algorithm (GA) is used to solve the optimization problem. The test results illustrate by reasonable investment for ILs according to an optimum solution, the considerable reliability improvement and economic benefits are achievable.
info Matrix of internal loops information
Matrix of network information
Repair time (h)
Number of main branches
Failure rate of j-th section located in the main branch (fail-ures/year)
Installed amount of load to the k-th section of the main branch (kW)
Internal loop
Line forms internal loop
Number of sections located in the i-th lateral branch
Installed load to i-th section (kVA)
Failure rate of i-th section (faults/year)
Binary variable based on existence or non-existence of the protective device in i-th section
Binary variable based on existence or non-existence of the switching device at i-th section
Sending bus of i-th section
Sending bus of the line forming i-th loop
Receiving bus of the line forming i-th loop
Cost of construction of the line forming i-th loop (1000 US$)
First downstream lateral branch of l-th section located in the main branch
Energy not-supplied decrement by using internal loops when a fault occurs in main branches (kWh)
Energy not-supplied decrement by using internal loops when a fault occurs in lateral branches (kWh)
Total energy not-supplied decrement by using internal loops (kWh)
Cost of energy not-supplied cost decrement by using ILs (US$)
Annual energy not-supplied decrement by using internal loops (kWh/year)
Annual cost of energy not-supplied decrement by using internal loops (US.$/year)
Binary variables based on the existence or non-existence of i-th internal loop
Matrix of control or decision making parameters
Objective function
Effective lifetime of the designed system (year)
Number of feasible internal loops
Installed amount of load of j-th section of i-th lateral branch (kVA)
j-th section of first backward lateral branch of i-th main section
Energy not-supplied (kWh)
System average interruption frequency index (count/year)
A binary variable which its one value indicates at least one switching device exists in the downstream sections
A binary variable which its one value indicates at least one IL exists that its sending bus is in upstream buses of the j-th section and the receiving bus of the discussed IL is in down-stream buses of the j-th section
A binary term representing the feasibility of energy restoration of loads installed in j-th section by using ILs
Failure rate of j-th section of i-th lateral branch (faults/year)
Failure rate of i-th section (faults/year)
Length of i-th section (m)
Amount of loads installed in i-th section (kVA)
Number of customers installed in i-th section
Deregulation of electricity markets has urged restructuring of vertically integrated power systems to generation, transmission and distribution corporations. By this separation, electric utilities and network operators have focused on more reliable and profitable operation of power system corporations (Chandramohan, Atturulu, Devi, & Venkatesh, 2010; Banerjee & Islam, 2011). Moreover, according to customer failure statistics (Etemadi & Fotuhi-Firuzabad, 2008; Billinton & Allan, 1984), distribution systems have the most significant contribution to customer interruptions. Thus, most of distribution network operators (DNOs) have tried to improve the system reliability in an economic way.
A great deal of attention has been paid by researchers to propose methodologies aimed at improving distribution system reliability. These methodologies have been generally based on optimal placement of switches (Celli & Pilo, 1999; Billinton & Jonnavithula, 1996; Teng & Lu, 2002; Kazemi, Fotuhi-Firuzabad, Sanaye-Pasand, & Lehtonen, 2009), reclosers and protective devices (Da Silva, Pereira, & Mantovani, 2004a; Da Silva et al., 2008; Dezaki et al., 2010; Hashemi-Dezaki et al., 2010; Tppachon & Rerkpreedapong, 2009; Popovic et al., 2005; Pregelj et al., 2006), as well as adopting distributed generation (DG) (Popovic et al., 2005; Pregelj, Begovic, & Rohatgi, 2006; Wang & Singh, 2008; Trebolle & Gomez, 2010; Trebolle, Gómez, Cossent, & Frías, 2010; Da Silva et al., 2004b; Catrinu & Nordgard, 2011) and system reconfiguration solutions (Brown & Hanson, 2001). But, studying the internal loops (IL) in order to improve the reliability has not been attended seriously, so far.
The structures of leaves vessels as a natural structure are similar to the structure of the transportation networks or electrical distribution systems. Thereby, different optimization algorithms have been introduced based on the performance of natural systems such as genetic algorithm (GA) (Teng & Lu, 2002; Dezaki et al., 2010; Hashemi-Dezaki et al., 2010; Ding, Cai, Sun, & Chen, 2014), ant colony system (ACS) (Da Silva et al., 2004a; Wang & Singh, 2008), shuffled frog leaping algorithm (SFLA), and particle swarm optimization (PSO) (Niknam, Zare, Aghaei, & Farsani, 2011; Niknam & Azad, 2010; Safari, 2013; Erdeljan, Capko, Vukmirovic, Bojanic, & Congradac, 2014), and honey bee mating optimization (HBMO) (Safari, Ahmadian, & Golkar, 2013). Similarly, it is clear that by inspiration from leaves system, the improvement of different aspects of electrical distribution system is possible.
The structure of leaves vessels is categorized into two main groups: ones having a radial structural without ILs and the others having a radial structure with IL. Those leaves without ILs are well compared with the conventional pure radial distribution network. Those leaves including ILs are more reliable than ones do not. In addition to risk level and reliability indices, the performance of grids with ILs for loss reduction is more desirable (Katifor et al., 2010; Corson, 2010).
By designing the electrical distribution structure similar to leaves vessels, loss reduction and reliability enhancement can be obtained. This derivation is based on this concept that if a fault occurs in a vessel structure of leaf with ILs, the rest of leave would continue living, properly. Also in a distribution network, this would be satisfactory that when a fault occurs in a part of a system, rest of the loads which are not located in the vicinity of the interrupted region do not experience any outage. But having too many ILs in the electrical distribution system is not desirable. Thus, determine the optimal ILs to improve the system reliability with the reasonable changes and infrastructures is interesting.
In this paper, a novel approach based on the leaves structure is proposed to optimally determine the location of ILs in distribution networks aiming at improving the system reliability. In this approach, a novel analytical method is introduced to calculate the energy not-supplied decrement (ENSDCR) using ILs like Dezaki et al. (2010), Hashemi-Dezaki et al. (2010), Dezaki, Abyaneh, Agheli, & Mazlumi (2012), and Hashemi-Dezaki et al. (2011). In addition to reliability indices such as system average interruption frequency index (SAIFI) (Dezaki et al., 2010; Hashemi-Dezaki et al., 2010) and ENS (Dezaki et al., 2012; Hashemi-Dezaki et al., 2011), the restoration of interrupted loads is another important field of researches on reliability improvement of electric distribution systems which is concerned in this paper. The introduced method can be more useful and interesting because it is focused on energy restoration by using ILs in compare to conventional methods.
Implementing the ILs leads to increase the investment in compare to radial type or open-loop distribution systems. Hence, a novel OF considering all the constraints and additional costs due to using ILs is introduced. The GA is used to solve the optimization problem, and it is implemented in MATLAB. The proposed method is applied on a realistic distribution system of Tehran Regional Electrical Company (TREC). The test results illustrate the efficiency of the method.
This paper is organized as follows. Section 2 addresses the problem statement of using ILs to improve the system reliability. The problem formulation of the energy restoration using ILs is presented in section 3. The numerical results are discussed in section 4, and conclusions are given in section 5.
2System Reliability Improvement Using Internal LoopsFigure 1A shows a leaf with the radial topology including ILs. During any damage occurrence to any vein, the downstream parts continue living and receiving mineral materials and water because of having ILs (Katifor et al., 2010; Carson, 2010). Figure 1B depicts a leaf with a pure radial structure under damage. While damage occurs, all the downstream area of the injury point experiences a disconnection and consequently deprives of water and mineral materials. Thus, while a fault occurs, a vast area of system is lost.
.")
The conventional radial electrical distribution networks without ILs are similar to the leave shown in Figure 1B. If the topology of transmission lines changes similar to leaves with ILs shown in Figure 1A, it is possible to minimize the ENS.
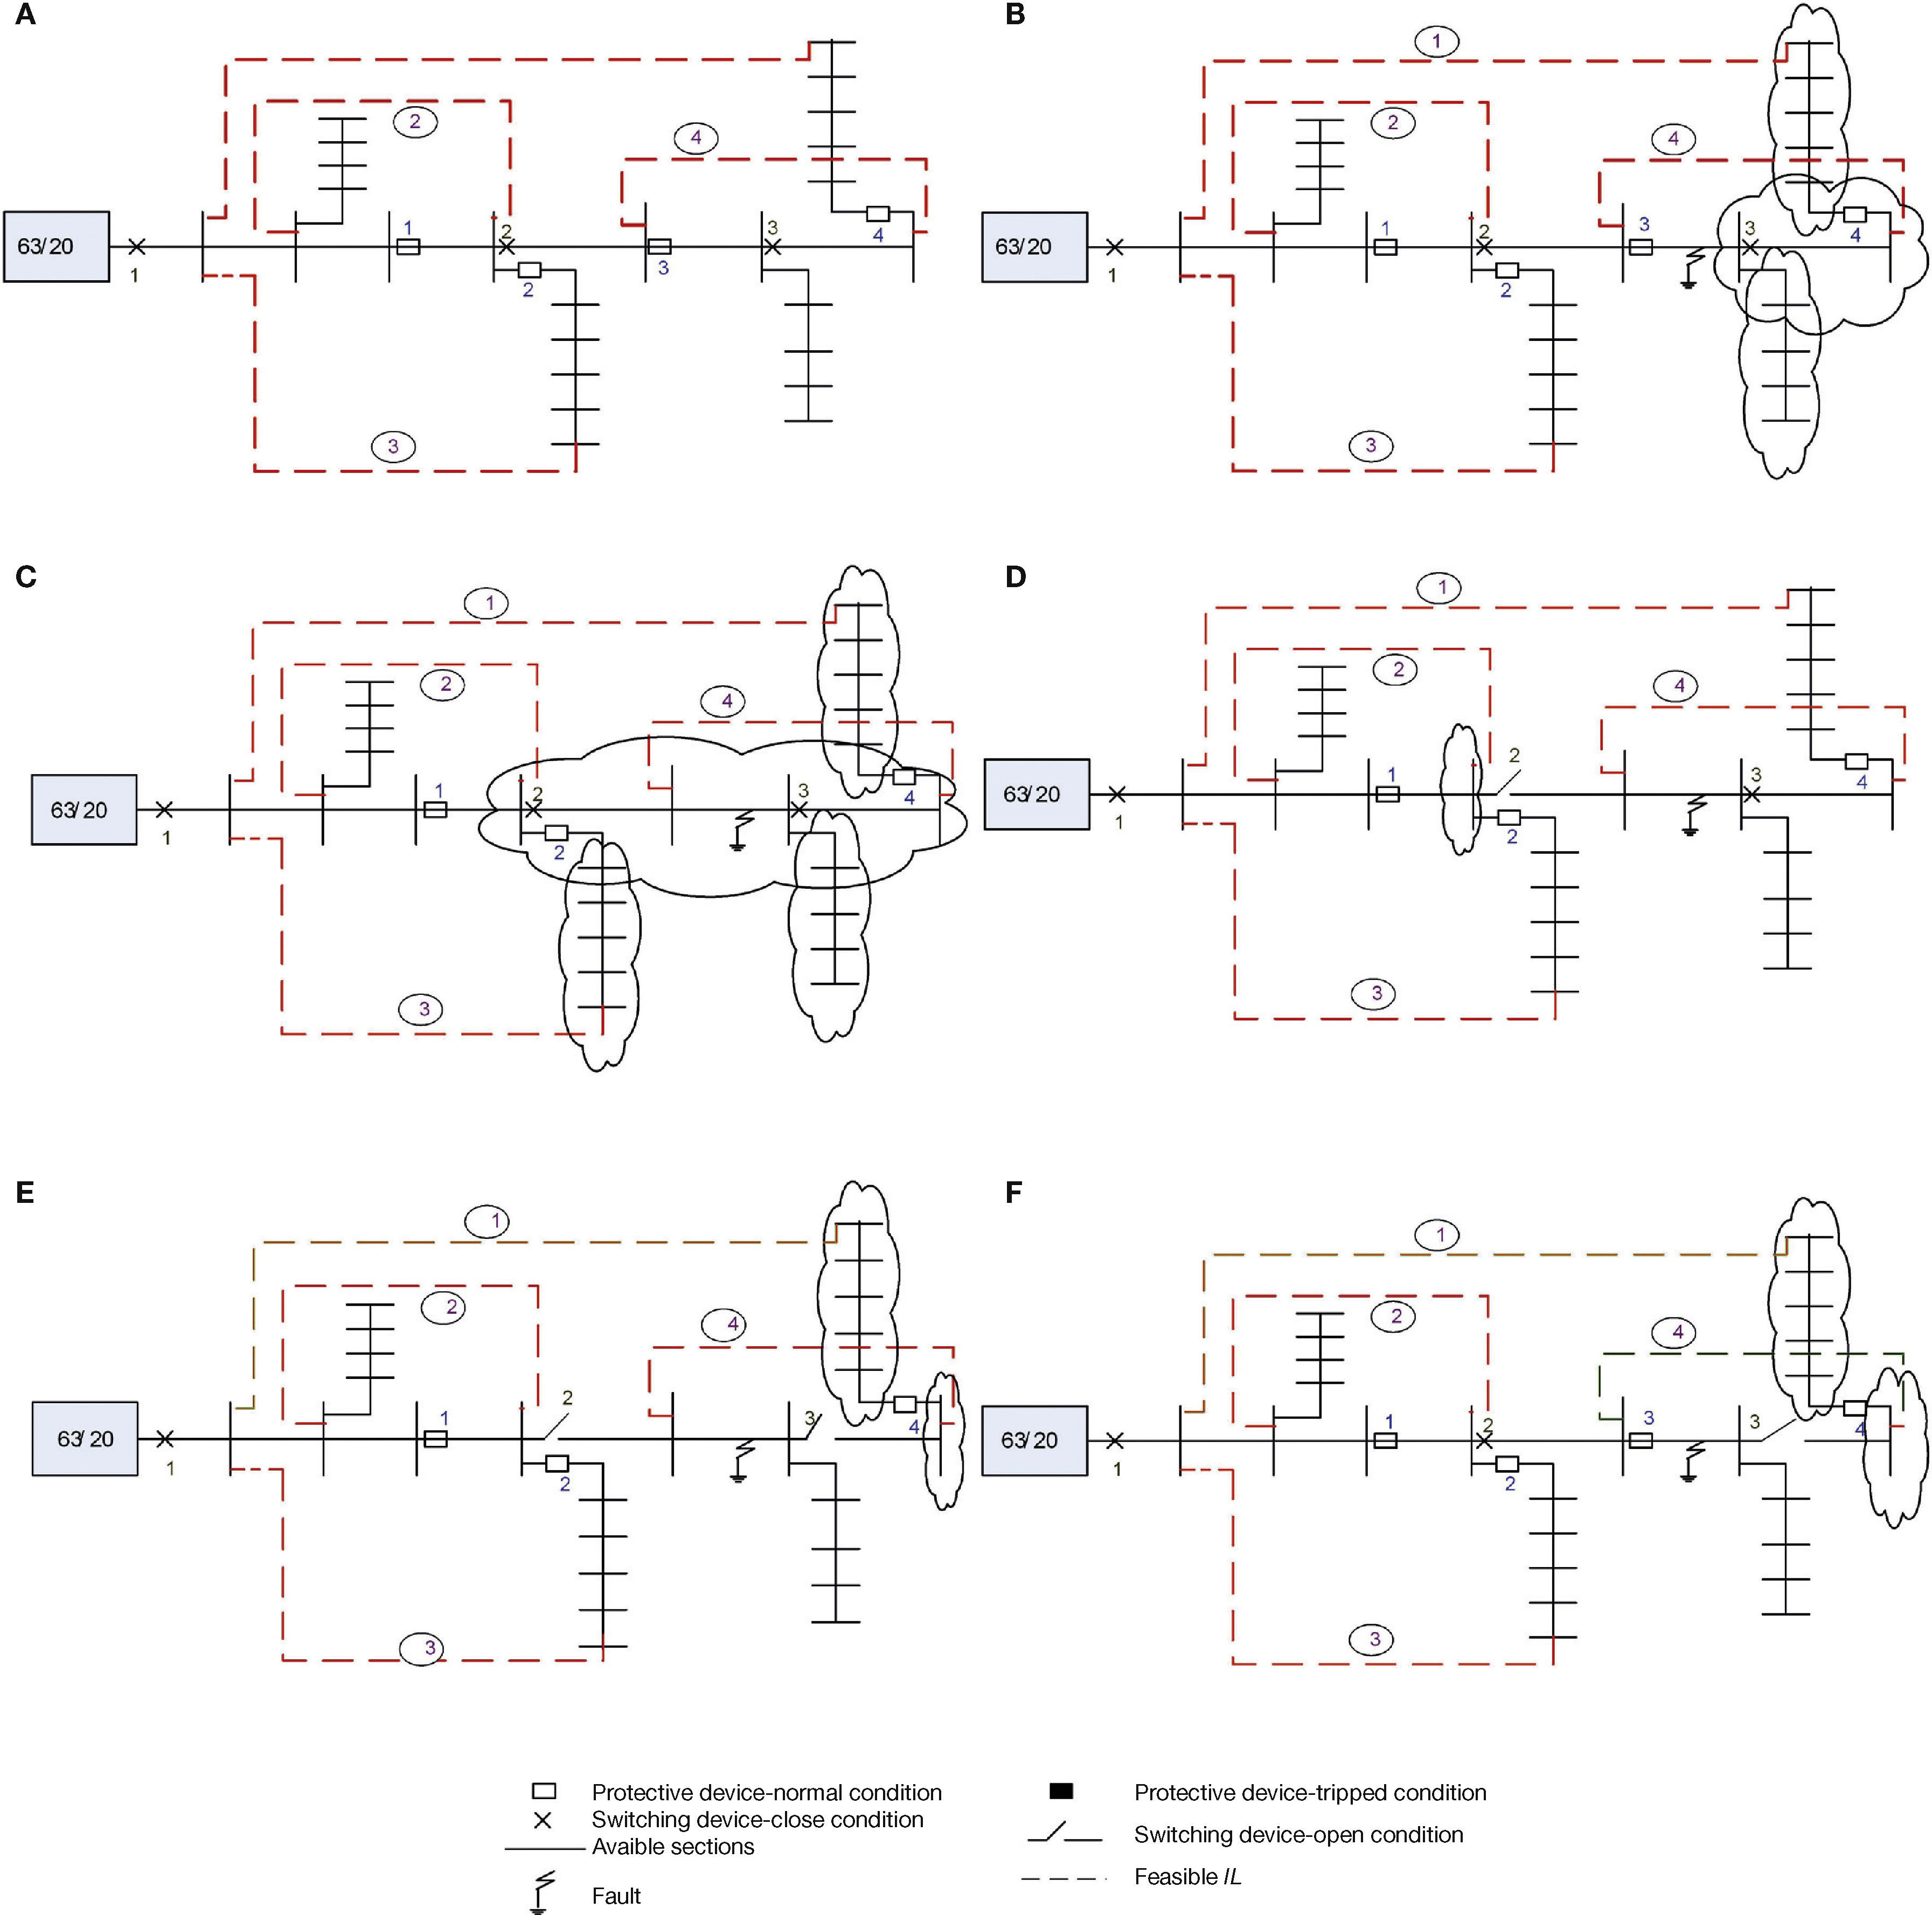
The advantages of ILs are explained on a typical distribution system as shown in Figure 2A . In this system, the fault is noticed by the first upstream protective device. If the protective device 3 exists, the connected loads to downstream lines in the main branch are disconnected, so do all the loads connected to the downstream lateral branches. Figure 2B shows the interrupted area due to a fault in a typical point of system.

Typical distribution system. A: pure radial system with possible ILs. B: interrupted area when a fault occurs in main sections of the radial distribution system. C: interrupted area in C while protective device 3 does not exist. D: restorable loads by switching process. R: possible restorable area by using IL 1. F: possible restorable area by using ILs 1 and 4 when protective device 3 exists.
The placement of the protective devices has a direct impact on ENS. The system during a fault occurrence and none-existence of protective device 3 has shown in Figure 2C to clarify the effect of protective device location on the ENS.
In addition, the placement of switches is another important parameter to restore a part of loads. In a pure radial structure (Fig. 2C), it is possible to restore a proportion of the installed loads in the lateral and main branches. The restorable loads derived by the switching process are shown in Figure 2D. If the switch 3 trips, it is possible to separate the interrupted area from the rest of the system. In the radial topology, the separation would not prevent the rest of the network from a blackout. But if the network topology changes into the leaves structure by the means of LFILs (Fig. 1A), these loads would be restorable
In Figure 2E, the restorable loads with ILs are depicted. In such system, while a fault occurs, the first upstream protective device of the fault location trips and the interrupted region is separated from the upstream parts of the system. Afterward, by using the switching device which is located between the upstream protective device and the interrupted area, some proportion of disconnected loads would be restored. The first downstream device of the fault location separates the already disconnected downstream region from the interrupted area. In this situation, if the sending bus of LFIL exists upstream of the nearest disconnecting switch to fault location and the first upstream protective device, also the receiving bus is placed downstream of the disconnecting switch, the downstream loads are restorable. Figure 2E depicts the situation that the protective device 3 does not exist, but it is possible to restore the downstream loads of switching device 3 by using LFIL 1.
In the typical test system shown in Figure 2F, the protective device 2 does not exist, but the restoration is obtainable through LFILs. In that condition, LFILs 1 and 4 enable the system to supply the downstream interrupted loads.
Besides the benefits of ILs such as reliability improvement and losses reduction, there are some negative effects on the operation of protective systems. Furthermore, imposing extra costs to system is inevitable. These costs are related to the construction cost of each line, increasing the cross section of some lines, necessary changes in the setting of the protective devices and consequently adding some directional protective devices.
3Restoration Modeling Using ILsWhen a fault occurs in the main or lateral sections, it is possible to restore some interrupted loads, satisfying the following conditions:
- A.
Existence of at least one switching device in downstream of the fault location.
- B.
Existence of the receiving bus of one LFIL at downstream of the disconnecting switch.
- C.
Existence of the sending bus of the IFIL, while condition B is true, at upstream of the first upstream protective device.
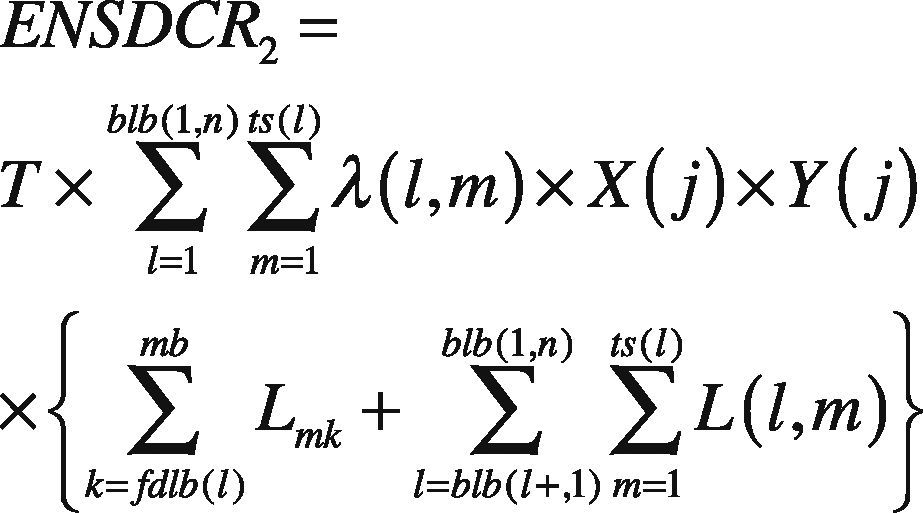
In Equations (1) and (2), the calculation of the restored loads by using ILs is explained. The faults are categorized into two groups: faults occur in main sections or lateral ones.
When a fault occurs in the j-th main branch with the failure rate λmi, all the downstream loads experience an interruption.
Term of ∑k=jmbLmk indicates the interrupted loads in main sections located in downstream of j-th section. Also, the term ∑l=blb(j,1)blb(j,n)∑m=1ts(l)L(l,m) is used to calculate the interrupted loads in lateral sections of the fault location. The interrupted loads caused by a fault in main branch can be restored if the values of X(j)×Y(j) is 1. The value of X(j)×Y(j) is 1 if and only if there is an IL that its sending and receiving buses are located in upstream and downstream of the fault location. Also, existence a switch between fault location and receiving buses of IL is necessary. Moreover, Eq. (2) is used to calculate the restorable loads under fault occurrence in lateral branches. The basic concept of mathematical expression of Eq. (2) is similar to Eq. (1).


The dimension of the matrices Info and Loopinfo and their corresponding parameters are presented in Eqs. (5) and (6).


Comparing to radial type or open-loop distribution systems, the investment cost of internal-loop distribution system will be increased (e.g. protective devices, circuit breakers, communication instruments). In this paper, a new objective function is proposed to optimize ILs including their profitability in order to reducing CENS and additional costs of system. In Eq. (7), the mathematical expression of proposed OF is given. The term ∑i=1mαi×Loopinfo(i,3) is added to OF which demonstrates the required additional costs. αi is a binary variable based on the existence or non-existence of i-th IL. If the i-th IL is selected according to each solution, the required additional cost is added to value of OF which performs as a penalty factor. MATLAB is used in implementing the GA to solve the discussed optimization problem. α is the matrix of decision making parameters which should be judged according to OF value. In GA, genes (αi) are packaged called chromosomes (α) that should be optimized. By investigating the α, it is possible to achieve the maximum benefits from implementation of ILs.

The OF is proposed based on the comparative method. So, the decrements of CENS and additional cost have been considered in the OF. Using an OF consisting CENS and total cost of system increases the complication of the calculations and modeling.
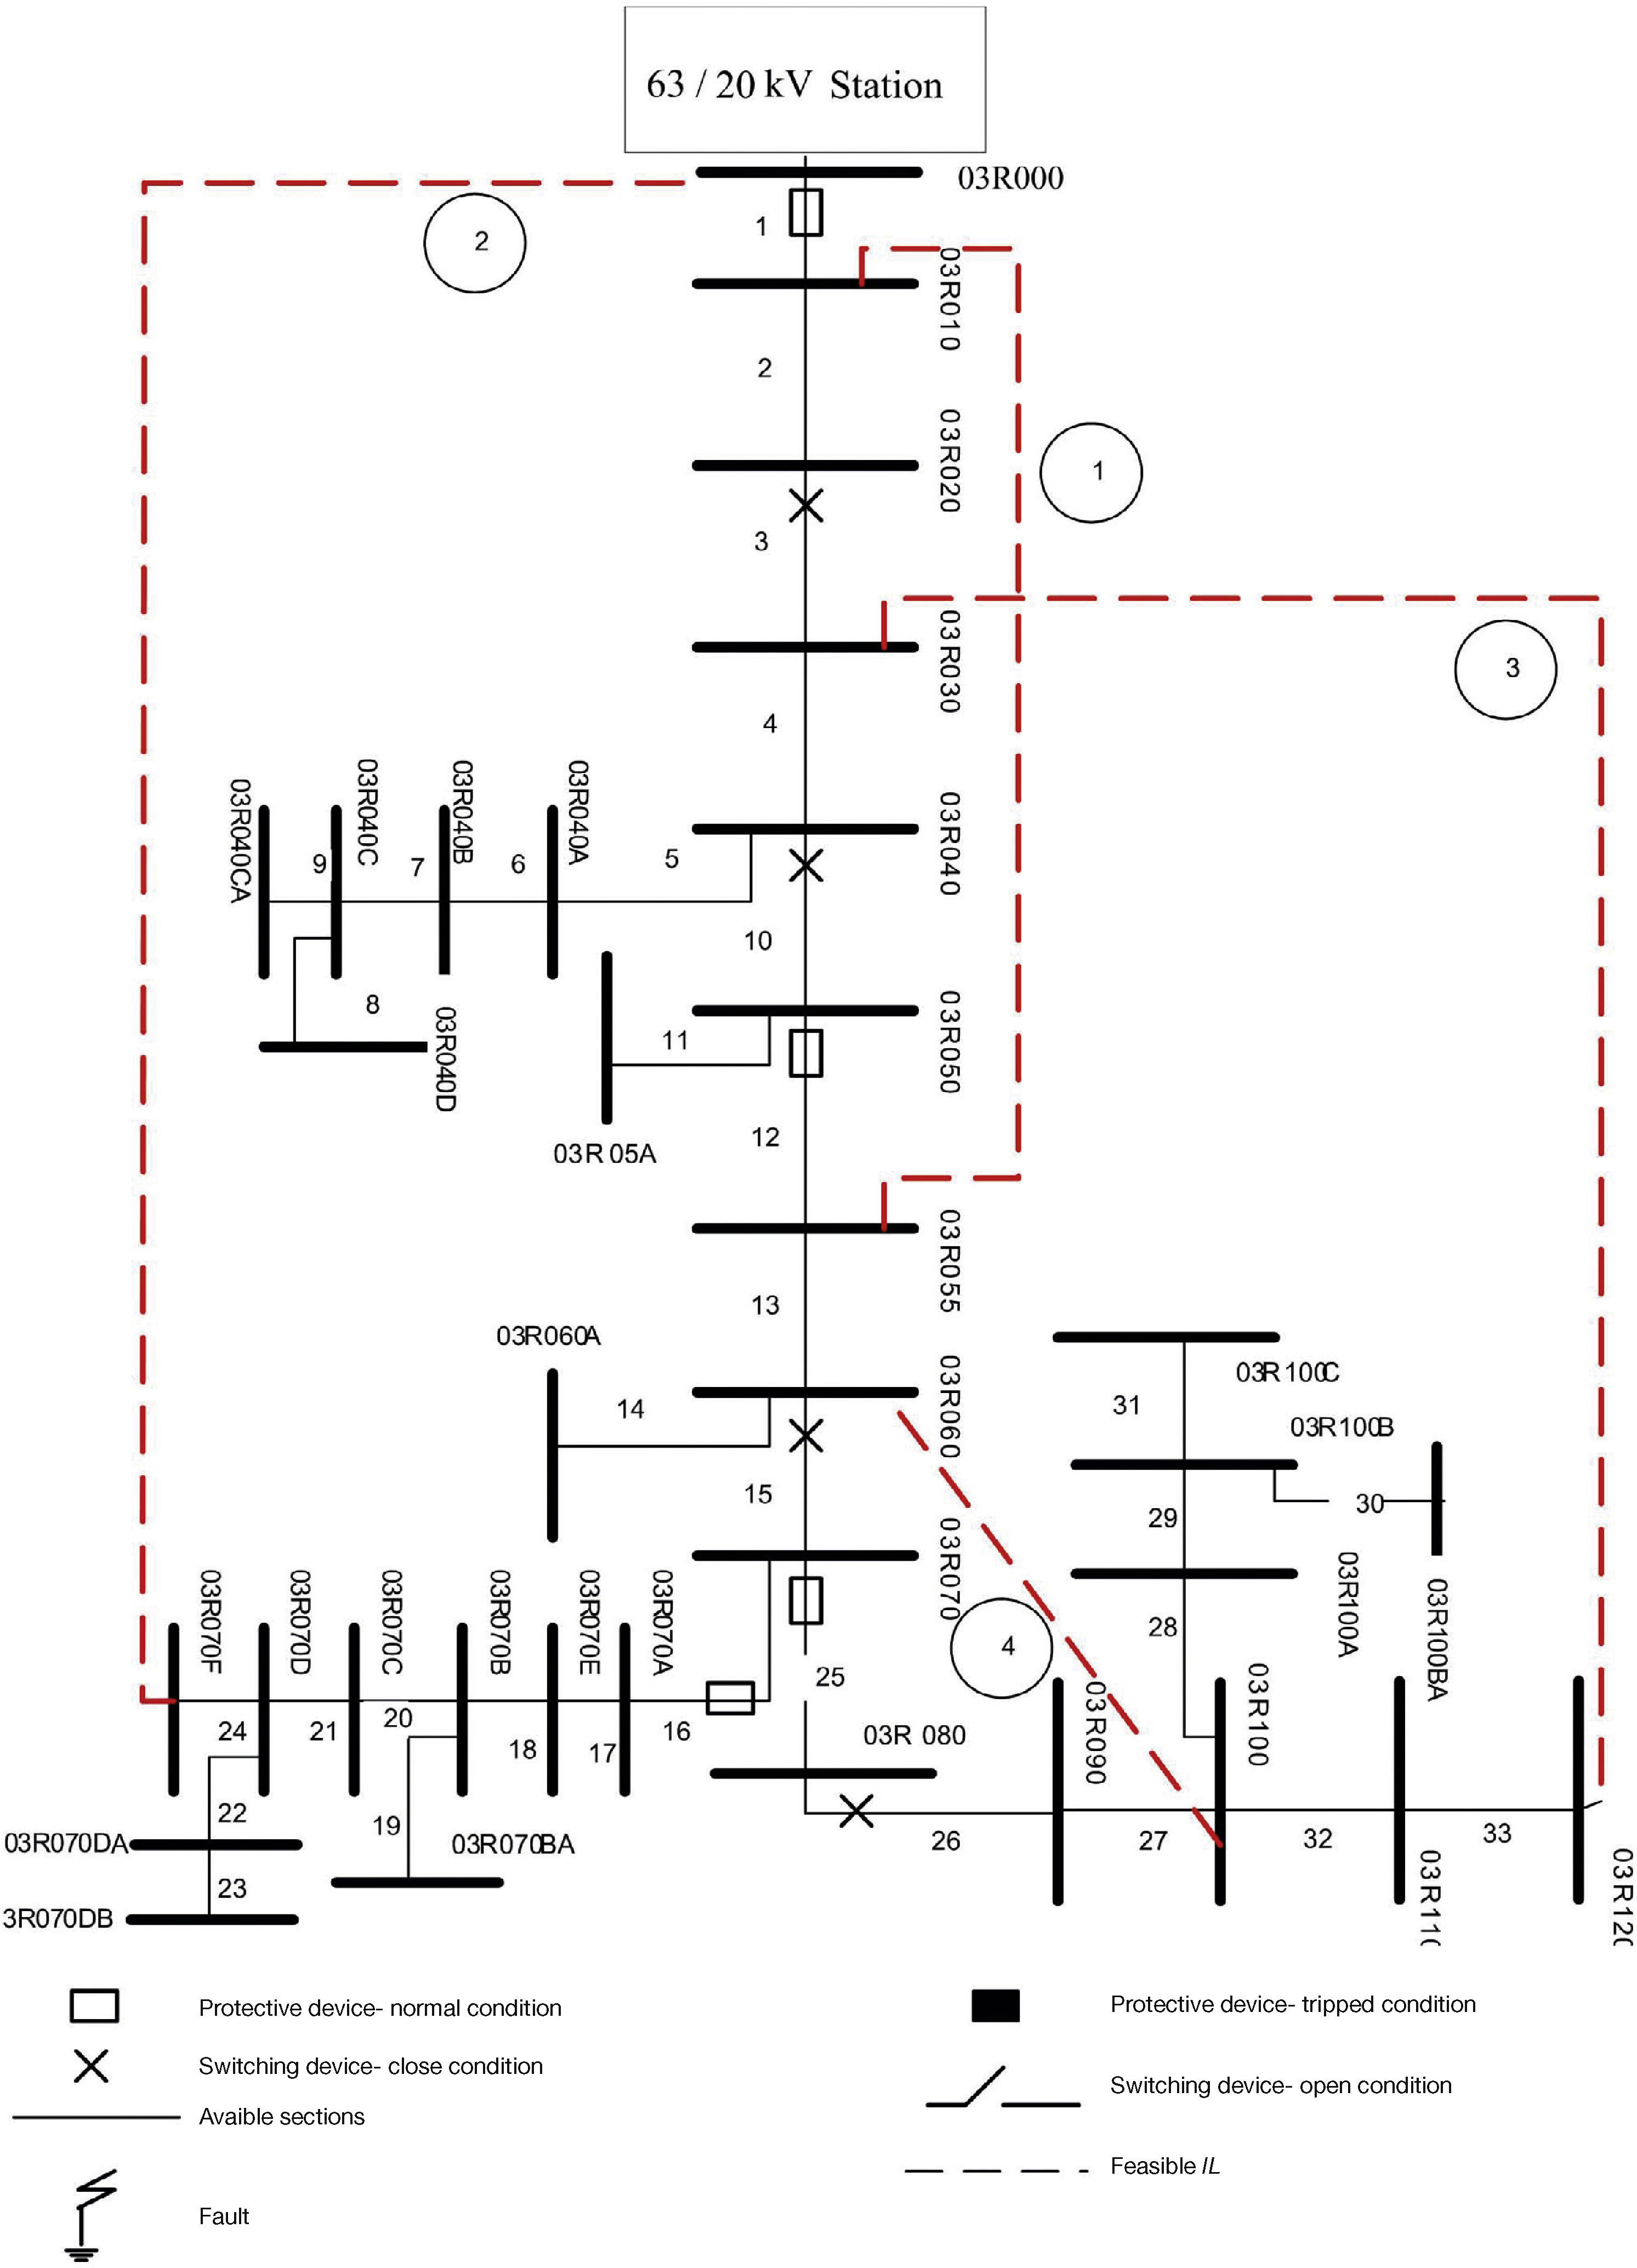
4Test ResultsThe proposed method is applied on a realistic distribution system of (TREC), which is shown in Figure 3.

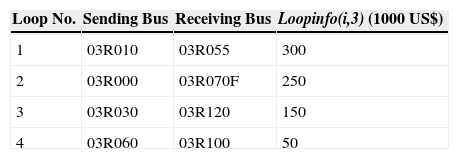
The test system data is given in Table 1. In this network, it is possible to form 4 ILs. The LFILs have been displayed with different color and their data are presented in Table 2.
20 kV distribution network data.
| Branch No. | Li (kVA) | Di (m) | λi (faults/year) | Info (i,3) | Info (i,4) | Sending Bus | Receiving Bus |
|---|---|---|---|---|---|---|---|
| 1 | 250 | 80 | 0.016 | 1 | 0 | 03R000 | 03R010 |
| 2 | 315 | 50 | 0.01 | 0 | 0 | 03R010 | 03R020 |
| 3 | 50 | 400 | 0.08 | 0 | 1 | 03R020 | 03R030 |
| 4 | 100 | 500 | 0.1 | 0 | 0 | 03R030 | 03R040 |
| 5 | 250 | 50 | 0.01 | 0 | 0 | 03R040 | 03R040A |
| 6 | 315 | 400 | 0.08 | 0 | 0 | 03R040A | 03R040B |
| 7 | 315 | 100 | 0.02 | 0 | 0 | 03R040B | 03R040C |
| 8 | 200 | 200 | 0.04 | 0 | 0 | 03R040C | 03R040D |
| 9 | 315 | 80 | 0.016 | 0 | 0 | 03R040C | 03R040CA |
| 10 | 100 | 230 | 0.046 | 0 | 1 | 03R040 | 03R050 |
| 11 | 100 | 210 | 0.042 | 0 | 0 | 03R050 | 03R050A |
| 12 | 25 | 400 | 0.08 | 1 | 0 | 03R050 | 03R055 |
| 13 | 100 | 1050 | 0.21 | 0 | 0 | 03R055 | 03R060 |
| 14 | 100 | 20 | 0.004 | 0 | 0 | 03R060 | 03R060A |
| 15 | 200 | 340 | 0.068 | 0 | 1 | 03R060 | 03R070 |
| 16 | 50 | 300 | 0.06 | 1 | 0 | 03R070 | 03R070A |
| 17 | 315 | 40 | 0.008 | 0 | 0 | 03R070A | 03R070E |
| 18 | 50 | 370 | 0.074 | 0 | 0 | 03R070E | 03R070B |
| 19 | 50 | 15 | 0.003 | 0 | 0 | 03R070B | 03R070BA |
| 20 | 200 | 100 | 0.02 | 0 | 0 | 03R070B | 03R070C |
| 21 | 100 | 10 | 0.002 | 0 | 0 | 03R070C | 03R070D |
| 22 | 100 | 30 | 0.006 | 0 | 0 | 03R070D | 03R060DA |
| 23 | 50 | 30 | 0.006 | 0 | 0 | 03R060DA | 03R060DB |
| 24 | 100 | 100 | 0.02 | 0 | 0 | 03R060D | 03R060F |
| 25 | 200 | 500 | 0.10 | 1 | 0 | 03R070 | 03R080 |
| 26 | 100 | 210 | 0.042 | 0 | 1 | 03R080 | 03R090 |
| 27 | 200 | 420 | 0.084 | 0 | 0 | 03R090 | 03R100 |
| 28 | 315 | 80 | 0.016 | 0 | 0 | 03R100 | 03R100A |
| 29 | 200 | 150 | 0.03 | 0 | 0 | 03R100A | 03R100B |
| 30 | 50 | 50 | 0.01 | 0 | 0 | 03R100B | 03R100BA |
| 31 | 100 | 125 | 0.025 | 0 | 0 | 03R100B | 03R100C |
| 32 | 315 | 180 | 0.036 | 0 | 0 | 03R100 | 03R110 |
| 33 | 200 | 220 | 0.044 | 0 | 0 | 03R110 | 03R120 |
The required cost of each LFIL has been calculated based on important concerns such as the base of construction cost of overhead or cable lines, development or changes in protection system, upgrading and improving the size of some conductors by collaboration with experts of TREC. The construction cost is the main part of the required investment regarding the IFIL.
The other important parameters of the optimization problems are the project lifetime and interruption costs. The lifetime of the project is considered 30 years. Also, the average interruption costs in a 10 years period for various types of costumers are presented in Table 3. The interruption cost is considered as 0.55 US$/kWh obtained by a statistical survey conducted in TREC.
This approach is based on using MATLAB in implementing the GA. The population size, elite count, crossover fraction of reproduction, migration fraction and generation size of GA are selected 100, 2, 0.8, 0.2, and 100, respectively.
The optimization results such as the cost of energy not-supplied decrement (CENSDR), energy not-supplied decrement (ENSDCR) and annual energy-not supplied decrement (AENS-DCR), annual cost of energy not-supplied decrement (ACENS-DR) and other optimal parameters are presented in Table 4.
It can be inferred that with the primary investment cost equal to 150,000 US$, the 6765 US$ ACENSDR is achievable by using optimum ILs.
The total derived profitability from the proposed method in the lifetime of the test system is 203,300 US$. The total profitability of the proposed method is the complement of the resulted value from the objective function. It is possible to calculate CENSDR by using Eq. (7). The proportion of the ENS is equal to the summation of the OF symmetry and the primary investment cost.
The optimum solution suggests creating an IL using LFIL 3. By compromising the different LFILs, it can be confirmed that IL 3 has the greatest advantages and priority to construct.
To obtain an analytical instruction in order to select the better alternative from the set of ILs, the capabilities of LFIL 3 which is suggested by the optimum results are described with more details. The sections 4-33 are located between the sending and receiving buses of LFIL 3. According to the location of protective devices, four areas are separable such as area 1 (sections 25-33), area 2 (sections 16-24), area 3 (sections 12-15), area 4 (sections 1-11).
The protective device of section 25 isolates all the loads of area 1, when a fault occurs in any section of area 1. If the fault has occurred in any sections 26-33, by switch of section 26 it is possible to disconnect the interrupted area from the network and the loads of section 25 can be restored from the main branch. While the fault has occurred in section 25, all the loads installed to sections 26-33 can be supplied through LFIL 3 using switch 26.
Also, occurrence of a fault in area 3 is possible. In this case, the protective device located in section 12 trips. When the fault is located in sections 12-14 and 15, the interrupted loads of sections 15-33 and 26-33 can be restored using switches 15 and 16, respectively.
Moreover, the protective device of section 1 trips due to a fault in any section of area 4. LFIL 3 just can be useful if the fault has occurred in section 10, in this state, by using of switches of sections 10 and 15, the fault area is isolated and the rest of loads are supplied through LFIL 3.
It should be noted that allocation of a protective device sometimes helps isolate the interrupted areas caused by the fault in lateral branches in the local area. Therefore, the adequate protection of lateral branches is inversely related to the importance of using ILs.
According to Eqs. (1) to (4) and optimization results, it should be derived that five factors are very important for LFILs to be useful in order to improve the system reliability and loads restoration:
- •
Required cost of each feasible LFIL.
- •
Number of protective and switching devices and amount of loads located in between the sending and receiving buses of LFIL.
- •
Ability to supply the loads in a bi-directional topology.
- •
Amount of loads installed to sections in downstream of the protective and switching devices which can be supplied by LFIL during emergencies.
- •
Failure rate and installed loads of the sections which are located between the first switch and protective device in downstream of the sending bus of LFIL.
In addition, in some distribution systems, there are some LFILs which are used to reduce the losses by system reconfiguration. In these cases, it is very important to choose the appropriate strategy during the interruption conditions. By codifying an appropriate instruction for operators on the basis of the analytical analyzing in this paper, selecting the best alternative is possible.
One of the most important advantages of the proposed method is this fact that the objective function is the coincidence and correspondence between the optimal result and the most economical design. This correspondence leads to the fact that this process and the results of the proposed method are operational in real systems.
Moreover, besides ILs required costs which are directly related to the length of the LFILs, the placement of protective devices and specially the placement of switching devices have a direct influence on ILs impacts tremendously. If the distribution network is an automated system using switching device for disconnecting the interrupted area, the amount of CENSDR using ILs would be enhanced significantly.
The results and the total implementation interest approve the proficiency of the reliability improving proposed method using ILs which is adopted from the leaves topology. Distribution systems are more similar to the leaves with ILs leads on to more reliability improvement.
5ConclusionsThe tree leaves vessel topology is an eminent instance for a natural optimal system. The leaves vessel system has many considerable similarities with transportation systems and electrical distribution networks. A leaf with ILs is an optimal system from loss and reliability point of view. In such systems during a failure or damage occurrence, the interrupted area is restricted in a minimum place, and other parts of system continue to live. This paper focused on proposing a novel method to optimize the reliability of distribution systems using ILs like leaf as a natural optimum system.
Despite many advantages of ILs in electric distribution system, ILs may impose some additional costs. It is essential to determine the optimal ILs and their allocations in order to obtain the desired reliability indices with a reasonable cost. The purpose of this paper is presenting a novel method to find the best solution for using the ILs based on the reliability and economic aspects.
In the proposed method, a novel OF consists of ILs profitability and costs. Using the ILs as an approach to improve the reliability of distribution system in compare to other conventional approaches like protective device allocation and using DGs is a contribution of this paper.
In the proposed method, instead of computing the CENS as saved cost through using the ILs, the reduction of CENS (CENSDR) is investigated which simplifies and accelerates the calculations. Since the method has been proposed according to economic studies and cost-benefit analysis, it can be more interesting in compare to ones just consider the reliability indices. The proposed method has been applied on a realistic electrical distribution system of TREC. The test results prove the proficiency of the method for the system cost reduction and reliability improvement. The test results confirm that through using the ILs based on the optimum solution, the considerable reliability improvement and economic benefits are achievable while the required additional investment is reasonable.