


Edited by: Abbas Mardari
Last update: July 2022
More infoThe digitalization of higher education (HE) institutions and relevant issues have attracted the attention of many educational stakeholders. ICT has become a subject of high importance in every context, particularly in the workplace; thus, a principal goal for universities and schools is to prepare future professionals capable of dealing with problems and searching for effective solutions by their digital competence as a key skill. In this regard, a new framework is developed to evaluate the main drivers of digital transformation in higher education institutions (HEIs) in the era of industry 4.0. The developed framework is proposed a decision approach that can effectively use the presented information to make decisions of high rationality. This framework is applied to compute the subjective and objective criteria weights, and it is used to assess the preferences of organizations. An empirical case study to evaluate the main drivers for the implementation of digital transformation in HEIs is taken. According to the findings, the most significant drivers for the implementation of digital transformation in HEIs in the era of Industry 4.0 are developing, updating, and adapting a curriculum (0.0425), integration of digital technologies for universal education (0.0420), and cloud computing (0.0419), respectively. Hence, the evaluation results also show that the option higher education institution (HEI)-4 has the highest overall utility degree (1.845) over different drivers for the implementation of digital transformation in HEIs in the era of Industry 4.0. Also, comparison and sensitivity investigation are made to show the superiority of the developed framework.
In recent years, higher education institutions (HEIs) have been flooded by many technological advancements mostly induced by the Industrial Revolution 4.0; this situation has forced HEIs to deal with a digital transformation in all dimensions (Benavides et al., 2020). Therefore, numerous researchers have attempted to investigate the best way to apply the digital transformation approaches to HEIs and, this way, to shed light on the complicated relationships between different actors playing roles within an education domain supported by state-of-the-art technologies. The development of ICT skills development is known as vital to the complete and active societal participation of students in the future (OECD, 2015a, 2015b); on the other hand, the use of digital media in teaching and learning cannot necessarily guarantee their active engagement (Kirkwood, 2009) or high achievement (Tamim et al., 2011). Note that change does not occur simply by being only in contact with new technologies (García et al., 2015); rather, it is important for teachers to have pedagogical competence in the use of educational technology (Englund et al., 2017; Javed et al., 2022; Kirkwood & Price, 2005; Ng, 2012) and also to model acceptable digital citizenship (Choi et al., 2018). Academic findings have revealed that novice teachers are more adaptable to rapid changes and developments in comparison with more experienced ones (Englund et al., 2017). The experienced teacher has indicated that the lack of digital skills prevents them from implementing educational technologies in their classrooms; another problem stated them is systemic problems, for instance, inaccessibility of technology and workload (Jääskelä et al., 2017; Majid et al., 2022; Marcelo & Yot-Domínguez, 2019; Margaryan et al., 2011). Recently, a survey was conducted on the UK digital education organization Jisc, with over 22,000 students from 74 UK and 10 international organizations. The findings revealed that the full benefits of technology in learning contexts had not been realized yet, and technology is more commonly implemented in these contexts for convenience rather than for pedagogy effectiveness (Newman & Beetham, 2017).
Innovations created by educational technologists often are not adopted spite many effective educational technology innovations (Archer et al., 2014; Tatar et al., 2008) and an increasing willingness of educational institutions the implementation of technology (Cheung & Slavin, 2013). As predicted by the diffusion of innovation theory, the innovation adoption rate could be increased if teachers perceive that innovations are capable of solving their challenges (Rogers et al., 2014). Educational technologists desire that their proposed technologies be used long-term or well-integrated into educational processes (de Koster et al., 2017). To this end, the diffusion of innovations literature urges the need for understanding the challenges perceived by teachers in classroom practices, designing effective technologies helpful in coping with such challenges, and communicating these benefits (Zaritsky et al., 2003). It is important for educational technologists to make a balance among the requirements of multiple stakeholders (Easterday et al., 2018), especially those who are responsible for adopting technology in a classroom. As a result, a good starting point for encouraging the use of educational innovations is an empirical framework that describes the teachers’ perceived challenges in this context.
At present, the technological adoption of universities is connected to a paradigm shift, where technology is regarded as a complicated and interconnected environment that allows digital learning (Mahlow & Hediger, 2019). Additionally, the interest is concentrated more upon learners than the technology itself and the learning experiences it brings into the classroom. Digitalization refers not only to the transformation of not just work environments but all facets of society. More specifically, regarding the educational context, transformation occurs with or without strategic initiatives ensuring the ongoing quality of teaching/learning environments. The education field is essentially reactive, as novel disruptive technologies are developed in other industries and then applied to current educational cultures and systems.
In the recent decade, digital transformation (DT) has been recognized as a priority for higher education institutions (HEIs); this process is necessary for all the organizations claiming to be change leaders and competitive in their relevant domains (Abad-Segura et al., 2020; Alhubaishy & Aljuhani, 2021; Rof et al., 2022). Therefore, several researchers have focused on the definition of DT in business (Ballestar et al., 2021; Ha & Thanh, 2022; Heredia et al., 2022; Skare & Riberio Soriano, 2021; Windasari et al., 2022). For instance, Matt et al. (2016) asserted that DT is concerned with the changes brought by DTs in a firm's business model, which can lead to product modifications, organizational structure, or the automation of processes. After that, Gobble (2018) defined DT as “the profound transformation of business activities and organizations, processes, competencies and models, for the maximum transformation of the changes and opportunities of a technology mix and its accelerated impact on society, in a strategic and prioritized way”.
To persist in time, HEIs require evolving in an integral manner. Additionally, two challenging tasks are to effectively exploit all the changes provided by the wealth of DTs and redefine the entire business models across the whole value chain. Such drivers are more persistent in the case of those organizations that are enduringly attempting to make sure of their competitive positions in the international market. Note that a similar concern is arising for universities as they get increasingly involved in the competition for the selection of the best researchers and students (Faria & Nóvoa, 2017). However, numerous universities attempt to develop definite digital strategies to be well adapted to the substantial changes in the use of new technologies; these institutions still lack the capability, vision, or commitment to the effective implementation of these technologies (McCusker & Babington, 2015). In this regard, there is a need to gain an inclusive vision of the whole DT in HEIs in a way to achieve an overview of the current state of DT in these institutions. It is also important to identify the distinctive features of DT, such as actors, dimensions, and implementations when it occurs in an HEI. Remember that DT in HEIs has been investigated from various points of view and the literature still lacks a consensus on its definition.
The world faces increasing the “wicked challenges”, which necessitates preparing adequate university graduates with a range of collaborative and interdisciplinary skills (Oliver & Jorre de St Jorre, 2018). In this sense, many scholars have stressed the high significance of ICT skills and the digitalization of HEIs; Many national, international, and European policies have acknowledged “the need to equip all citizens with the necessary competencies to use digital technologies critically and creatively” (European Joint Research & Redecker, 2017). Furthermore, many findings have revealed that there is an association between higher levels of ICT skills and higher levels of wages (Falck et al., 2021) and on the other side, there is the risk of job loss in the future because of the growth of computerization and automation (Bond et al., 2018). As a result, HEIs need to adopt effective digitalization strategies that could support various 21st-century skills in a way to enable students to implement technology flexibly, innovatively, and adaptively (Oliver & Jorre de St Jorre, 2018).
The studies discussed above indicated that DT needs to be established based on the axioms of connectivism in order to satisfy what different interest groups generally expect in the social, economic, and environmental aspects (Shrivastava, 2018). HEIs will invest in implementing and growing clean technologies in their activities and manage the dissemination of such technologies (Formánková et al., 2018). Clean technology (which is also called environmental technology, green technology, or environmentally-sound technology) refers to those technologies that attempt to decrease the adverse impacts on the environment by some enhancements to energy efficiency, sustainably utilizing the available resources, or taking action in some activities to protect the environment. They produce lower amounts of pollution, use the existing resources more sustainably, and recycle/handle more waste. Similarly, clean technologies could be developed based on the evolution of information and communication technologies (ICT). HEIs are increasingly accepting telecommunications services that are typically hosted online in the cloud; this way, they remove additional physical devices and hardware (Babbitt, 2018). This paper aims to investigate the trends in the DT of HE to analyze the impacts of implementing new technologies by HEIs. Thus, we have developed a new approach to the MCDM method in this study. Further, we aim to conduct a survey study to identify the main drivers for implementing DT in HEIs in the era of Industry 4.0. Therefore, the main objectives of this paper are provided below:
- -
To recognize the drivers of DT in HEIs using a survey method based on the current literature review and interviews with experts.
- -
To propose a comprehensive approach to evaluate the main drivers for the implementation of DT in HEIs.
- -
To introduce the new framework to identify and evaluate the related drivers of DT implementation in HEIs.
- -
The developed framework is utilized to evaluate and rank the main drivers for the implementation of DT in HEIs in the era of Industry 4.0.
The remaining paper is organized in the following sections. Section 2 discussed the main drivers of digitalization in higher education. Section 3 provides the introduced q-ROF-MEREC-SWARA-CoCoSo method. Section 4 presents the results of the study, the case study, the sensitivity analysis, and the comparison. Finally, section 5 discusses the conclusion of the study.
Digitalization drivers in higher educationIn recent decades, universities have experienced considerable changes due to the social/technological trends toward digitalization. Like all revolutions, DT has intensely readjusted all societal sectors (Abad-Segura et al., 2020). Accordingly, digitalization is a key factor in HEIs, which can attract students and improve their experiences with academic courses, teaching/learning materials, and training procedures in general (Gurung & Rutledge, 2014). Digitalization in HEIs helps to monitor the training hindrances easily and decreases the risk in the university. On the other hand, the literature shows that many HEIs managers are still reluctant to comprehend well and use the opportunities to adopt such a digital environment. Oliveira and de Souza (2021) assert that DT involves changes to the organization of work, which are principally induced by developing digital technologies and innovations in business models. DT essentially refers to something more than the use of a technological solution; rather, it can be recognized as an alignment among three factors, i.e., digital technologies, human beings, and organizational factors. Mahlow and Hediger (2019) believe that DT brings about novel skills and models by means of digital technologies in a strategic and deep way. Education 4.0 plays a leading role in the emerging educational paradigm by applying relevant skills based on the requirement for improving and requalifying, unlearning, and relearning (Hong & Ma, 2020).
DT was defined by Grab et al. (2019) as an element disruptor that causes fundamental changes to entire industries and organizations. According to Bresinsky and von Reusner (2018), digitized organizations must be well-focused on social and technology domains to have a successful transformation. Furthermore, some other scholars (Bygstad et al., 2022; Kuhn & Lucke, 2021; Núñez-Canal et al., 2022; Pham et al., 2021; Sanz et al., 2017; Welsh et al., 2016) consider that DT in HEIs from a renewal business prototype viewpoint are allied with technological trends. Moreover, Rodrigues (2017) identified important elements that are generally intricate in the DT process, e.g., people, strategies, structures, processes, and competitive dynamics. In another research, Sullivan and Staib (2018) and Kaminskyi et al. (2018) considered a social aspect intervening in the DT processes and investigated how DT can improve or replace conventional services/products. Furthermore, Faria and Nóvoa (2017) described DT as a phenomenon that created additional and differentiated value and extended the domain of DT in HEIs to the interactions between a firm and its customers, suppliers, and competitors. In another research, Elena (2017) inspected DT from the education perspective and studied how to integrate digital technologies with teaching, learning, and organizational practices.
The pedagogical forms range is experiencing a substantial expansion, including the illustrations, videos, or presentation materials, the direct link to different databases and information networks, and the chance to get integrated into network communities (Petrova & Bondareva, 2019). Recently, numerous researchers have focused on the digitalization of education with the use of virtual reality (VR) technologies. After the study of Williams (2002) was published, the challenges in relation to access intensified because any technological growth needs Internet connections of higher speed and stability. E. McGovern examined the role of digitalization in forming the students’ soft skills, for instance, participation in public speaking sessions, business negotiations, and communication, as well as preparing presentations. According to Williams et al. (2002), the notion of participation refers to the challenge of the achievement of complete participation of both instructors and students in learning environments improved by technology. Moreover, VR technologies help learners to self-assess their own skills, check the direction of their progress, and adapt to the available training programs (McGovern et al., 2020).
Pensel and Hofhues (2017) called for learning/educational environments improved by new digital technologies based on those theories that give a central role to the learner instead of the teacher. This could be applied to both formal and informal learning environments, as only concrete actions can build relationships between the self and the external world. Boelens et al. (2017) summarized the challenges that may arise in blended learning settings in four areas. At first glance, these four areas seem primarily pedagogical; however, the technology and access issues are indirectly understood as part of all challenge areas. After that, in complementing research, Detyna and Kadiri (2020) showed the benefits of applying VR technologies, for example, higher motivation and engagement of learners. Basically, based on the studies reviewed above, the challenges that have arisen in the area of technology (which have caused the improvement of education with digital, online, and e-learning formats) are either pedagogical or technological. However, according to the above discussion, this study used the current literature review to identify the important drivers of digitalization implementation in higher education. The identified drivers are innovation approaches; augmented reality; digital technologies design; technological resource management; computational thinking; development education 4.0 strategy; 5G networks; creative problem solving; adaptability; creativity; digital games; using innovative pedagogical approaches; social networks; critical thinking and analytical thinking; teamwork; integration of digital technologies for universal education; artificial intelligence; improving the educational experience; using digital technologies using innovative assessment methods; cloud computing; develop, update and adapt curriculum and using digital technologies for educational communication software.
Proposed q-ROF-MEREC-SWARA-CoCoSo methodThough, in MCDM, some cases may occur in which the decision experts (DEs) may give the value to which an option Si holds the attribute Tj is 0.6, and the value to which an option Si nullifies the attribute is 0.9. However, PFS and IFS cannot address such conditions since 0.6+0.9>1 and 0.62+0.92>1. To compensate for this inefficiency, Yager (2017) suggested the idea of q-rung orthopair fuzzy sets (q-ROFSs), also depicted by BD and ND. q-ROFSs fulfill a constraint that the sum of the qth power of BD and ND are less than or equal to 1, where q ≥ 1. Thus, q-ROFS is a tool of higher flexibility and applicability in handling higher levels of uncertain information. In recent years, many researchers have focused on the q-ROFSs environment. Mishra and Rani (2021) suggested an additive ratio assessment (ARAS) model to solve the problem of sustainable recycling partner (SRP) selection problem.
DEs, in an MCDM process, normally place a high significance on the criteria weights that are described in the literature as objective and subjective weights. Kersuliene et al. (2010) proposed the Stepwise Weight Assessment Ratio Analysis (SWARA) approach to compute the subjective weights. Compared to different tools, such as the analytic hierarchy process (AHP), SWARA offers simpler computational processes. In contrast to AHP, there is no need for many pairwise comparisons in SWARA, and SWARA is more consistent. Rani et al. (2020) utilized the ARAS framework to assess the methods previously suggested for treating healthcare wastes on PFSs. In recent years, an innovative MCDM approach, called combined compromise solution (CoCoSo), was proposed by Yazdani et al. (2019), which combined the compromised algorithm with various procedures to obtain a compromise solution. Recently, Liu et al. (2021) made some assessments and selections of the best medical waste treatment method with the help of the Pythagorean fuzzy CoCoSo approach. This section briefly presents the developed method on q-ROFSs as follows:
Consider ξ={z1,z2,...,zn} be a finite discourse set. A q-ROFS ‘M’ in ξ is defined (Yager, 2017) as M={(zi,μM(zi),νM(zi))|zi∈ξ}, where μM(zi)∈[0,1] and νM(zi)∈[0,1] signify the BD and NBD of zi∈ξ, respectively, with 0≤(μM(zi))q+(νM(zi))q≤1, and q≥1. The indeterminacy degree is defined as πM(zi)=1−(μM(zi))q−(νM(zi))qq,∀zi∈ξ. Also, the q-ROF number is denoted by φ=(μφ,νφ). To discriminate the various q-ROFNs, the score and accuracy values are defined as (Liu & Wang, 2018)

For any two q-ROFNs φ1=(μφ1,νφ1) and φ2=(μφ2,νφ2),
- lowerRoman(%1)
IfS(φ1)>S(φ2), then φ1>φ2,
- lowerRoman(%1)
IfS(φ1)=S(φ2),then
- (a)
if ℏ(φ1)>ℏ(φ2), then φ1>φ2,
- (b)
if ℏ(φ1)=ℏ(φ2), then φ1=φ2.
Next, the procedure of the proposed q-ROF-MEREC-SWARA-CoCoSo method is given by
Step 1: Make a linguistic decision matrix (LDM)
A set of ℓ "decision experts (DEs)"A={A1,A2,...,Aℓ} assess the m choices I={HEI1,HEI2,...,HEIm} over n criteria D={d1,d2,...,dn}. Assume that Z(k)=(ξij(k))m×n,i=1,2,...,m,j=1,2,...,n be the suggested LDM by DEs, where ξij(k) state the ratings of an option HEIi over a criterion dj in the form of linguistic values (LVs) given by kth expert.
Step 2: Computation of the expert weight
To obtain the DEs’ weights, the importance ratings of the DEs are provided as LVs and then expressed by q-ROFNs. Let Ak=(μk,νk) be the q-ROFN, and then the weight is estimated by

Here, ϖk≥0 and ∑k=1ℓϖk=1.
Step 3: Create the aggregated-q-ROF-DM
To create the A-q-ROF-DM, a q-ROF-weighted averaging (q-ROFWA) operator is applied, and then Z=(ξij)m×n, where

Step 4: Proposed q-ROF-MEREC-SWARA weighting method
All the criteria are not presumed to be of equal importance. Suppose w=(w1,w2,...,wn)T is the weight of the criterion set with ∑j=1nwj=1 and wj∈[0,1].
Case I
Determination of objective weights by MEREC
Now, to find the criteria weights, the classical MEREC (Keshavarz-Ghorabaee et al., 2021) model is extended under the q-ROFSs environment. In the following, the procedure of the MEREC is presented by
Step 4a: Normalize the q-ROF-DM.
In this step, a normalized A-q-ROF-DM N=(ςij)m×n is obtained. If db shows the benefit-type criteria set and dn represents the cost-type criteria set, then we utilize the following equation for normalization:

Step 4b: Find the score matrix.
With the use of the following formula, the score matrix Ω=(ηij)m×n of each q-ROFN ςij is calculated:

Step 4c: Compute the overall performance of the alternatives.
This study uses a logarithmic measure with equal criteria weights to achieve the overall performance of the alternatives. Based on the normalized values attained from the former step, it can be ensured that the smaller values of ηij yield greater performance values. This computation can be done using Eq. (6) as follows:

Step 4d: Compute the performance of the alternatives and the removal of each criterion.
This step involves the use of the logarithmic measure in a way similar to the former step. This step and Step 3 are different in the fact that the computation of the performance of the alternatives is done based on the separate removal of each criterion. Thus, there will be n sets of performances accompanied with n criteria. Let Si′ signify the overall performance of the ith alternative concerning the jth criterion removal. Eq. (7) is applied to computations performed in this step:

Step 4e: Compute the summation of absolute deviations.
In this step, we calculate the removal effect of the jth criterion based on the values obtained from Step 3 and Step 4. Let Vj denote the effect of removing jth criterion. We can calculate the values of Vj using the following formula:

Step 4f: Measure the final criteria weights.
The objective weight of each criterion is computed with the removal effects (Vj) of Step 5. In the following, wjo represents the jth criterion's weight. Eq. (9) is applied to the computation of wjo as follows:

Case II
Determine the subjective weights by the SWARA method
Step 4g: Estimate the crisp degrees. Eq. (1) is used to calculate the score degrees S(ξkj) of q-ROFNs.
Step 4h: Prioritize the criteria. The prioritization of the attributes is done on the basis of the DE's preferences, from the attributes of the highest significance to those of the lowest significance.
Step 4i: Assess the comparative coefficient κj as follows:
where σj symbolizes the importance rating.
Step 4j: The recalculated weight ρj is defined by
Step 4k: Calculate the overall weight. The attribute weights are estimated as


Case III
Integrated weights using the q-ROF-MEREC-SWARA approach
In the A-q-ROF-decision matrix, the decision maker wants to utilize both subjective and objective weights, for the following integrated weighted equation is given.
where τ is an objective factor and τ∈[0,1].wjo represents the objective weight and wjs represents the subjective weight, respectively.
Step 5: Make a normalized A-q-ROF-DM (NA-q-ROF-DM)
The NA-q-ROF-DM N=(ςij)m×n is obtained from Z=(ξij)m×n, and is given by

Step 6: Assess the weighted sum and power weight measures
The weighted sum measure (WSM) Ci(1) and weighted power measure (WPM) Ci(2) for each alternative are estimated as


Step 7: Relative compromise ratings of each option
The following relative compromise degree for assessing each option is derived as follows:
where, ϑ is the strategy coefficient, and ϑ∈[0,1]. Generally, we take ϑ=0.5.


Step 8: Estimate the compromise degree
The overall compromise degree βi,i=1(1)m, is estimated by

The sorting of alternatives by decreasing the compromise degree βi,i=1(1)m.
Case studyIn this study, four steps methodology was conducted to collect the data. In the first step, an extensive survey using the current literature review and interviews with experts has been conducted to identify the main drivers to evaluate digital transformation in higher education institutions in the era of industry 4.0. In the second step, a comprehensive framework is developed to analyze and examine the important drivers for digital transformation in HEIs in the era of industry 4.0. In this regard, 27 drivers are identified to evaluate digital transformation in HEIs. In the third step, we proposed a new fuzzy decision-making approach using the q-ROF-method based on MEREC-SWARA-CoCoSo models. In this approach, the q-ROF-MEREC-SWARA is applied to compute the integrated weight of drivers for digital transformation in HEIs in the era of industry 4.0 by combining the subjective and objective weights, and the CoCoSo model is used to assess the preferences of organizations. In the fourth stage, a questionnaire is developed to collect data from academic experts. To do so, ten academic experts are invited to rank the main drivers for assessing the digital transformation in HEIs. After two-time remainders to the related experts, finally, we could collect the data from four academic experts; these four academic experts had several years of experience in the HEIs and digital services.
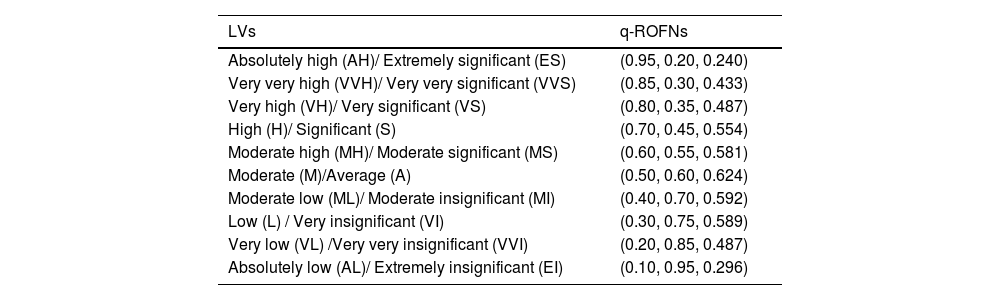
Result and discussionTable 1, adapted from Zhang et al. (2022), depicts the significance of the DEs and attributes in the form of LVs and then converted into q-ROFNs. Table 2 presents the DEs weight based on Table 1 and Eq. (2). Table 3 defines the importance of DEs to evaluate the options and the assessments of options concerning each driver for the implementation of DT in HEIs in the era of Industry 4.0.
Performance ratings of alternatives over criteria and DEs regarding the LVs.
| LVs | q-ROFNs |
|---|---|
| Absolutely high (AH)/ Extremely significant (ES) | (0.95, 0.20, 0.240) |
| Very very high (VVH)/ Very very significant (VVS) | (0.85, 0.30, 0.433) |
| Very high (VH)/ Very significant (VS) | (0.80, 0.35, 0.487) |
| High (H)/ Significant (S) | (0.70, 0.45, 0.554) |
| Moderate high (MH)/ Moderate significant (MS) | (0.60, 0.55, 0.581) |
| Moderate (M)/Average (A) | (0.50, 0.60, 0.624) |
| Moderate low (ML)/ Moderate insignificant (MI) | (0.40, 0.70, 0.592) |
| Low (L) / Very insignificant (VI) | (0.30, 0.75, 0.589) |
| Very low (VL) /Very very insignificant (VVI) | (0.20, 0.85, 0.487) |
| Absolutely low (AL)/ Extremely insignificant (EI) | (0.10, 0.95, 0.296) |
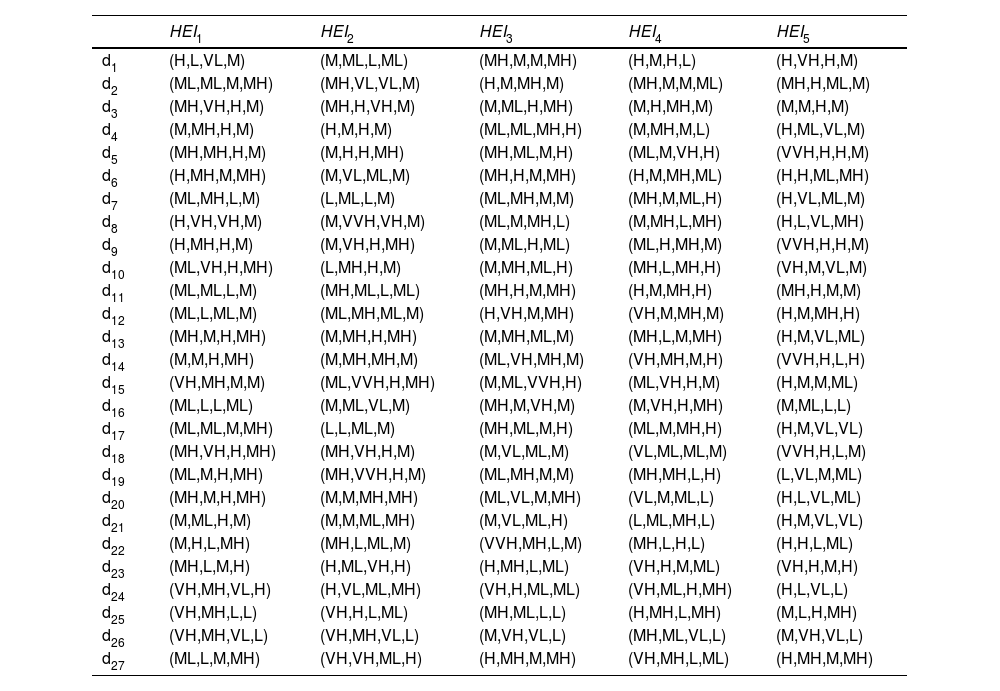
LVs of options by DEs for drivers to implement the DT in HEIs in the era of Industry 4.0.
| HEI1 | HEI2 | HEI3 | HEI4 | HEI5 | |
|---|---|---|---|---|---|
| d1 | (H,L,VL,M) | (M,ML,L,ML) | (MH,M,M,MH) | (H,M,H,L) | (H,VH,H,M) |
| d2 | (ML,ML,M,MH) | (MH,VL,VL,M) | (H,M,MH,M) | (MH,M,M,ML) | (MH,H,ML,M) |
| d3 | (MH,VH,H,M) | (MH,H,VH,M) | (M,ML,H,MH) | (M,H,MH,M) | (M,M,H,M) |
| d4 | (M,MH,H,M) | (H,M,H,M) | (ML,ML,MH,H) | (M,MH,M,L) | (H,ML,VL,M) |
| d5 | (MH,MH,H,M) | (M,H,H,MH) | (MH,ML,M,H) | (ML,M,VH,H) | (VVH,H,H,M) |
| d6 | (H,MH,M,MH) | (M,VL,ML,M) | (MH,H,M,MH) | (H,M,MH,ML) | (H,H,ML,MH) |
| d7 | (ML,MH,L,M) | (L,ML,L,M) | (ML,MH,M,M) | (MH,M,ML,H) | (H,VL,ML,M) |
| d8 | (H,VH,VH,M) | (M,VVH,VH,M) | (ML,M,MH,L) | (M,MH,L,MH) | (H,L,VL,MH) |
| d9 | (H,MH,H,M) | (M,VH,H,MH) | (M,ML,H,ML) | (ML,H,MH,M) | (VVH,H,H,M) |
| d10 | (ML,VH,H,MH) | (L,MH,H,M) | (M,MH,ML,H) | (MH,L,MH,H) | (VH,M,VL,M) |
| d11 | (ML,ML,L,M) | (MH,ML,L,ML) | (MH,H,M,MH) | (H,M,MH,H) | (MH,H,M,M) |
| d12 | (ML,L,ML,M) | (ML,MH,ML,M) | (H,VH,M,MH) | (VH,M,MH,M) | (H,M,MH,H) |
| d13 | (MH,M,H,MH) | (M,MH,H,MH) | (M,MH,ML,M) | (MH,L,M,MH) | (H,M,VL,ML) |
| d14 | (M,M,H,MH) | (M,MH,MH,M) | (ML,VH,MH,M) | (VH,MH,M,H) | (VVH,H,L,H) |
| d15 | (VH,MH,M,M) | (ML,VVH,H,MH) | (M,ML,VVH,H) | (ML,VH,H,M) | (H,M,M,ML) |
| d16 | (ML,L,L,ML) | (M,ML,VL,M) | (MH,M,VH,M) | (M,VH,H,MH) | (M,ML,L,L) |
| d17 | (ML,ML,M,MH) | (L,L,ML,M) | (MH,ML,M,H) | (ML,M,MH,H) | (H,M,VL,VL) |
| d18 | (MH,VH,H,MH) | (MH,VH,H,M) | (M,VL,ML,M) | (VL,ML,ML,M) | (VVH,H,L,M) |
| d19 | (ML,M,H,MH) | (MH,VVH,H,M) | (ML,MH,M,M) | (MH,MH,L,H) | (L,VL,M,ML) |
| d20 | (MH,M,H,MH) | (M,M,MH,MH) | (ML,VL,M,MH) | (VL,M,ML,L) | (H,L,VL,ML) |
| d21 | (M,ML,H,M) | (M,M,ML,MH) | (M,VL,ML,H) | (L,ML,MH,L) | (H,M,VL,VL) |
| d22 | (M,H,L,MH) | (MH,L,ML,M) | (VVH,MH,L,M) | (MH,L,H,L) | (H,H,L,ML) |
| d23 | (MH,L,M,H) | (H,ML,VH,H) | (H,MH,L,ML) | (VH,H,M,ML) | (VH,H,M,H) |
| d24 | (VH,MH,VL,H) | (H,VL,ML,MH) | (VH,H,ML,ML) | (VH,ML,H,MH) | (H,L,VL,L) |
| d25 | (VH,MH,L,L) | (VH,H,L,ML) | (MH,ML,L,L) | (H,MH,L,MH) | (M,L,H,MH) |
| d26 | (VH,MH,VL,L) | (VH,MH,VL,L) | (M,VH,VL,L) | (MH,ML,VL,L) | (M,VH,VL,L) |
| d27 | (ML,L,M,MH) | (VH,VH,ML,H) | (H,MH,M,MH) | (VH,MH,L,ML) | (H,MH,M,MH) |
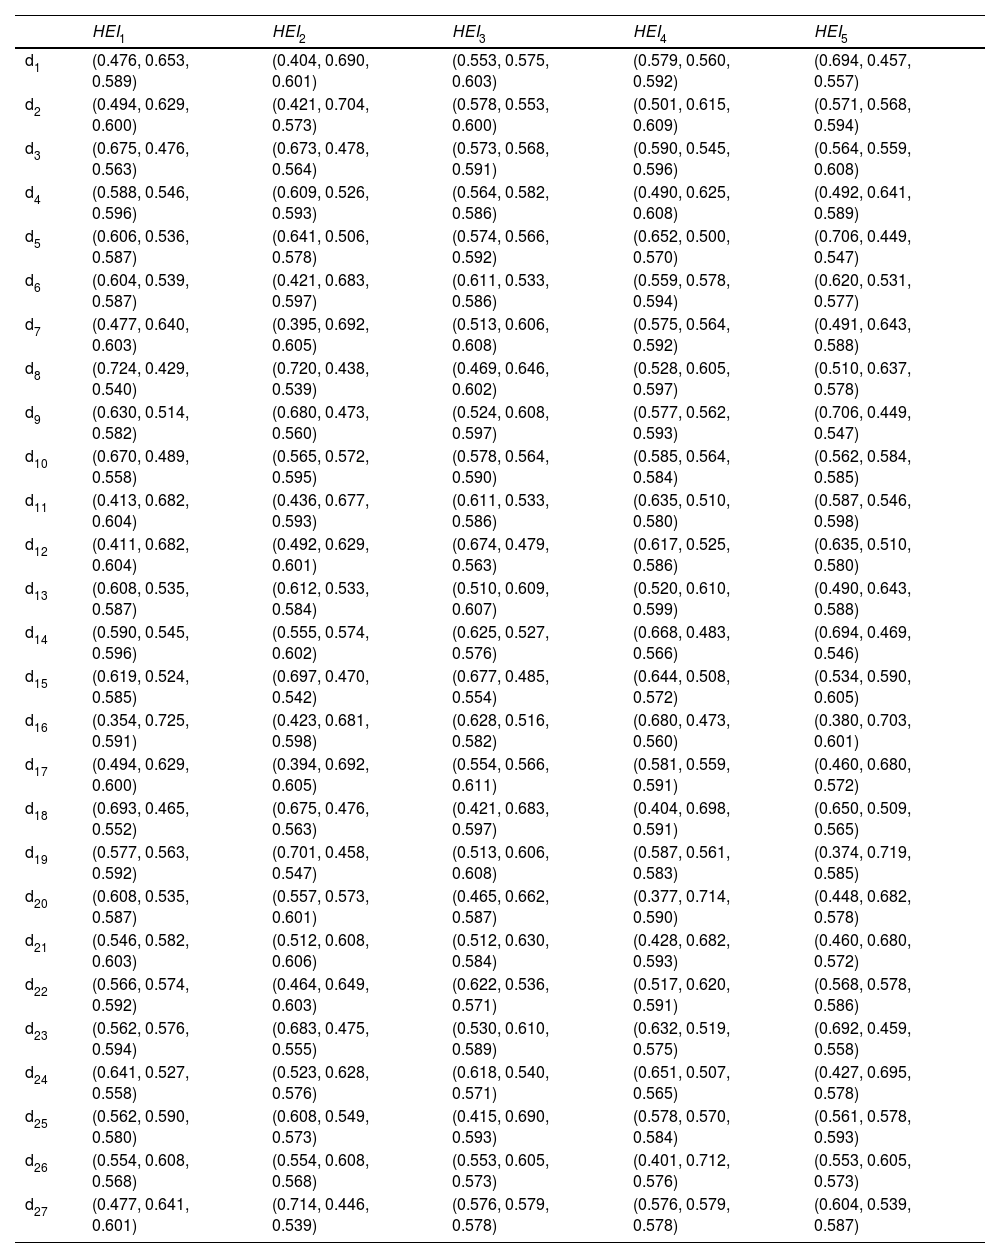
From Eq. (3), we make an A-q-ROF-DM Z=(ξij)m×n, is provided in Table 4.
The A-q-ROF-DM for drivers to implement the DT in HEIs in the era of Industry 4.0.
| HEI1 | HEI2 | HEI3 | HEI4 | HEI5 | |
|---|---|---|---|---|---|
| d1 | (0.476, 0.653, 0.589) | (0.404, 0.690, 0.601) | (0.553, 0.575, 0.603) | (0.579, 0.560, 0.592) | (0.694, 0.457, 0.557) |
| d2 | (0.494, 0.629, 0.600) | (0.421, 0.704, 0.573) | (0.578, 0.553, 0.600) | (0.501, 0.615, 0.609) | (0.571, 0.568, 0.594) |
| d3 | (0.675, 0.476, 0.563) | (0.673, 0.478, 0.564) | (0.573, 0.568, 0.591) | (0.590, 0.545, 0.596) | (0.564, 0.559, 0.608) |
| d4 | (0.588, 0.546, 0.596) | (0.609, 0.526, 0.593) | (0.564, 0.582, 0.586) | (0.490, 0.625, 0.608) | (0.492, 0.641, 0.589) |
| d5 | (0.606, 0.536, 0.587) | (0.641, 0.506, 0.578) | (0.574, 0.566, 0.592) | (0.652, 0.500, 0.570) | (0.706, 0.449, 0.547) |
| d6 | (0.604, 0.539, 0.587) | (0.421, 0.683, 0.597) | (0.611, 0.533, 0.586) | (0.559, 0.578, 0.594) | (0.620, 0.531, 0.577) |
| d7 | (0.477, 0.640, 0.603) | (0.395, 0.692, 0.605) | (0.513, 0.606, 0.608) | (0.575, 0.564, 0.592) | (0.491, 0.643, 0.588) |
| d8 | (0.724, 0.429, 0.540) | (0.720, 0.438, 0.539) | (0.469, 0.646, 0.602) | (0.528, 0.605, 0.597) | (0.510, 0.637, 0.578) |
| d9 | (0.630, 0.514, 0.582) | (0.680, 0.473, 0.560) | (0.524, 0.608, 0.597) | (0.577, 0.562, 0.593) | (0.706, 0.449, 0.547) |
| d10 | (0.670, 0.489, 0.558) | (0.565, 0.572, 0.595) | (0.578, 0.564, 0.590) | (0.585, 0.564, 0.584) | (0.562, 0.584, 0.585) |
| d11 | (0.413, 0.682, 0.604) | (0.436, 0.677, 0.593) | (0.611, 0.533, 0.586) | (0.635, 0.510, 0.580) | (0.587, 0.546, 0.598) |
| d12 | (0.411, 0.682, 0.604) | (0.492, 0.629, 0.601) | (0.674, 0.479, 0.563) | (0.617, 0.525, 0.586) | (0.635, 0.510, 0.580) |
| d13 | (0.608, 0.535, 0.587) | (0.612, 0.533, 0.584) | (0.510, 0.609, 0.607) | (0.520, 0.610, 0.599) | (0.490, 0.643, 0.588) |
| d14 | (0.590, 0.545, 0.596) | (0.555, 0.574, 0.602) | (0.625, 0.527, 0.576) | (0.668, 0.483, 0.566) | (0.694, 0.469, 0.546) |
| d15 | (0.619, 0.524, 0.585) | (0.697, 0.470, 0.542) | (0.677, 0.485, 0.554) | (0.644, 0.508, 0.572) | (0.534, 0.590, 0.605) |
| d16 | (0.354, 0.725, 0.591) | (0.423, 0.681, 0.598) | (0.628, 0.516, 0.582) | (0.680, 0.473, 0.560) | (0.380, 0.703, 0.601) |
| d17 | (0.494, 0.629, 0.600) | (0.394, 0.692, 0.605) | (0.554, 0.566, 0.611) | (0.581, 0.559, 0.591) | (0.460, 0.680, 0.572) |
| d18 | (0.693, 0.465, 0.552) | (0.675, 0.476, 0.563) | (0.421, 0.683, 0.597) | (0.404, 0.698, 0.591) | (0.650, 0.509, 0.565) |
| d19 | (0.577, 0.563, 0.592) | (0.701, 0.458, 0.547) | (0.513, 0.606, 0.608) | (0.587, 0.561, 0.583) | (0.374, 0.719, 0.585) |
| d20 | (0.608, 0.535, 0.587) | (0.557, 0.573, 0.601) | (0.465, 0.662, 0.587) | (0.377, 0.714, 0.590) | (0.448, 0.682, 0.578) |
| d21 | (0.546, 0.582, 0.603) | (0.512, 0.608, 0.606) | (0.512, 0.630, 0.584) | (0.428, 0.682, 0.593) | (0.460, 0.680, 0.572) |
| d22 | (0.566, 0.574, 0.592) | (0.464, 0.649, 0.603) | (0.622, 0.536, 0.571) | (0.517, 0.620, 0.591) | (0.568, 0.578, 0.586) |
| d23 | (0.562, 0.576, 0.594) | (0.683, 0.475, 0.555) | (0.530, 0.610, 0.589) | (0.632, 0.519, 0.575) | (0.692, 0.459, 0.558) |
| d24 | (0.641, 0.527, 0.558) | (0.523, 0.628, 0.576) | (0.618, 0.540, 0.571) | (0.651, 0.507, 0.565) | (0.427, 0.695, 0.578) |
| d25 | (0.562, 0.590, 0.580) | (0.608, 0.549, 0.573) | (0.415, 0.690, 0.593) | (0.578, 0.570, 0.584) | (0.561, 0.578, 0.593) |
| d26 | (0.554, 0.608, 0.568) | (0.554, 0.608, 0.568) | (0.553, 0.605, 0.573) | (0.401, 0.712, 0.576) | (0.553, 0.605, 0.573) |
| d27 | (0.477, 0.641, 0.601) | (0.714, 0.446, 0.539) | (0.576, 0.579, 0.578) | (0.576, 0.579, 0.578) | (0.604, 0.539, 0.587) |
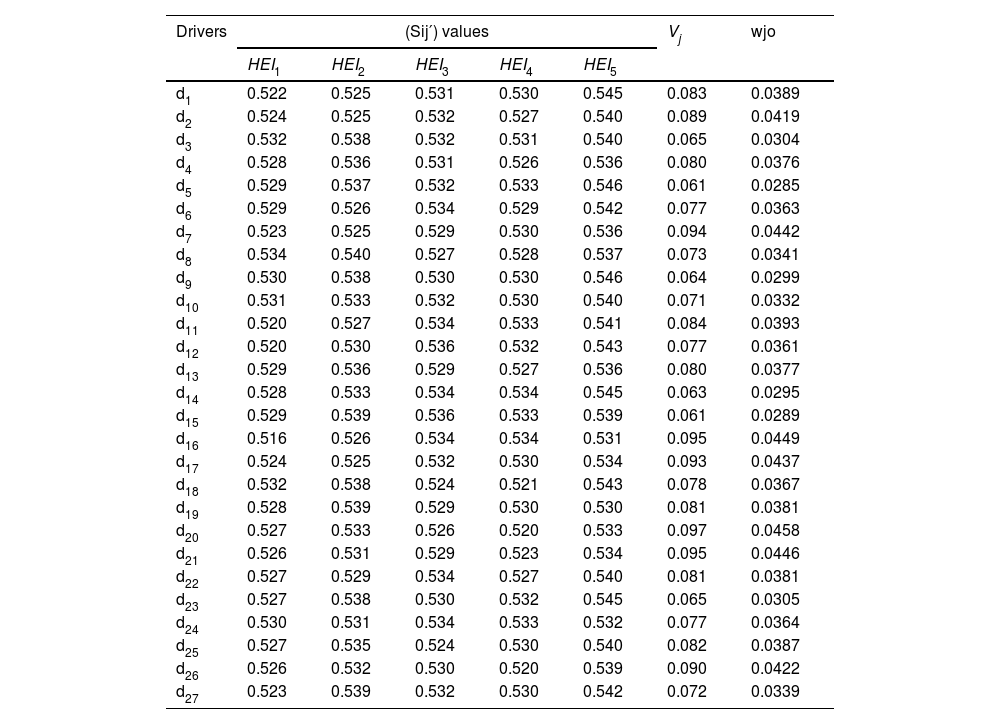
To determine the criteria weights using MEREC, the overall performances of the alternatives values are computed using Eq. (5) and then presented as S1= 0.542, S2 = 0.549, S3 = 0.547, S4 = 0.545, and S5 = 0.555. Based on Eq. (6), the alternatives’ overall performances (Sij′) are determined through the removal of each criterion; next, they are presented in Table 5. Then, the removal effects of each criterion on the overall performance of the alternatives are computed using the deviation-based formula of Eq. (7). The weight of each criterion is computed based on the effects of their removal on the performance Vj of the alternatives with Eq. (8). Using Eq. (9) and the Vj values, we calculate the weights of each challenge for the implementation of DT in HEIs in the era of Industry 4.0 and are given in the last column of Table 5.
The implementation of the MEREC weighting approach for computing the criteria weights.
| Drivers | (Sij′) values | Vj | wjo | ||||
|---|---|---|---|---|---|---|---|
| HEI1 | HEI2 | HEI3 | HEI4 | HEI5 | |||
| d1 | 0.522 | 0.525 | 0.531 | 0.530 | 0.545 | 0.083 | 0.0389 |
| d2 | 0.524 | 0.525 | 0.532 | 0.527 | 0.540 | 0.089 | 0.0419 |
| d3 | 0.532 | 0.538 | 0.532 | 0.531 | 0.540 | 0.065 | 0.0304 |
| d4 | 0.528 | 0.536 | 0.531 | 0.526 | 0.536 | 0.080 | 0.0376 |
| d5 | 0.529 | 0.537 | 0.532 | 0.533 | 0.546 | 0.061 | 0.0285 |
| d6 | 0.529 | 0.526 | 0.534 | 0.529 | 0.542 | 0.077 | 0.0363 |
| d7 | 0.523 | 0.525 | 0.529 | 0.530 | 0.536 | 0.094 | 0.0442 |
| d8 | 0.534 | 0.540 | 0.527 | 0.528 | 0.537 | 0.073 | 0.0341 |
| d9 | 0.530 | 0.538 | 0.530 | 0.530 | 0.546 | 0.064 | 0.0299 |
| d10 | 0.531 | 0.533 | 0.532 | 0.530 | 0.540 | 0.071 | 0.0332 |
| d11 | 0.520 | 0.527 | 0.534 | 0.533 | 0.541 | 0.084 | 0.0393 |
| d12 | 0.520 | 0.530 | 0.536 | 0.532 | 0.543 | 0.077 | 0.0361 |
| d13 | 0.529 | 0.536 | 0.529 | 0.527 | 0.536 | 0.080 | 0.0377 |
| d14 | 0.528 | 0.533 | 0.534 | 0.534 | 0.545 | 0.063 | 0.0295 |
| d15 | 0.529 | 0.539 | 0.536 | 0.533 | 0.539 | 0.061 | 0.0289 |
| d16 | 0.516 | 0.526 | 0.534 | 0.534 | 0.531 | 0.095 | 0.0449 |
| d17 | 0.524 | 0.525 | 0.532 | 0.530 | 0.534 | 0.093 | 0.0437 |
| d18 | 0.532 | 0.538 | 0.524 | 0.521 | 0.543 | 0.078 | 0.0367 |
| d19 | 0.528 | 0.539 | 0.529 | 0.530 | 0.530 | 0.081 | 0.0381 |
| d20 | 0.527 | 0.533 | 0.526 | 0.520 | 0.533 | 0.097 | 0.0458 |
| d21 | 0.526 | 0.531 | 0.529 | 0.523 | 0.534 | 0.095 | 0.0446 |
| d22 | 0.527 | 0.529 | 0.534 | 0.527 | 0.540 | 0.081 | 0.0381 |
| d23 | 0.527 | 0.538 | 0.530 | 0.532 | 0.545 | 0.065 | 0.0305 |
| d24 | 0.530 | 0.531 | 0.534 | 0.533 | 0.532 | 0.077 | 0.0364 |
| d25 | 0.527 | 0.535 | 0.524 | 0.530 | 0.540 | 0.082 | 0.0387 |
| d26 | 0.526 | 0.532 | 0.530 | 0.520 | 0.539 | 0.090 | 0.0422 |
| d27 | 0.523 | 0.539 | 0.532 | 0.530 | 0.542 | 0.072 | 0.0339 |
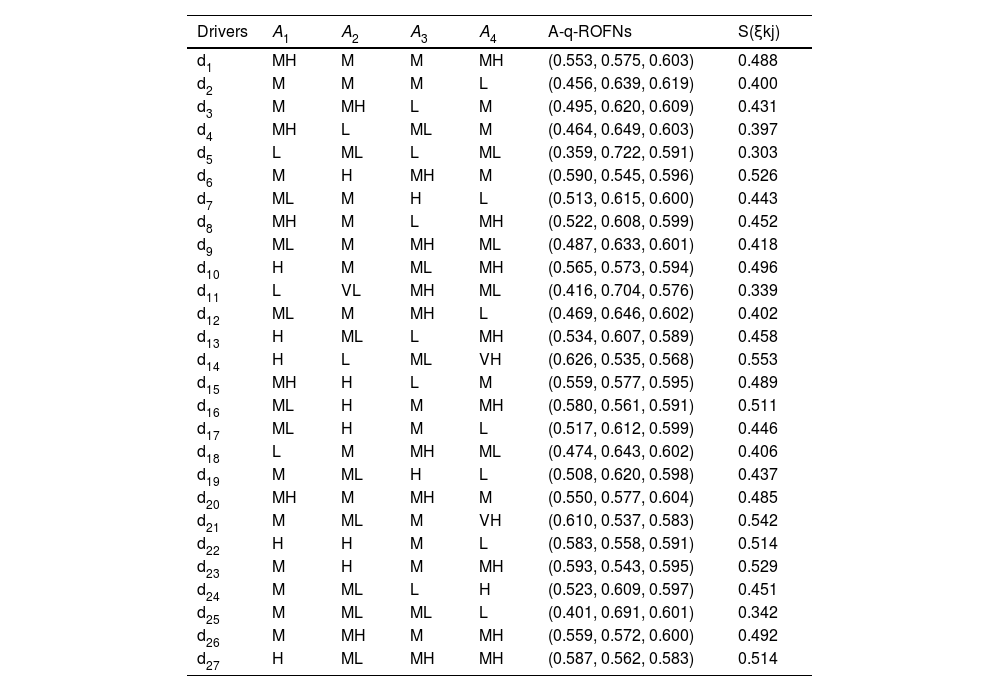
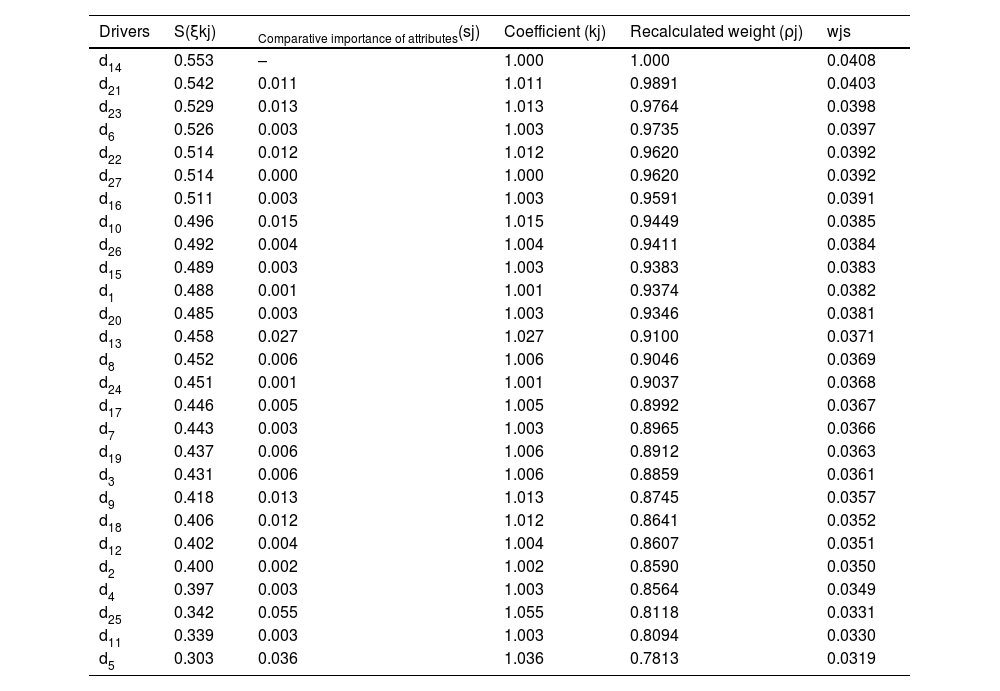
From Eqs. (10) to (12), we have calculated the subjective weights using the q-ROF-SWARA procedure of each challenge for the implementation of DT in HEIs in the era of Industry 4.0 using Tables 6 and 7. The resultant values are given in Table 7 and shown in Fig. 1 and given as follows:

Significance degree of drivers for implementation of DT in HEIs in the era of Industry 4.0.
| Drivers | A1 | A2 | A3 | A4 | A-q-ROFNs | S(ξkj) |
|---|---|---|---|---|---|---|
| d1 | MH | M | M | MH | (0.553, 0.575, 0.603) | 0.488 |
| d2 | M | M | M | L | (0.456, 0.639, 0.619) | 0.400 |
| d3 | M | MH | L | M | (0.495, 0.620, 0.609) | 0.431 |
| d4 | MH | L | ML | M | (0.464, 0.649, 0.603) | 0.397 |
| d5 | L | ML | L | ML | (0.359, 0.722, 0.591) | 0.303 |
| d6 | M | H | MH | M | (0.590, 0.545, 0.596) | 0.526 |
| d7 | ML | M | H | L | (0.513, 0.615, 0.600) | 0.443 |
| d8 | MH | M | L | MH | (0.522, 0.608, 0.599) | 0.452 |
| d9 | ML | M | MH | ML | (0.487, 0.633, 0.601) | 0.418 |
| d10 | H | M | ML | MH | (0.565, 0.573, 0.594) | 0.496 |
| d11 | L | VL | MH | ML | (0.416, 0.704, 0.576) | 0.339 |
| d12 | ML | M | MH | L | (0.469, 0.646, 0.602) | 0.402 |
| d13 | H | ML | L | MH | (0.534, 0.607, 0.589) | 0.458 |
| d14 | H | L | ML | VH | (0.626, 0.535, 0.568) | 0.553 |
| d15 | MH | H | L | M | (0.559, 0.577, 0.595) | 0.489 |
| d16 | ML | H | M | MH | (0.580, 0.561, 0.591) | 0.511 |
| d17 | ML | H | M | L | (0.517, 0.612, 0.599) | 0.446 |
| d18 | L | M | MH | ML | (0.474, 0.643, 0.602) | 0.406 |
| d19 | M | ML | H | L | (0.508, 0.620, 0.598) | 0.437 |
| d20 | MH | M | MH | M | (0.550, 0.577, 0.604) | 0.485 |
| d21 | M | ML | M | VH | (0.610, 0.537, 0.583) | 0.542 |
| d22 | H | H | M | L | (0.583, 0.558, 0.591) | 0.514 |
| d23 | M | H | M | MH | (0.593, 0.543, 0.595) | 0.529 |
| d24 | M | ML | L | H | (0.523, 0.609, 0.597) | 0.451 |
| d25 | M | ML | ML | L | (0.401, 0.691, 0.601) | 0.342 |
| d26 | M | MH | M | MH | (0.559, 0.572, 0.600) | 0.492 |
| d27 | H | ML | MH | MH | (0.587, 0.562, 0.583) | 0.514 |
The weight of different drivers for implementation of DT in HEIs by the SWARA method.
| Drivers | S(ξkj) | Comparative importance of attributes(sj) | Coefficient (kj) | Recalculated weight (ρj) | wjs |
|---|---|---|---|---|---|
| d14 | 0.553 | – | 1.000 | 1.000 | 0.0408 |
| d21 | 0.542 | 0.011 | 1.011 | 0.9891 | 0.0403 |
| d23 | 0.529 | 0.013 | 1.013 | 0.9764 | 0.0398 |
| d6 | 0.526 | 0.003 | 1.003 | 0.9735 | 0.0397 |
| d22 | 0.514 | 0.012 | 1.012 | 0.9620 | 0.0392 |
| d27 | 0.514 | 0.000 | 1.000 | 0.9620 | 0.0392 |
| d16 | 0.511 | 0.003 | 1.003 | 0.9591 | 0.0391 |
| d10 | 0.496 | 0.015 | 1.015 | 0.9449 | 0.0385 |
| d26 | 0.492 | 0.004 | 1.004 | 0.9411 | 0.0384 |
| d15 | 0.489 | 0.003 | 1.003 | 0.9383 | 0.0383 |
| d1 | 0.488 | 0.001 | 1.001 | 0.9374 | 0.0382 |
| d20 | 0.485 | 0.003 | 1.003 | 0.9346 | 0.0381 |
| d13 | 0.458 | 0.027 | 1.027 | 0.9100 | 0.0371 |
| d8 | 0.452 | 0.006 | 1.006 | 0.9046 | 0.0369 |
| d24 | 0.451 | 0.001 | 1.001 | 0.9037 | 0.0368 |
| d17 | 0.446 | 0.005 | 1.005 | 0.8992 | 0.0367 |
| d7 | 0.443 | 0.003 | 1.003 | 0.8965 | 0.0366 |
| d19 | 0.437 | 0.006 | 1.006 | 0.8912 | 0.0363 |
| d3 | 0.431 | 0.006 | 1.006 | 0.8859 | 0.0361 |
| d9 | 0.418 | 0.013 | 1.013 | 0.8745 | 0.0357 |
| d18 | 0.406 | 0.012 | 1.012 | 0.8641 | 0.0352 |
| d12 | 0.402 | 0.004 | 1.004 | 0.8607 | 0.0351 |
| d2 | 0.400 | 0.002 | 1.002 | 0.8590 | 0.0350 |
| d4 | 0.397 | 0.003 | 1.003 | 0.8564 | 0.0349 |
| d25 | 0.342 | 0.055 | 1.055 | 0.8118 | 0.0331 |
| d11 | 0.339 | 0.003 | 1.003 | 0.8094 | 0.0330 |
| d5 | 0.303 | 0.036 | 1.036 | 0.7813 | 0.0319 |

From the algorithm of proposed q-ROF-MEREC-SWARA, we have to combine the q-ROF-MEREC for objective weighting and q-ROF-SWARA for subjective weighting by using Eq. (13) of different drivers for implementation of DT in HEIs in the era of Industry 4.0. The integrated weight for τ=0.5 is shown in Fig. 1 and given as follows:

Here, Fig. 1 shows the weights of diverse drivers for the implementation of DT in HEIs in the era of Industry 4.0 with respect to the goal. Developing, updating, and adapting a curriculum (d21) with a weight value of 0.0425 has come out to be the most important driver for the implementation of DT in HEIs in the era of Industry 4.0. Integration of digital technologies for universal education (d16) with a weight value of 0.0420 is the second biggest challenge for the implementation of DT in HEIs in the era of Industry 4.0. Cloud computing (d20) has third with a weight of 0.0419, 5 G networks (d7) has fourth with a weight of 0.0404, Internet of Things (d26) with a weight of 0.0403 has the fifth key driver for the implementation of DT in HEIs in the era of Industry 4.0, and others are considered the crucial drivers for implementation of DT in HEIs in the era of Industry 4.0.
Since all criteria are beneficial-type criteria, thus, there is no need to transform aggregated q-ROF-DM into normalized q-ROF-DM.
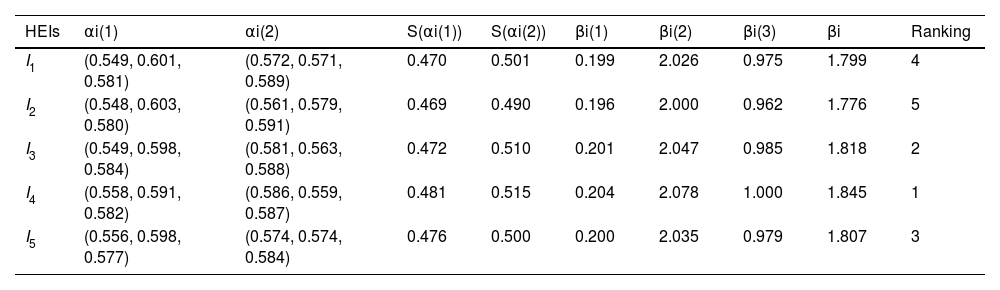
Using Eqs. (15) and (16), the WSM and WPM are estimated for diverse companies over different drivers for the implementation of DT in HEIs in the era of Industry 4.0. From Eqs. (17) to(20), the results of the q-ROF-MEREC-SWARA-CoCoSo method are obtained and mentioned in Table 8. Corresponding to the compromise degree (βi), the prioritization of companies over different drivers for implementation of DT in HEIs in the era of Industry 4.0 is HEI4≻HEI3≻HEI5≻HEI1≻HEI2, and thus, the higher education institution (HEI)−4 (HEI4) is the ideal HEI over different drivers for implementation of DT in HEIs in the era of Industry 4.0.
Overall results of the developed method.
| HEIs | αi(1) | αi(2) | S(αi(1)) | S(αi(2)) | βi(1) | βi(2) | βi(3) | βi | Ranking |
|---|---|---|---|---|---|---|---|---|---|
| I1 | (0.549, 0.601, 0.581) | (0.572, 0.571, 0.589) | 0.470 | 0.501 | 0.199 | 2.026 | 0.975 | 1.799 | 4 |
| I2 | (0.548, 0.603, 0.580) | (0.561, 0.579, 0.591) | 0.469 | 0.490 | 0.196 | 2.000 | 0.962 | 1.776 | 5 |
| I3 | (0.549, 0.598, 0.584) | (0.581, 0.563, 0.588) | 0.472 | 0.510 | 0.201 | 2.047 | 0.985 | 1.818 | 2 |
| I4 | (0.558, 0.591, 0.582) | (0.586, 0.559, 0.587) | 0.481 | 0.515 | 0.204 | 2.078 | 1.000 | 1.845 | 1 |
| I5 | (0.556, 0.598, 0.577) | (0.574, 0.574, 0.584) | 0.476 | 0.500 | 0.200 | 2.035 | 0.979 | 1.807 | 3 |
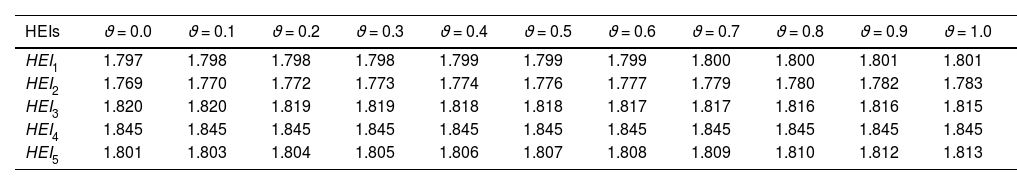
The present study also involves a sensitivity analysis to investigate how the developed method achieves its objectives. This study analyzed the impact of the variation of the coefficient ϑ (0≤ϑ≤1) over the drivers arising when implementing DT in HEIs in the era of Industry 4.0; Fig 2 presents the compromise degree of the companies. In addition, the compromise degrees for each company were determined with diverse parameter ϑ value. Accordingly, it could be concluded that the companies’ over-diverse drivers arising when implementing DT in HEIs in the era of Industry 4.0 are dependent upon and are sensitive to different parameter ϑ. For that reason, the q-ROF-MEREC-SWARA-CoCoSo model was confirmed as desirably stable with various values of ϑ. Based on the information presented in Table 9 and Fig. 2, option HEI4 gained the first rank, while HEI2 gained the last one. According to the results of this analysis, the q-ROF-MEREC-SWARA-CoCoSo method does not depend upon any bias, and the results achieved in the current paper have enough stability in their nature.

Compromise degrees of the company over values of ϑ.
| HEIs | ϑ = 0.0 | ϑ = 0.1 | ϑ = 0.2 | ϑ = 0.3 | ϑ = 0.4 | ϑ = 0.5 | ϑ = 0.6 | ϑ = 0.7 | ϑ = 0.8 | ϑ = 0.9 | ϑ = 1.0 |
|---|---|---|---|---|---|---|---|---|---|---|---|
| HEI1 | 1.797 | 1.798 | 1.798 | 1.798 | 1.799 | 1.799 | 1.799 | 1.800 | 1.800 | 1.801 | 1.801 |
| HEI2 | 1.769 | 1.770 | 1.772 | 1.773 | 1.774 | 1.776 | 1.777 | 1.779 | 1.780 | 1.782 | 1.783 |
| HEI3 | 1.820 | 1.820 | 1.819 | 1.819 | 1.818 | 1.818 | 1.817 | 1.817 | 1.816 | 1.816 | 1.815 |
| HEI4 | 1.845 | 1.845 | 1.845 | 1.845 | 1.845 | 1.845 | 1.845 | 1.845 | 1.845 | 1.845 | 1.845 |
| HEI5 | 1.801 | 1.803 | 1.804 | 1.805 | 1.806 | 1.807 | 1.808 | 1.809 | 1.810 | 1.812 | 1.813 |
Here, the proposed method is compared with diverse extant approaches. To demonstrate the efficacy and the unique advantages of the developed method, the q-ROF-WASPAS (Rani & Mishra, 2020) and q-ROF-COPRAS (Krishankumar et al., 2021) are taken to tackle the same problem.
q-ROF-WASPAS modelStep 1-Step 6: Same as the aforementioned approach.
Step 7: The utility degree (UD) of WASPAS measure of each choice is computed by
where λ∈[0,1] stands for the strategy coefficient.
Step 8: Rank the alternatives according to the decreasing values of αi,i=1(1)m.
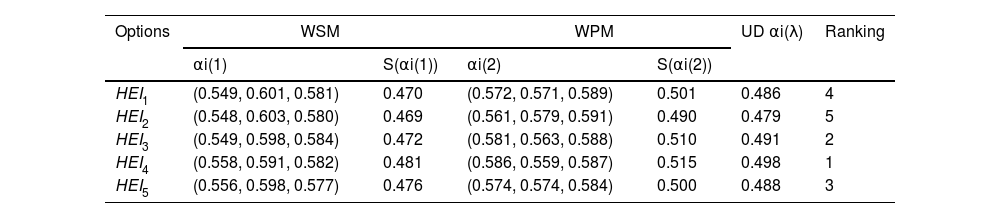
Step 7-Step 8: Form Eq. (21), the UD (αi) degree for each HEI option is demonstrated and depicted in Table 10. Hence, the priority order of the HEIs is obtained as HEI4≻HEI3≻HEI5≻HEI1≻HEI2 and, HEI-4 is the most desirable option.
Table 10.Results of the q-ROF-WASPAS model for different HEIs.
Options WSM WPM UD αi(λ) Ranking αi(1) S(αi(1)) αi(2) S(αi(2)) HEI1 (0.549, 0.601, 0.581) 0.470 (0.572, 0.571, 0.589) 0.501 0.486 4 HEI2 (0.548, 0.603, 0.580) 0.469 (0.561, 0.579, 0.591) 0.490 0.479 5 HEI3 (0.549, 0.598, 0.584) 0.472 (0.581, 0.563, 0.588) 0.510 0.491 2 HEI4 (0.558, 0.591, 0.582) 0.481 (0.586, 0.559, 0.587) 0.515 0.498 1 HEI5 (0.556, 0.598, 0.577) 0.476 (0.574, 0.574, 0.584) 0.500 0.488 3

Step 1-Step 4: Same as the above-discussed method.
Step 5: We compute the assessment rating for each option to maximize the benefit rating βi=⊕nj=1wjξij,i=1(1)m. Also, the relative degree (RD) of each option is similar to the βi,i=1(1)m. Therefore, we obtain RD1 = 0.243, RD2 = 0.240, RD3 = 0.246, RD4 = 0.249, and RD5 = 0.244.
Step 6: Assess the RDs of the five HEIs using the priority RDi,i=1(1)m and obtain the prioritization order of the HEIs as RD4≻RD3≻RD5≻RD1≻RD2. The option HEI-4 is the optimal one among the others.
Step 7: Estimate the “utility degree” ui=RDiRDmax×100%. Then, we obtain u1=97.60%,u2=96.39%,u3=98.80%,u4=100.00% and u5=97.99%.
Here, a comparison is made between the proposed method and some extant methods, including q-ROF-WASPAS and q-ROF-COPRAS, which is depicted in Fig. 3. By comparing with the q-ROF-COPRAS method, the final ranking of the HEIs is HEI4≻HEI3≻HEI5≻HEI1≻HEI2. and the best HEI is HEI4 for the different drivers for implementation of DT in HEIs in the era of Industry 4.0. Hence, we observe that the optimal HEI is the same with all the proposed q-ROF-COPRAS and q-ROF-WASPAS models, while the prioritization results slightly vary with diverse extant models. In general, the advantages of the “q-ROF-MEREC-SWARA-CoCoSo” approach over the existing methods are presented as follows:
- •
The subjective and objective weights of criteria in the present research were assessed by the q-ROF-MEREC-SWARA method as q-ROFNs by DEs, whereas in q-ROF-COPRAS, the criteria weights were calculated by a linear programming model, and in q-ROF-WASPAS, the criteria weight are computed by similarity measure-based weighting procedure.
- •
The q-ROFSs can reflect the DE's indecision more accurately than further conventional extensions of FSs. Therefore, the use of the developed q-ROF-MEREC-SWARA-CoCoSo approach gives a more flexible way to express the uncertainty to evaluate the drivers for the implementation of DT in HEIs in the era of Industry 4.0.
- •
The SWARA model is used to estimate the subjective weights, and MEREC is applied to determine the objective weights of drivers in the evaluation of the drivers for implementation of DT in HEIs in the era of Industry 4.0, which creates the developed q-ROF-MEREC-SWARA-CoCoSo model more reliable, effective and sensible tool.

In the recent decade, the DT has been recognized as a priority for HEIs; this process is necessary for all the organizations claiming to be change leaders and competitive in their relevant domains. Several scholars have focused on the definition of DT when it comes to the field of business. To persist in time, HEIs require evolving in an integral manner. Additionally, two challenging tasks are exploiting all the changes provided by the wealth of DTs and redefining the entire business models across the whole value chain. Such a challenge is more persistent in the case of those organizations that are enduringly attempting to make sure of their competitive positions in the international market. However, numerous universities attempt to develop definite digital strategies to be well adapted to the substantial changes in the use of new technologies, but these institutions still lack the capability, vision, or commitment to implement these technologies effectively. In this regard, there is a need to gain an inclusive vision of the whole DT in HEIs in a way to achieve an overview of the current state of DT in these institutions. It is also important to identify the distinctive features of DT, such as actors, dimensions, and implementations, when it occurs in an HEI. Remember that DT in HEIs has been investigated from various points of view, and the literature still lacks a consensus on its definition. To examine, rank, and evaluate the drivers for implementation of DT in HEIs in the era of Industry 4.0, this study introduced an MCDM framework on q-ROFSs. In this regard, an integrated framework using the q-ROF-MEREC-SWARA and CoCoSo approaches called q-ROF-MEREC-SWARA-CoCoSo is discussed. To rank the drivers for implementation of DT in HEIs in the era of Industry 4.0, the q-ROF-MEREC-SWARA is applied, and to estimate the preference order of different industries over the different drivers for implementation of DT in HEIs in the era of Industry 4.0, the CoCoSo method is used. To validate the results of this study, a comparison with the q-ROF-WASPAS, q-ROF-COPRAS, q-ROF-WPM, and q-ROF-WSM methods is conducted.