


The prevalence of multiple sclerosis (MS) in Asian countries is thought to be lower than in Western countries, with Asian populations presenting 80% less risk of MS than white populations. Incidence and prevalence rates in Asian countries are therefore not well defined and their association with rates in neighboring countries, as well as with ethnic, environmental, and socioeconomic factors, are not well understood.
We performed a comprehensive literature review of epidemiological data from China and neighbouring countries to study the frequency of the disease, focusing on prevalence, and the progression over time and the influence of sex-related, environmental, dietary, and sociocultural factors.
Prevalence rates in China range between 0.88 cases/100,000 population in 1986 and 5.2 cases/100,000 population in 2013, with a non-significant upwards trend (p = .08). The increase observed in Japan, where figures ranged between 8.1 and 18.6 cases/100,000 population was highly significant (p < .001). Prevalence rates in countries with predominantly white populations are considerably higher and have increased over time, reaching 115 cases/100,000 population in 2015 (r2 = 0.79, p < .0001).
In conclusion, the prevalence of MS in China appears to have risen in recent years, although Asian populations (including Chinese and Japanese populations, among others) appear to present less risk than other populations. Within Asia, geographical latitude appears not to be a determining factor for developing MS.
La prevalencia de la esclerosis múltiple (EM) en los países asiáticos se considera que es más baja que en los países occidentales, las poblaciones asiáticas tienen un 80% menos de riesgo de EM que las caucásicas. No se conocen bien las cifras de incidencia, prevalencia y su relación con otros países de su entorno y su relación con factores étnicos, ambientales y socioeconómicos.
Hemos realizado una revisión bibliográfica exhaustiva de los datos epidemiológicos existentes en China y países limítrofes, para estudiar la frecuencia de la enfermedad, centrándonos en la prevalencia, sus cambios evolutivos a lo largo del tiempo y su relación con factores de género, ambientales, alimenticios y socioculturales.
La prevalencia en China oscila en cifras que van desde 0,88 en 1986 a 5,2 en 2013 por 100.000 habitantes con una tendencia a aumentar que no es estadísticamente significativa (p = 0,08), mientras que en Japón este incremento es muy significativo, con cifras que oscilan entre 8,1 y 18,6 (p < 0,001). La prevalencia en los países donde predomina la raza caucásica son mucho más elevadas y aumentan con el tiempo, llegando a 115 por 100.000 habitantes en 2015 (r2 = 0,79, p = 0,0001).
En conclusión, la prevalencia de la EM en China parece está aumentando en los últimos años, aunque la raza amarilla (chinos y japoneses, entre otros) tienen menor riesgo de padecerla que el resto de las poblaciones. La latitud no parece ser un factor muy determinante en Asia para presentar un mayor riesgo de padecer EM.
Multiple sclerosis (MS) is an inflammatory demyelinating disease of the central nervous system (CNS) that, after an initial relapsing course, progresses to a chronic, progressive, neurodegenerative form.1 It is characterised by CNS demyelination due to an atypical immune response. The most characteristic finding is a neurological disorder exclusively involving the CNS.2
The epidemiology of MS is changing rapidly in many parts of the world. According to recent studies, the latitude gradient in the distribution of MS is subject to considerable debate.3 Although various studies have been conducted worldwide to clarify the epidemiology of MS, researchers have not yet established the exact geographical distribution or the precise prevalence or incidence rates of MS in certain regions.4
Little is known about the considerable differences between ethnic groups in many countries and regions at the same latitudes. The prevalence of MS was thought to be clearly higher in certain regions of Europe and the United States, but it has increased over time in other regions of the world, becoming a global problem. Prevalence has changed significantly over time, with higher rates generally being reported in each new review of the subject.5
According to a report published in 2008 by the World Health Organization, the global prevalence of the disease was 30 cases/100 000 population, with cumulative prevalence rates of less than 0.5 cases per 100 000 population in Africa, 8.3 in South-East Asia, and 80 in Europe.1 According to a more recent report from 2013, global prevalence was 33 cases/100 000 population, which would amount to a total of 2.3 million patients with MS worldwide. That report did not clearly address the reasons for this upward trend, limiting the discussion to some possible causes, such as improved diagnosis of the disease and better notification systems, among others.6
Generally, MS prevalence is higher in women than in men, and the majority of cases are diagnosed between the ages of 20 and 40 years.7 MS represents the leading cause of disability among young adults. The risk of MS is 2 times higher in women than in men, although prevalence in women is increasing, with a female-to-male ratio of 3:1 in regions such as southern Spain.8 The cause of MS is not well understood, although rigorous epidemiological research has identified genetic variations, Epstein-Barr virus infection, low vitamin D levels, and smoking as potential risk factors.9
MS prevalence is thought to be lower in Asian countries than in Western countries, with Asian populations presenting 80% less risk than white populations. However, some studies suggest that prevalence is higher in northern Asia than in southern regions. Furthermore, prevalence seems to have increased between 2001 and 2011.10
The prevalence and incidence of MS vary greatly between countries and geographical regions. In 1980, Kurtzke proposed that different areas of the world be divided into 3 different categories based on MS prevalence, establishing high- (> 30 cases/100 000 population), medium- (5-25), and low-risk regions (< 5). Numerous epidemiological studies have been conducted in Europe, North America, and Australia, reporting an upward trend in prevalence in these regions. In the United States, prevalence is estimated at 100 cases/100 000 population.5 By globally grouped continent, studies into MS in the Americas, Europe, Asia, Africa, and Australia/New Zealand estimate incidence at 5.2 cases/100 000 person-years, with a mean estimated prevalence rate of 112.0 cases per 100 000 person-years; the mean disease duration was 20.2 years.11
Various epidemiological studies have been conducted in other parts of the world, with differences in methodology and results, which also report an increase in the number of patients with MS. East, South-East, and South Asia were previously considered regions of low MS prevalence. However, recent studies suggest increased prevalence in these regions.11
According to classical epidemiology studies, higher latitude is one of the most important factors associated with higher MS prevalence, among other well-documented environmental factors. These factors include the lack of exposure of the skin to solar ultraviolet (UV) radiation, resulting in reduced synthesis of the hormonally active metabolite 1,25-dihydroxyvitamin D, another well-known risk factor for MS. However, it has not been established whether the effect of latitude is explained solely by UV radiation.12
The prevalence of MS is estimated at 203.4 cases/100 000 population in the United Kingdom and 94.7 cases in France.13 In Japan and Korea, prevalence is estimated at 3.9 and 3.5 cases/100 000, respectively.14
MS is also considered a rare disease in China. The low rates of MS may partly be explained by the diagnostic challenge of the disease, with sociocultural and environmental differences also playing a role. Rates may vary greatly between provinces in the north and south of the country. To our knowledge, no study to date has addressed the prevalence and mortality rates associated with MS in China. Furthermore, data from other countries may not reflect China's specific circumstances.
This lack of important epidemiological data has represented a significant obstacle to the development of a specific healthcare policy for MS in China. This underscores the need to collect epidemiological data in China, taking into account the challenges of diagnosing the disease, particularly in rural areas of the north-east of the country, due to the lack of adequate healthcare infrastructure. MS is a rare disease in Asian populations. Previous studies have shown low prevalence rates (0.77 cases per 100 000 population) in populations in the south of China (Taiwan and Hong Kong) compared to white populations, with a high percentage of female patients.15 However, comparatively little is known about the clinical characteristics of MS in northern China. Although Kurtzke classes China as a low-risk region, prevalence and incidence rates appear to have increased in recent years.
Prevalence studies are essential to estimating the impact of chronic disease in the population of a given area, providing data on their distribution that may help identify potential aetiological or trigger factors. This article presents a review of epidemiological studies of MS in China and other Asian countries. We analyse data reported for these countries and study the latest trends and changes in MS prevalence and incidence rates.
ObjectiveThe primary objective of this study is to analyse data on the prevalence of MS in China and to draw comparisons against other geographical regions in Asia and other parts of the world, establishing the influence of latitude and the year of publication.
As a secondary objective, we present a descriptive analysis of the available incidence data; using known figures, we analysed the relationship between MS prevalence and incidence in China and demographic, environmental, and sex-related factors, type of setting (urban or rural), and distribution in different provinces of China.
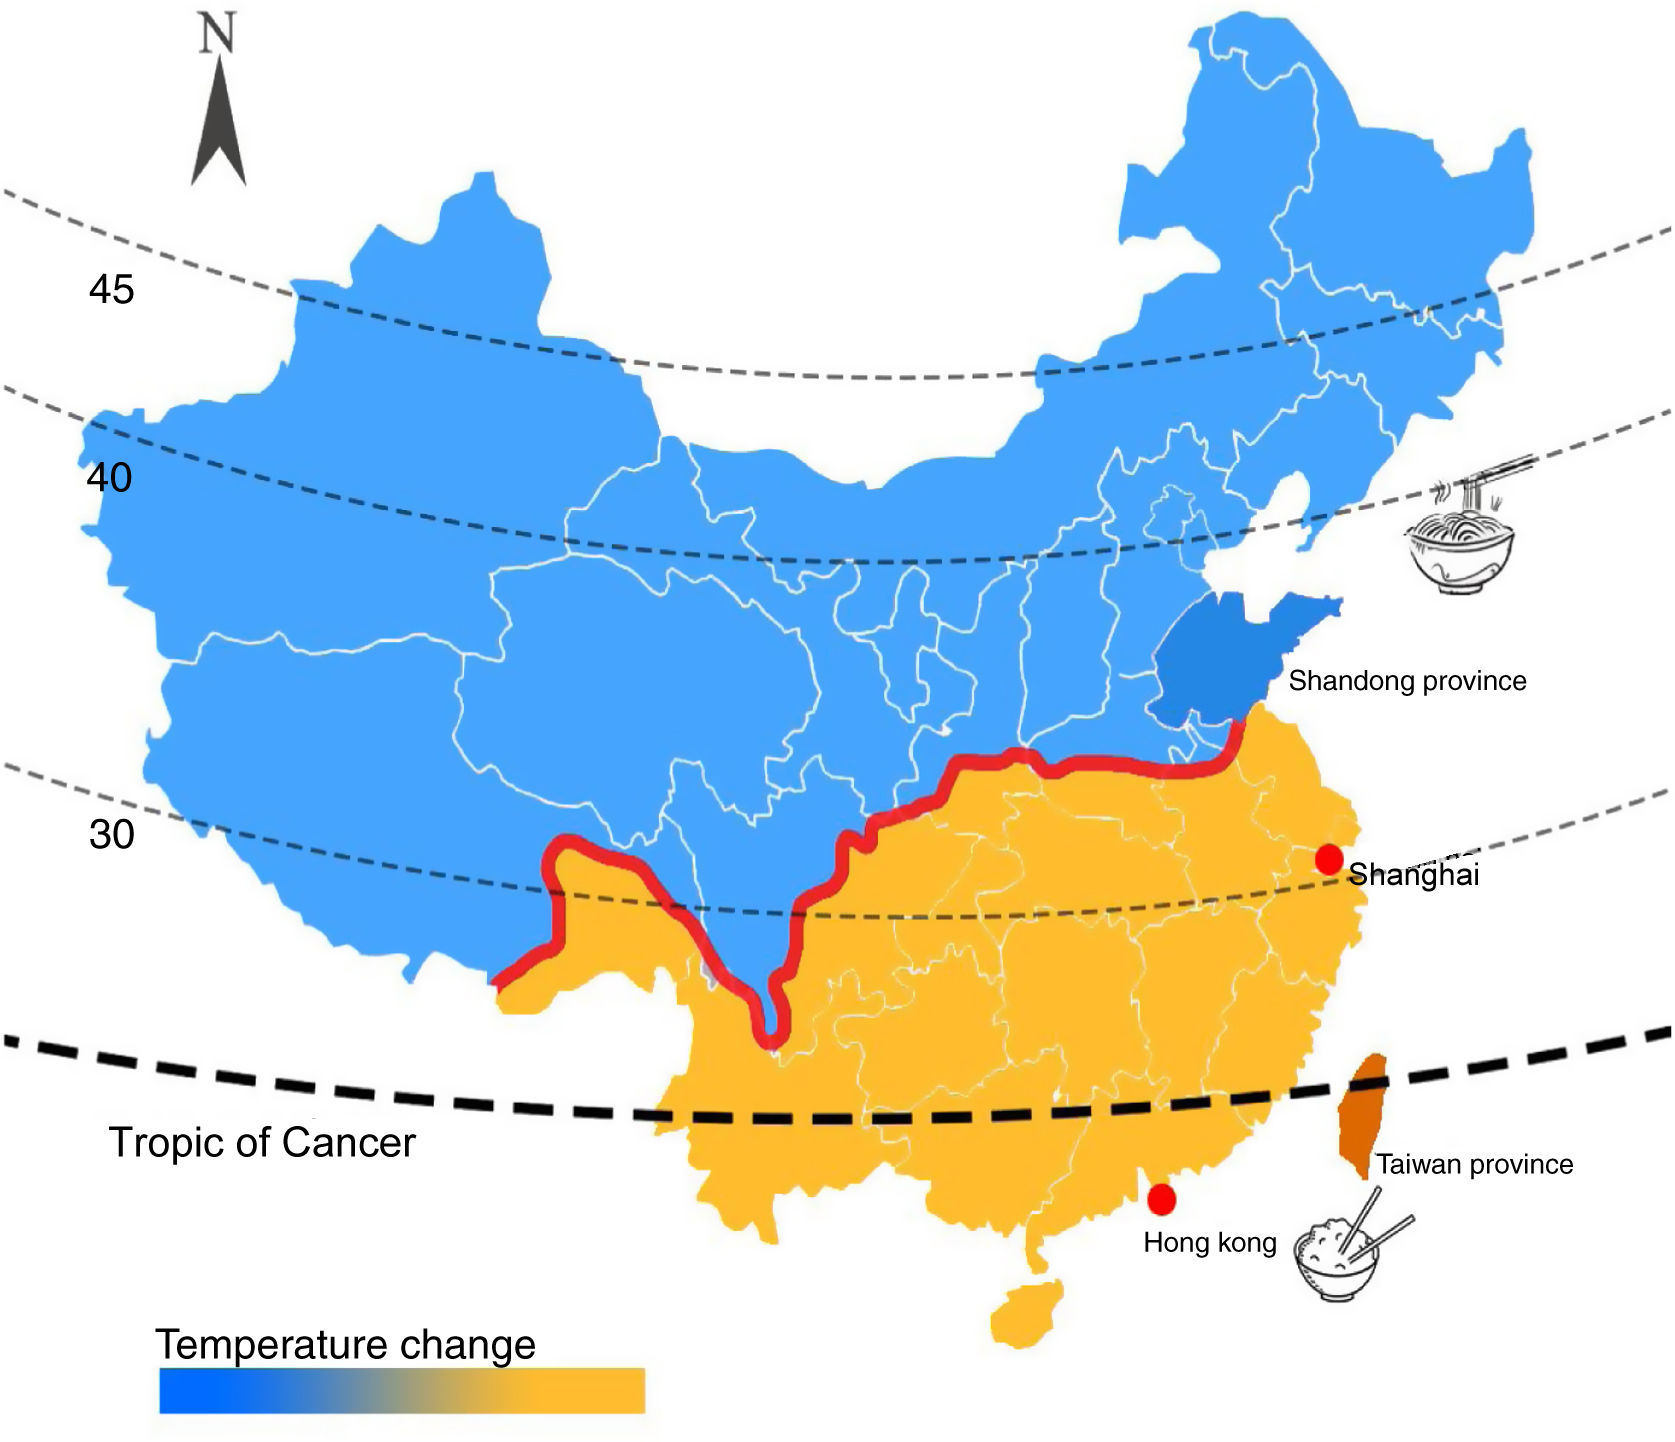
Material and methodsGeographical, sociocultural, environmental, and economic characteristics of China and neighbouring countriesDifferent areas of China vary in terms of climate, language, culture, and diet. Northern Chinese regions belong to the northern dialectal area, whereas southern dialects are relatively diverse. Northern China features many plains and plateaus, facilitating greater communication and integration, hence the limited differences in dialect. In southern China, in contrast, topography is more variable and travel is difficult, hindering good communication. Over time, local dialects with their own characteristics are formed. In southern regions, diet is based almost exclusively on rice, whereas noodles are the staple food in the north. Temperatures vary significantly between the north and south, with colder temperatures in the north and a hotter climate in the south (Fig. 1).
 and the 4 areas in which epidemiological studies of multiple sclerosis have been conducted.")
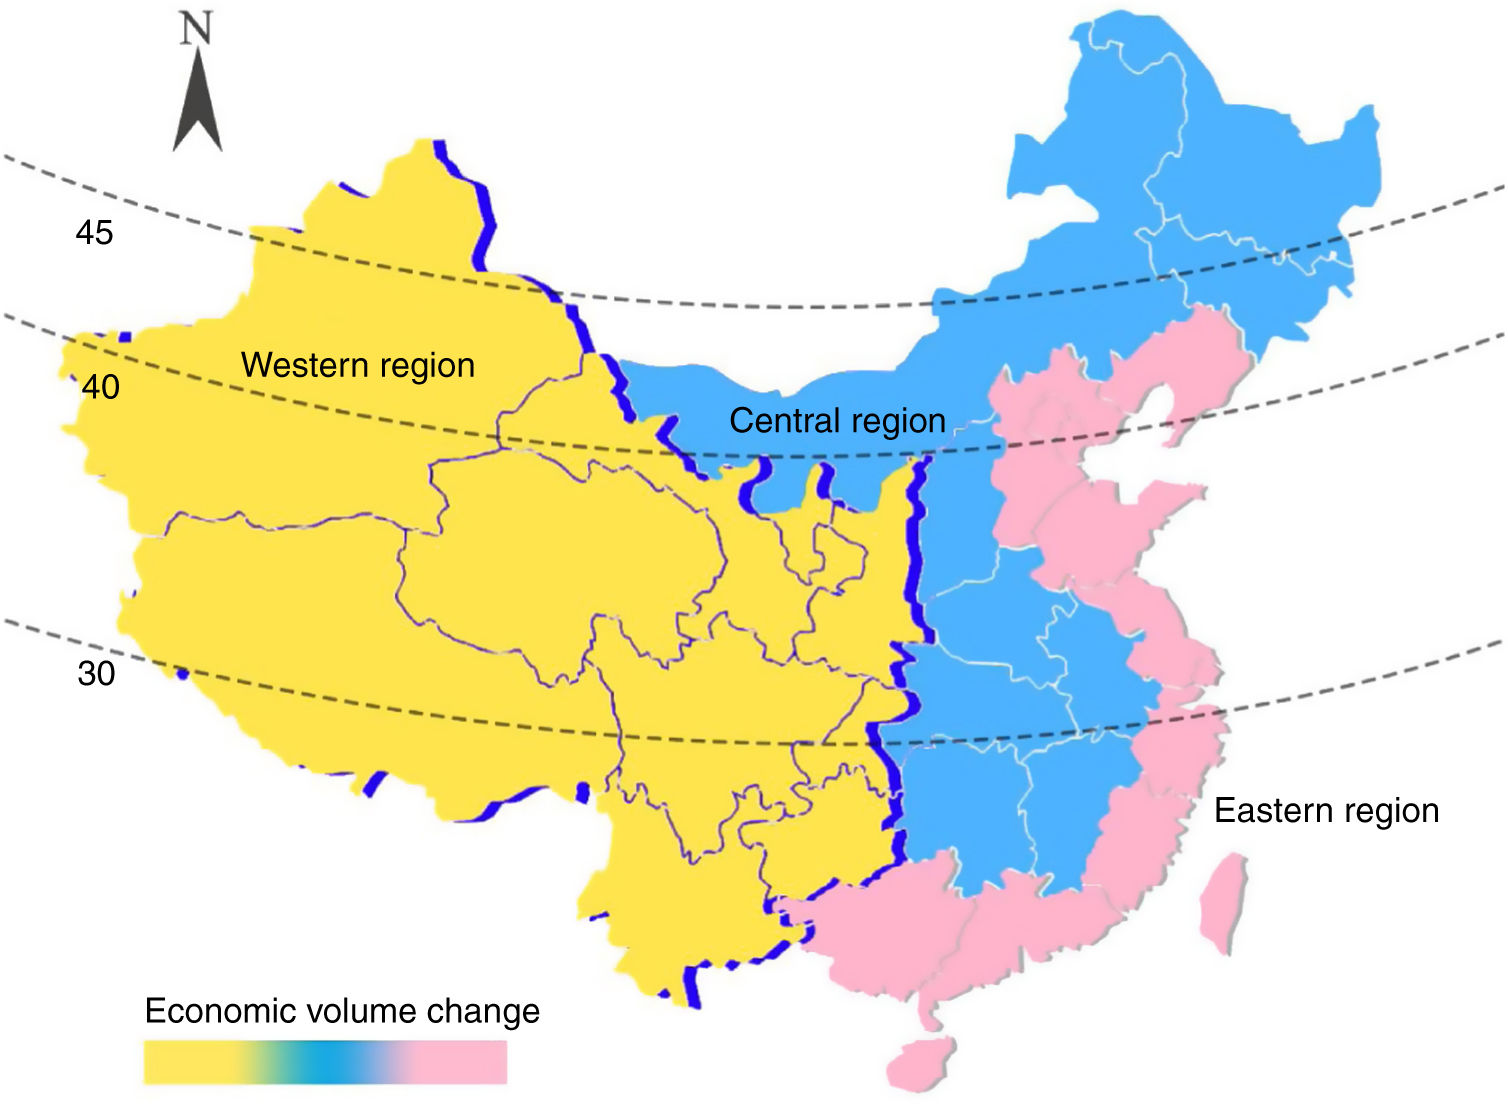
China is located in East Asia, with a clear predominance of the yellow race. China is a very large country (9.6 million square kilometres) with a large population (1.4 billion). The great social, cultural, regional, and linguistic differences make it a highly diverse country. The economy of eastern China is the strongest, whereas western regions are the poorest, with the centre of the country standing between the 2 (Fig. 2). Few studies have addressed the epidemiology of MS in China. Data are available for Shanghai, Shandong province, Taiwan, and Hong Kong.

Shandong province (latitude: 36° 67’ N; longitude: 116° 98’ E) is located north of the Yangtze and Huai rivers, belongs to northern China, and is located in the eastern part of mainland China.
Shanghai (latitude: 31° 11’ N; longitude: 121° 29’ E) is China's largest city; it belongs to southern China and is located in the eastern part of mainland China.16
Hong Kong (latitude: 22° 20’ N; longitude: 114° 12’ E) is located south of Guangdong province, and has a predominantly Chinese population of 7.45 million (2018 data).17
Taiwan is located on the south-east coast of China (latitude: 20° 45’ 25“-25° 56’ 30” N; longitude: 119° 18’ 03“-124° 34’ 30” E).
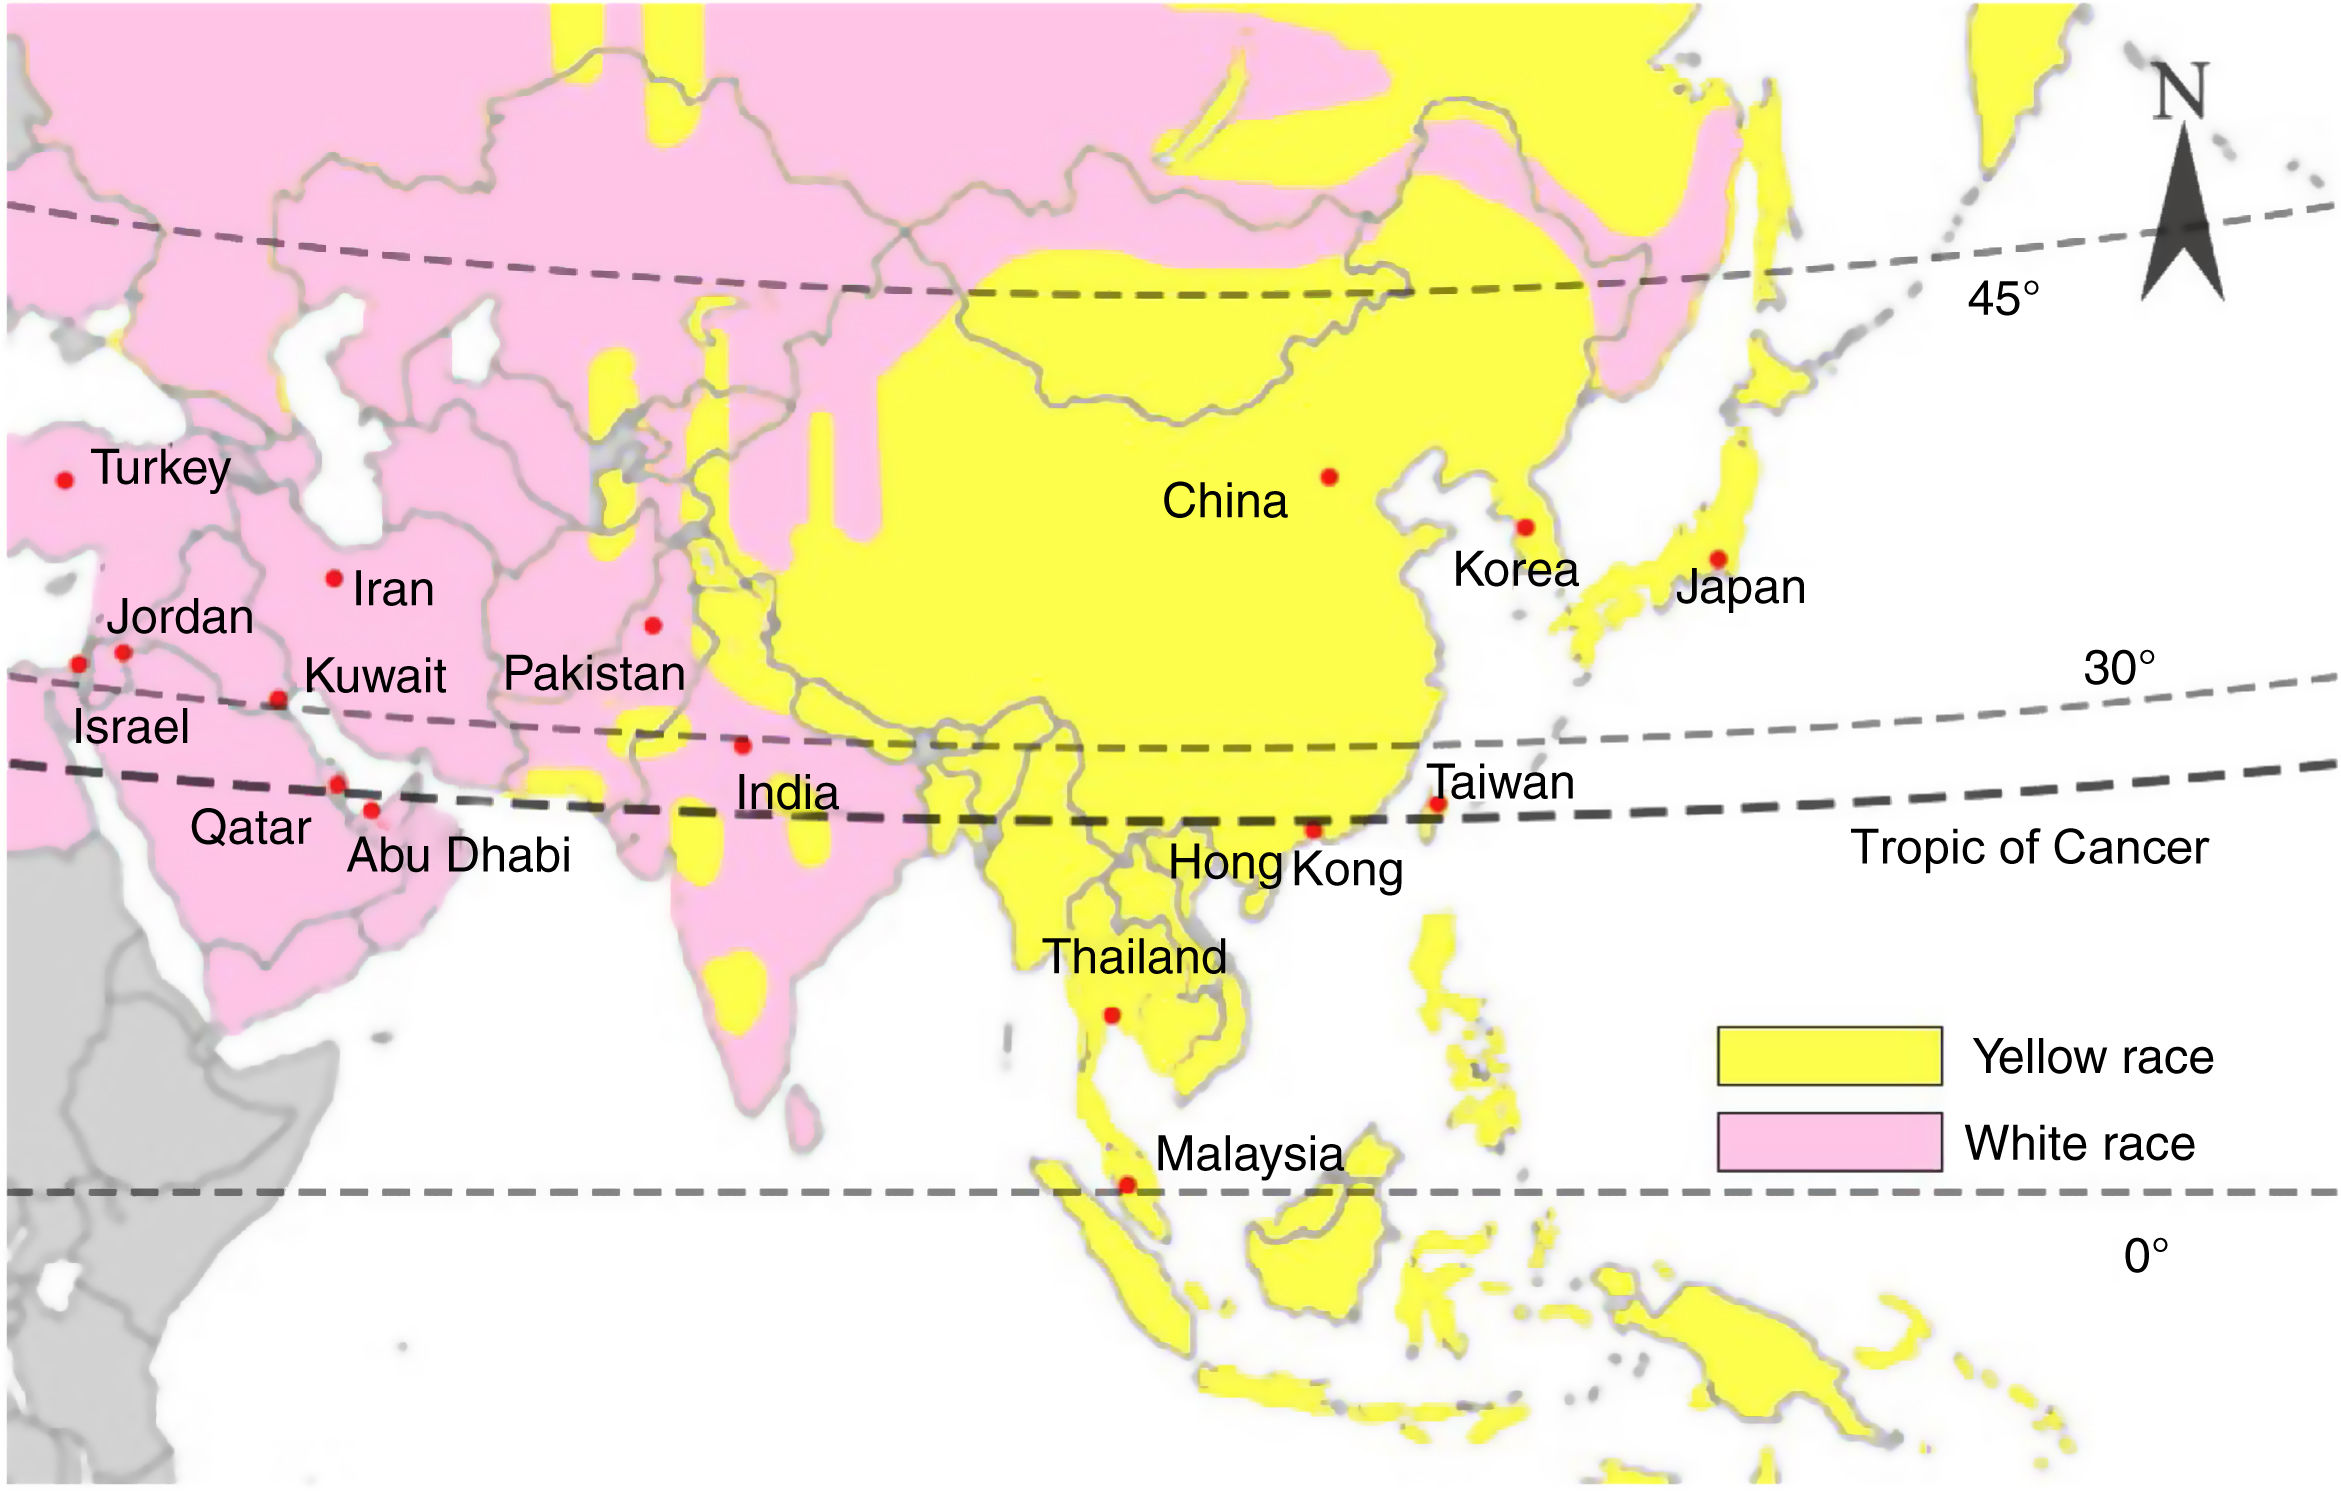
Neighbouring countries can be divided into those belonging to East Asia, South-East Asia, South Asia, West Asia, Central Asia, and North Asia. The yellow race accounts for the majority of the populations of East and South-East Asia. White populations are mainly distributed in Central, West, and South Asia (Fig. 3).
Literature review
We conducted a systematic literature review of studies included in the most relevant medical databases, including PubMed. We searched for articles addressing MS, using the search terms “multiple sclerosis,” “Chinese,” “prevalence,” and “Asia.”
We extracted relevant data from all studies identified, including information on prevalence, incidence, sex distribution, and region (particularly latitude and environmental factors).
Selection and eligibility criteriaWe used electronic databases to identify population-based studies reporting epidemiological information and statistics on MS, filtering for general studies on human populations and studies published in English. The selected articles report cross-sectional and cohort studies performed to analyse the epidemiological characteristics of MS. We reviewed the titles and abstracts of all articles identified. The systematic literature review sought to exhaustively identify all articles on the subject. Potentially eligible articles were retrieved and read in full text to confirm that they met the inclusion criteria for the literature review.
Asian countries were divided into the 5 geographical regions mentioned above (East Asia, South-East Asia, South Asia, Central Asia, and West Asia) to categorise ethnic and regional variations in MS distribution across the continent. We compared data collected in different countries.11
Data analysisWe provide a classified general description of all bibliographic data collected in the review.
All data from the different countries studied were classified according to prevalence, latitude, and year of publication (Table 1).
Prevalence (cases/100 000 population) of multiple sclerosis in Asian countries.
| Country | Prevalence | Latitude | Year |
|---|---|---|---|
| Iran | 115.9 | 35.7 | 2015 |
| Iran | 89 | 32 | 2013 |
| Iran | 88 | 35.7 | 2013 |
| Iran | 78 | 29 | 2013 |
| Iran | 54.5 | 29 | 2012 |
| Iran | 74.28 | 35.7 | 2011 |
| Iran | 85.8 | 32 | 2013 |
| Iran | 5.14 | 29 | 2006 |
| Iran | 6.1 | 29 | 2007 |
| Iran | 6.58 | 29 | 2008 |
| Iran | 7.69 | 29 | 2009 |
| Iran | 60.14 | 30.67 | 2015 |
| Japan | 16.2 | 42.9 | 2011 |
| Japan | 12.6 | 42.9 | 2006 |
| Japan | 8.1 | 42.9 | 2001 |
| Japan | 8.57 | 42.9 | 2003 |
| Japan | 18.6 | 42.9 | 2016 |
| Japan | 7.7 | 42.9 | 2003 |
| Japan | 13.1 | 42.9 | 2006 |
| Japan | 13.8 | 42.9 | 2008 |
| Korea | 3.55 | 33 | 2005 |
| Malaysia | 2 | 3 | 1997 |
| Thailand | 2 | 14 | 1993 |
| Abu Dhabi | 57.09 | 24 | 2014 |
| Kuwait | 85.05 | 29 | 2013 |
| Turkey | 101.4 | 39.9 | 2006 |
| Jordan | 38 | 32.33 | 2004 |
| Jordan | 39 | 31.57 | 2004 |
| Israel | 61.6 | 31.77 | 2000 |
| Qatar | 64.57 | 25.3 | 2012 |
| India | 8.3 | 12.9 | 2014 |
| China | 5.2 | 36 | 2013 |
| China | 1.39 | 31 | 2004 |
| China | 4.8 | 22 | 2006 |
| China | 0.88 | 22 | 1986 |
| China | 0.82 | 22 | 2002 |
| China | 1.9 | 25 | 2004 |
| China | 2.96 | 25 | 2005 |
We conducted a linear correlation analysis comparing prevalence, latitude, and year of publication. Statistical analysis was performed using the JMP statistics software.
ResultsThe literature search identified a total of 67 original articles from Asian countries (Table 1).
East AsiaChinaWe reviewed all the data obtained on MS in China (Table 2).
Hospital admissions data from Shandong province were used to report a group of patients diagnosed with MS for the first time in 2013; these data were used to estimate the incidence of the disease. That study found an upward trend in incidence as age increased, with peaks in the 15-29 and 30-44 year age ranges in women and in men, respectively. Women generally presented earlier onset and higher incidence rates than men. MS prevalence was estimated at 3.7 cases per 100 000 men and 6.7 cases per 100 000 women. Overall prevalence was estimated at 5.2 cases/100 000 population. Incidence rates were 0.12 and 0.2 cases/100 000 person-years in men and in women, respectively.14
According to official data from the Shanghai Statistical Yearbook (2004), the study area had a population of 8.86 million on prevalence day. The raw point prevalence of MS was estimated at 1.39 cases/100 000 population. By sex, the authors report prevalence rates of 0.98 cases and 1.8 cases/100 000 population in men and in women, respectively. MS prevalence was higher among women for all age groups.16
MS prevalence in Hong Kong was estimated at 0.77-4.8 cases/100 000 population.11 Patients with MS were identified in the hospital computerised surveillance system between January 1996 and June 2006. Prevalence in that 11-year period was estimated at 4.8 cases/100 000 population, with a female-to-male ratio of 3.2:1.18
In recent decades, MS prevalence has risen from 0.84 cases/100 000 population in 1975 to 1.9 cases in 1999 and 2.96 cases in 2005.11 The incidence of MS in Taiwan has been estimated at 0.79 cases/100 000 population. Incidence peaked in the 40-60 year age group in women and in the > 55 year age group in men. The female-to-male ratio was calculated at 2.5:1.19
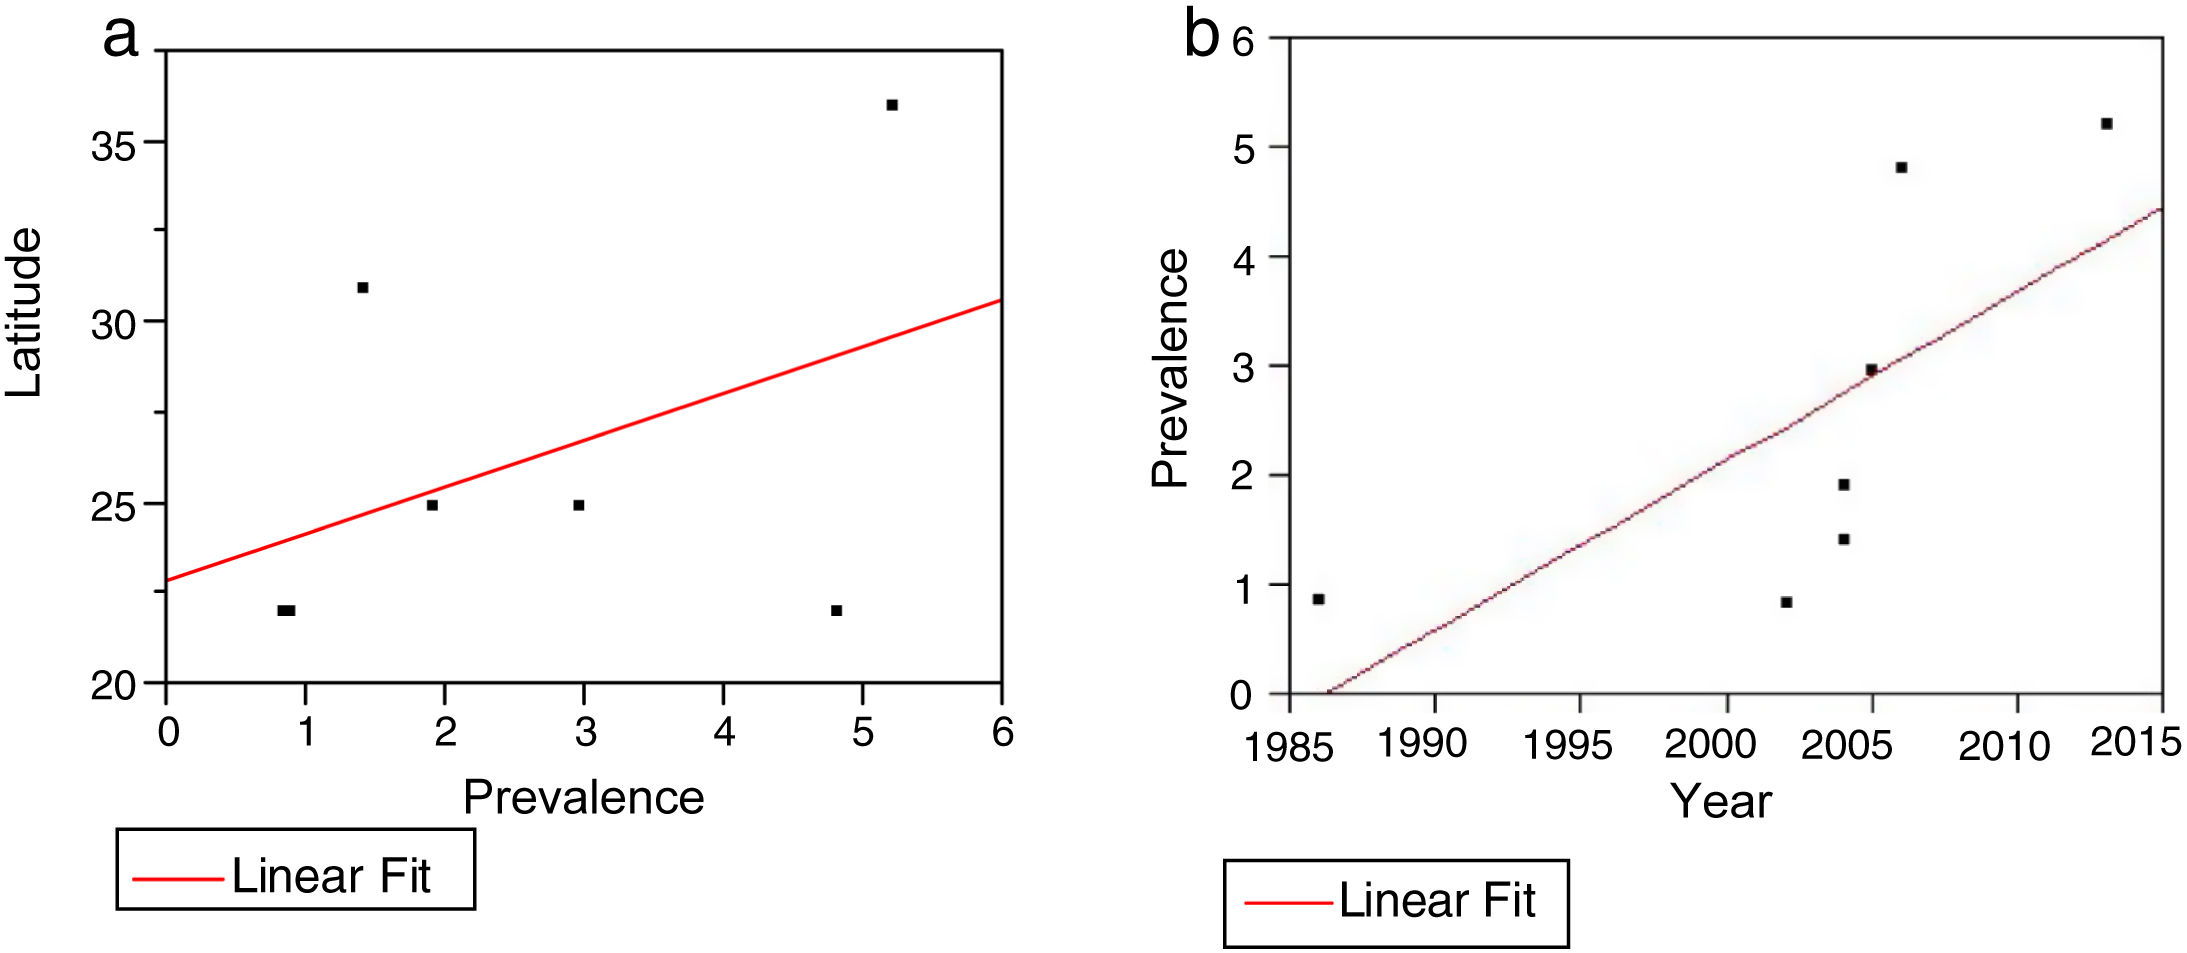
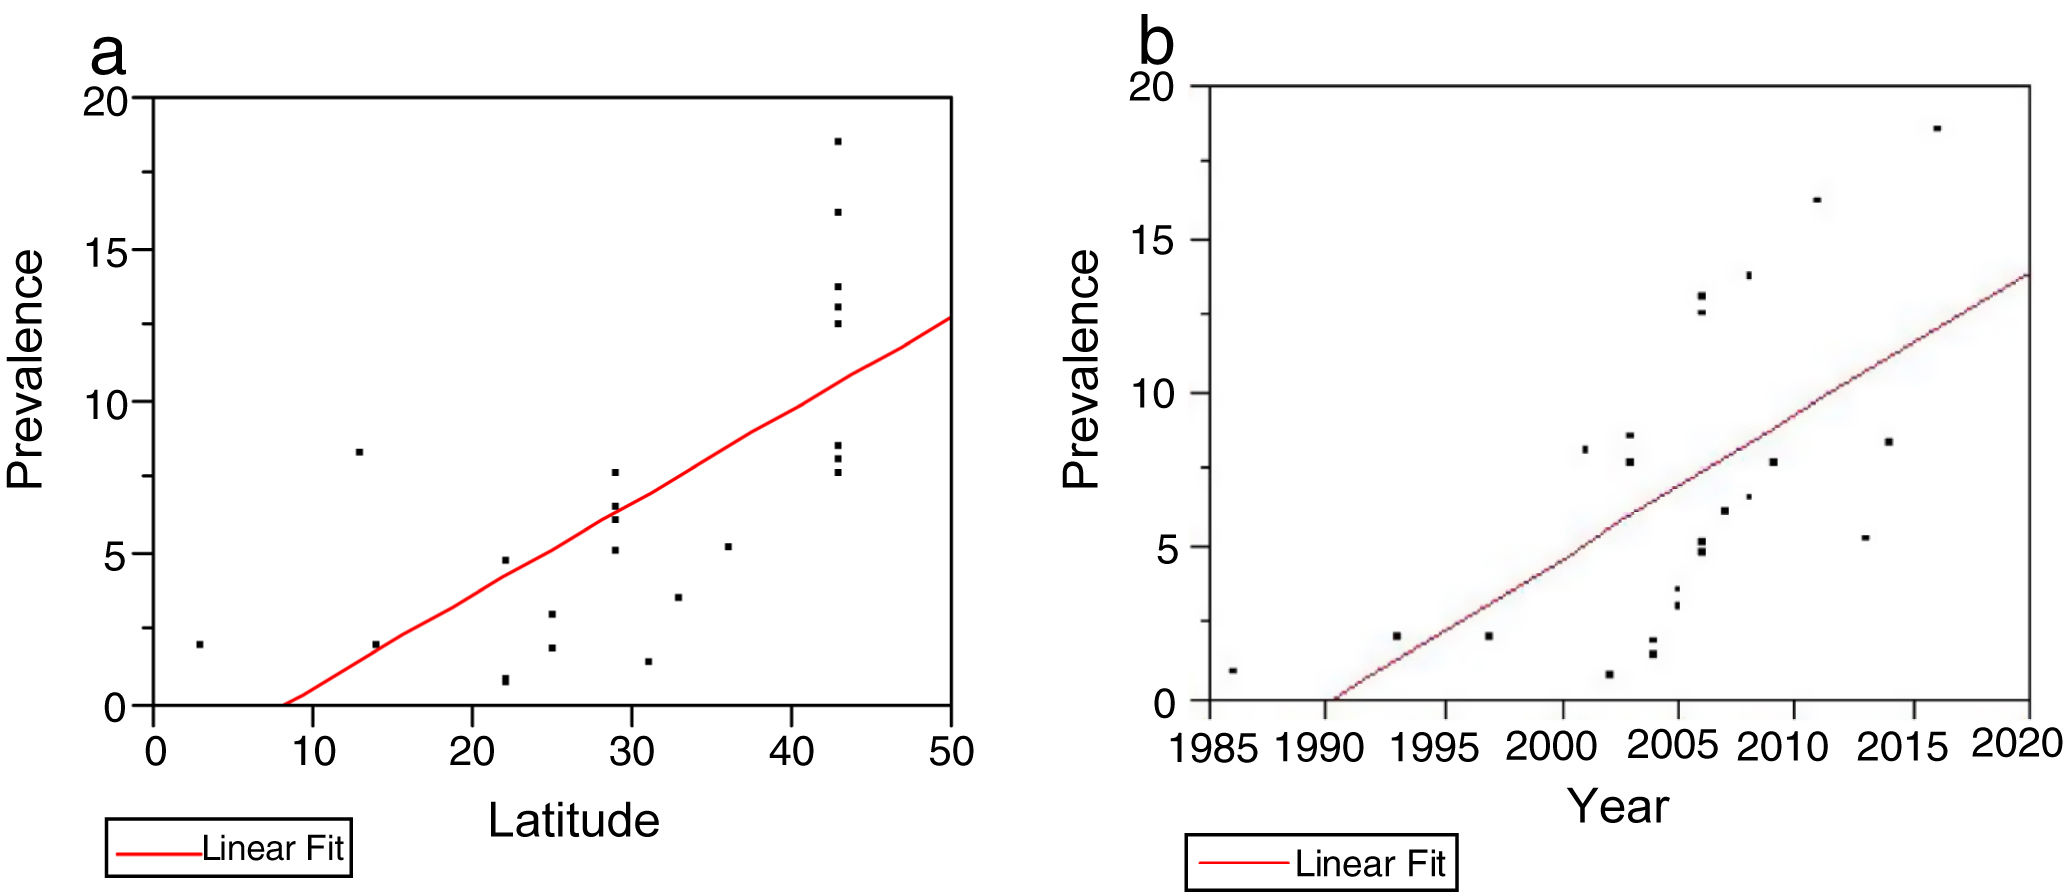
With respect to the influence of latitude on MS prevalence in China, we did not observe a significant correlation, although there was a trend towards higher rates in more northerly regions (Fig. 4A).
 The relationship between prevalence and latitude in China: we observed a non-significant positive correlation (r2 = 0.16; P = .3309). B) The relationship between prevalence and year of publication in China. We observed a positive correlation on the verge of significance (r2 = 0.48; P = .0819).")
A) The relationship between prevalence and latitude in China: we observed a non-significant positive correlation (r2 = 0.16; P = .3309). B) The relationship between prevalence and year of publication in China. We observed a positive correlation on the verge of significance (r2 = 0.48; P = .0819).
We also found no significant increase in prevalence over time, although we suspect that this may be due to the small number of studies conducted in China, as the correlation observed is close to being statistically significant (r2 = 0.48; P = .0819) (Fig. 4B).
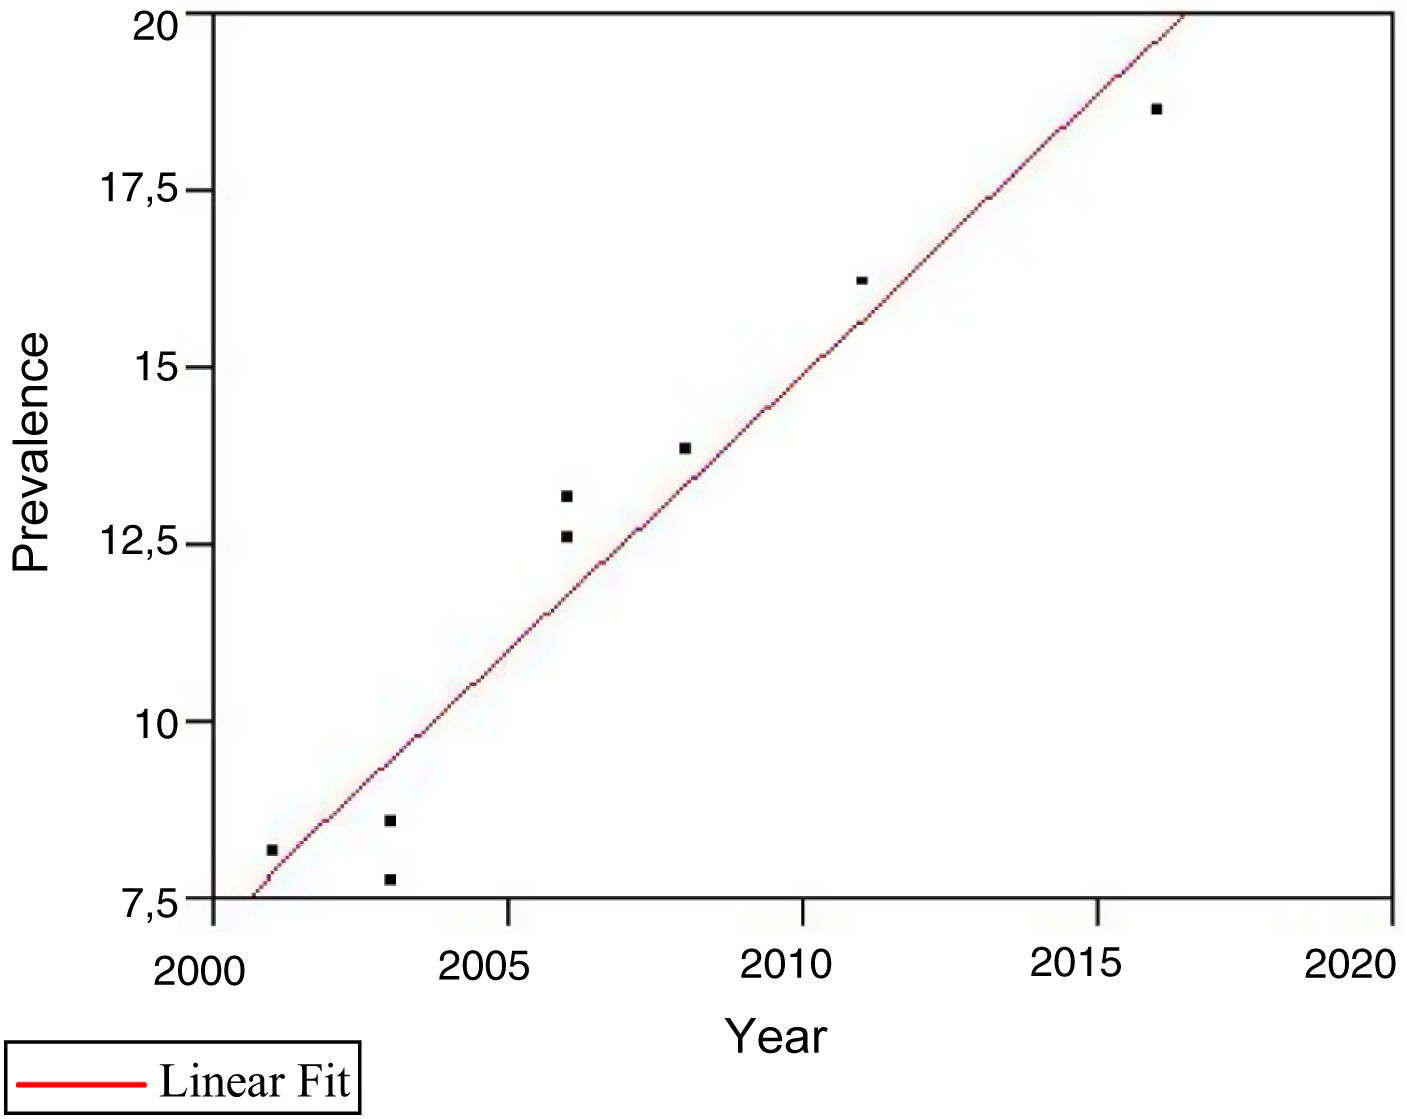
JapanIn 2016, the prevalence of MS in northern Japan was estimated at 18.6 cases/100 000 population. Over the 15 years prior, reported prevalence rates for the same area were 8.1 (2001), 12.6 (2006), and 16.2 cases/100 000 population (2011). The female-to-male ratio was 3.57:1, increasing from 2.63:1 in 2001. Age- and sex-adjusted incidence increased from 0.11 (1980-1984) to 0.68 cases/100 000 person-years (2010-2014). Incidence has remained relatively stable among men over the last 30 years, whereas in women it has increased nearly fivefold over the same period. Regarding the increase in the proportion in female patients, data from Japan are similar to those reported in Western countries, for example in the Spanish province of Seville.8
Japanese data present a very clear correlation between prevalence and year of publication (r2 = 0.93; P = .0001; Fig. 5).
Korea.")
The estimated prevalence of MS in Korea is 3.5-3.6 cases/100 000 population.20 The clinical pattern of MS in Korea is similar to that observed in other Asian countries.21 Another study conducted in Seoul estimated the prevalence of the disease at 2.4 cases/100 000 population.22 MS is more common among women, with a female-to-male ratio of 2:1.11 Korean data are similar to those reported in Western countries, for example in the Spanish province of Seville.8 The incidence of MS in Korea was estimated at 0.1 cases/100 000 person-years, with a higher rate in women than in men.23
South-East AsiaMalaysiaThe Malaysian population includes Chinese, Indian, and indigenous ethnic groups.24 Malaysia is considered a low-risk region for MS. Prevalence was estimated at 2 cases/100 000 population; the young population is most affected, with a mean age of onset of 28.6 ± 9.9 years. Female predominance is reported among patients with MS in Malaysia.11 The results of the epidemiological study in Malaysia showed that patients of Chinese origin more frequently presented neuromyelitis optica spectrum disorders rather than MS.24
ThailandNo population-based epidemiological study has been performed in Thailand to estimate the incidence and prevalence of MS. A single-based hospital study performed in Bangkok between 1977 and 1993 estimated MS prevalence at 2 cases/100 000 population.11 In a sample of 72 patients with MS, the female-to-male ratio was calculated at 6.2:1. None of the patients reported cases of MS among their family members.25
South AsiaIndiaNo sufficiently broad epidemiological study of MS has been conducted in India. Preliminary data revealed a raw prevalence rate of 8.3 cases/100 000 population. India is an enormous developing country in South Asia, with great diversity in terms of physical characteristics, culture, religion, caste, language, and race. The racial diversity of India is well known. However, few data are available on MS profiles in the northernmost part of the country.5
IranA population-based study was conducted using data from the registry system of the Iranian MS Society for Iran's capital Tehran (latitude: 35° N; longitude: 51° E), with an estimated population of 12 684 000 in 2015. MS prevalence increased significantly over the study period (1999-2015), reaching 115.94 cases/100 000 population in 2015. Age-standardised prevalence was estimated at 197.21 and 63.23 cases/100 000 population in women and in men, respectively. In the period 2006-2015, a significant upward trend was observed in MS prevalence.26
Different prevalence rates have been reported in different regions of Iran. By region, reported cases/100 000 population are as follows: in northern Iran, 89, 78, and 115.94 cases in Isfahan, Farsan, and Tehran, respectively26; 7.69 cases in south-east Iran (incidence of 1.47 cases/100 000 person-years)4; and 60.14 in south-west Iran.1
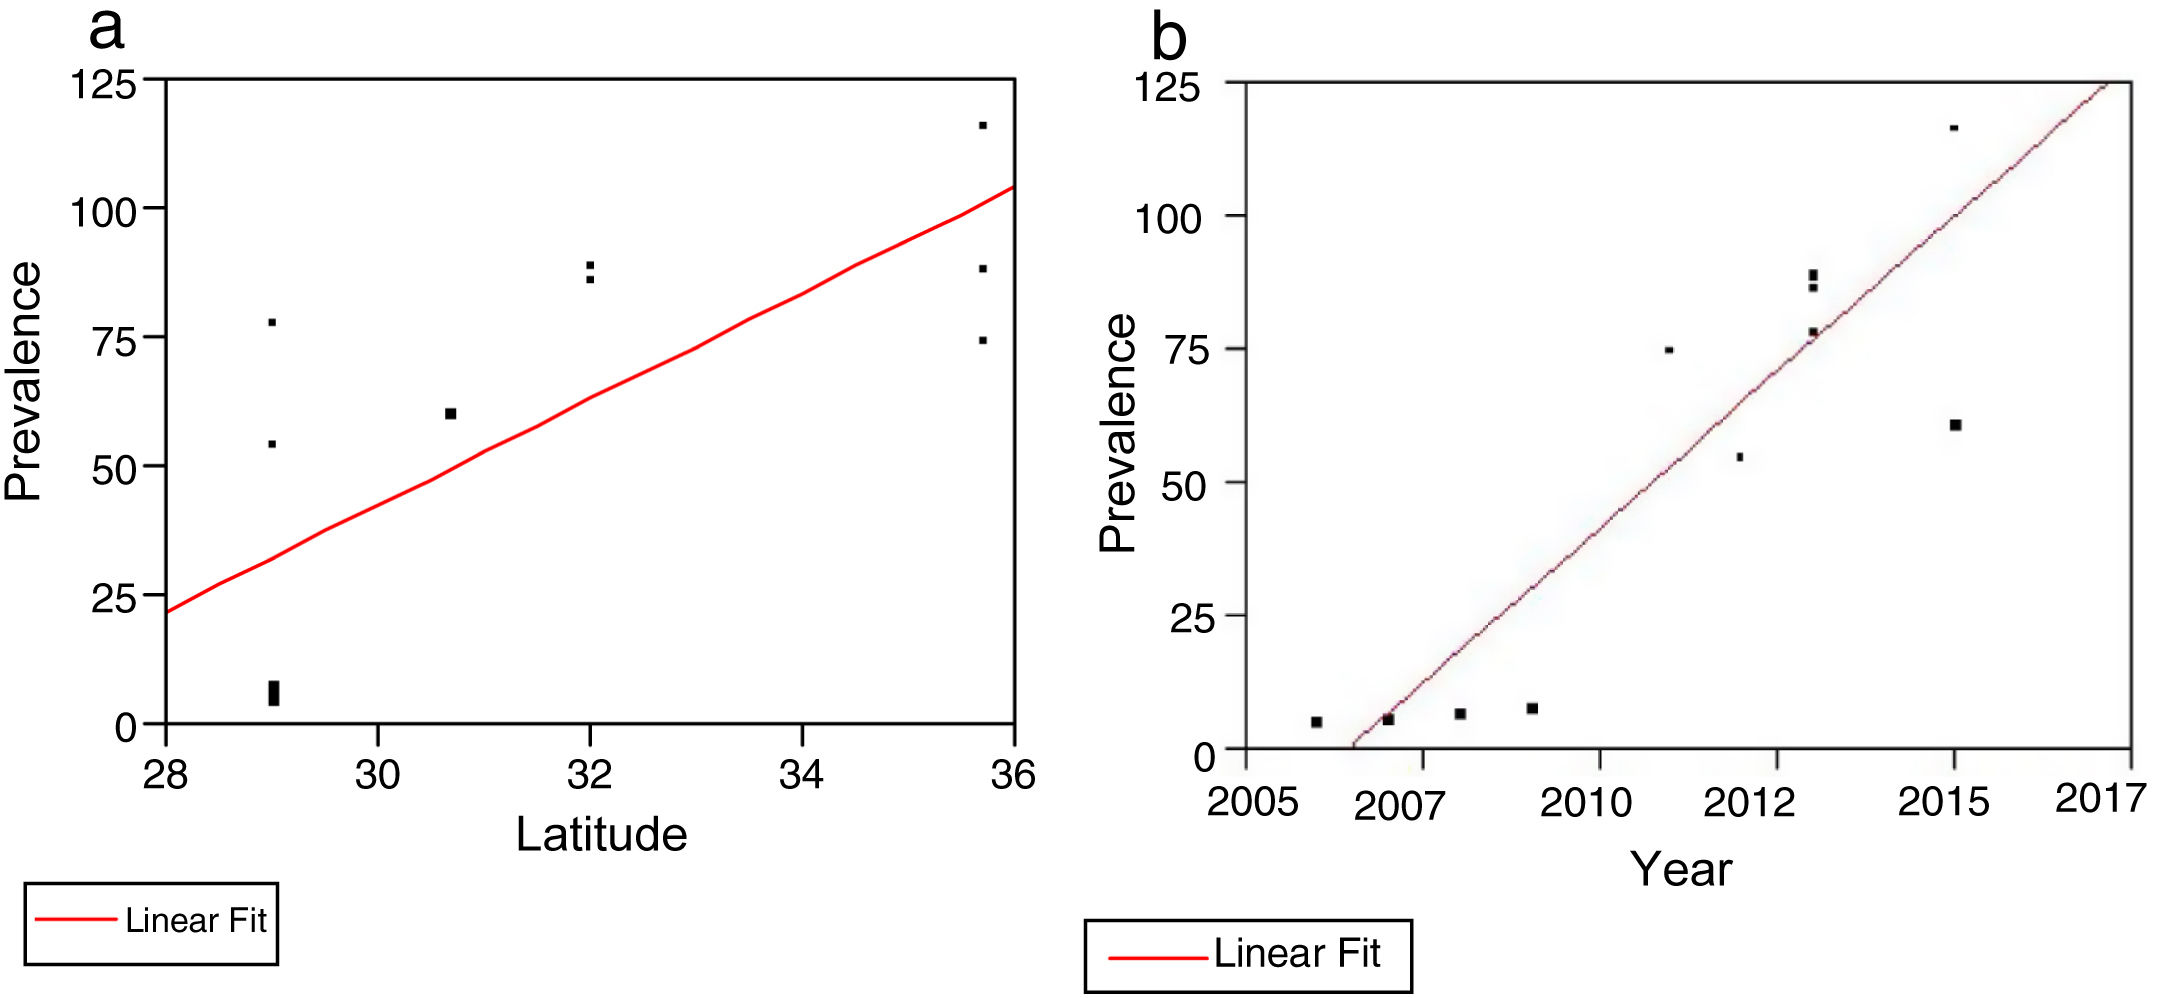
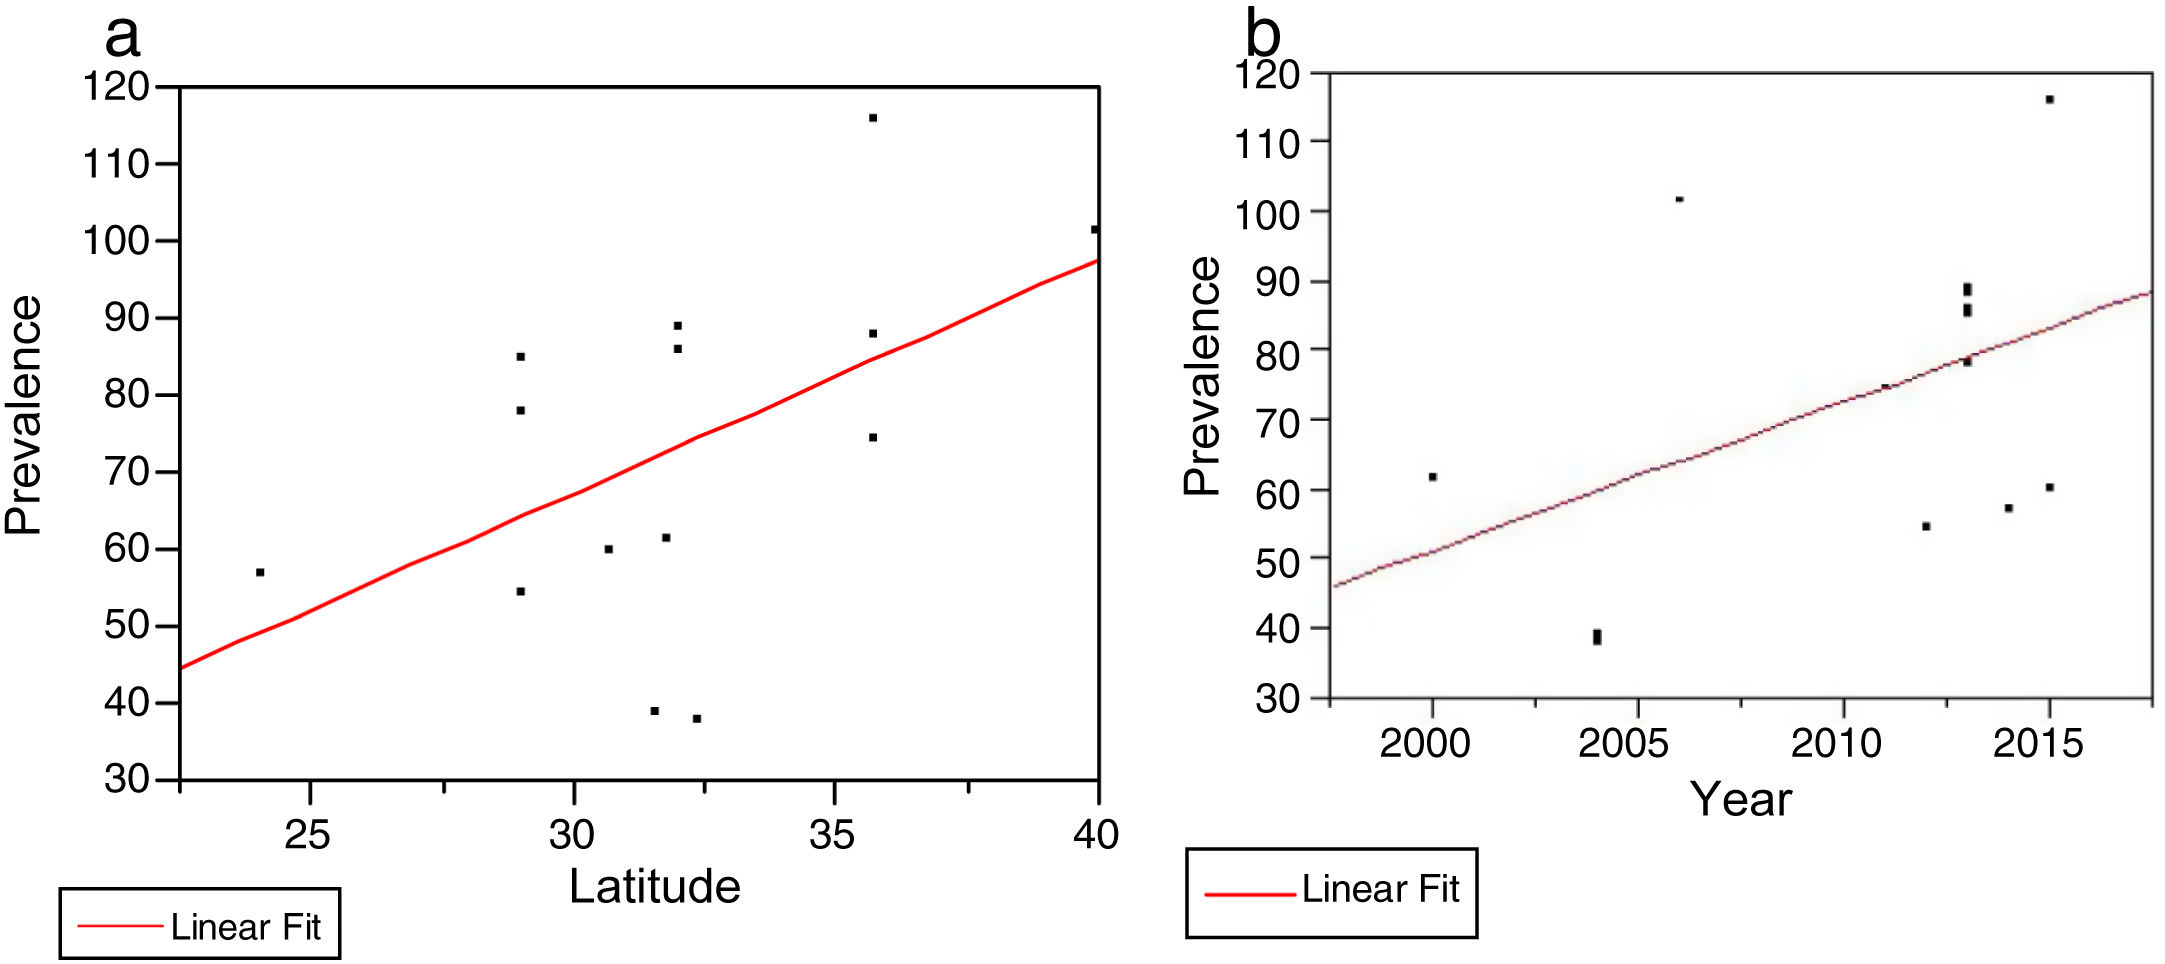
The Iranian studies reviewed presented a clear, statistically significant correlation between prevalence rates and latitude (r2 = 0.55; P = .0054; Fig. 6A).
 The relationship between prevalence and latitude in Iran. We observed a significant positive correlation (r2 = 0.55; P = .0054). B) The relationship between prevalence and year of publication in Iran. We observed a significant positive correlation (r2 = 0.79; P = .0001).")
We also found a clear correlation between prevalence data and year of publication (r2 = 0.79; P = .0001; Fig. 6B).
PakistanNo population-based studies have been conducted on MS prevalence or incidence in Pakistan. A multicentre database of hospitals in Karachi, Peshawar, and Islamabad included 142 patients with MS, reporting a mean age of onset of 27 years and a female-to-male ratio of 1.45:1.
Western AsiaQatarThe state of Qatar (latitude: 25° 30’ N; longitude: 51° 15’ E) is located on the eastern coast of the Arabian Peninsula, and is bordered by the Persian Gulf and Saudi Arabia. At 31 April 2010, the prevalence of MS in the population of Qatar was estimated at 64.57 cases/100 000 population.27
JordanAccording to the 2004 census by the Jordanian Department of Statistics, the prevalence of MS was 39 cases/100 000 population in Amman and 38 cases in Irbid.28
IsraelThe age-adjusted prevalence rate of definite, clinically definite, and probable MS among Israeli-born Jews was 61.6 cases/100 000 population.29
TurkeyThe overall prevalence of MS was estimated at 101.4 cases/100 000 population, with rates of 118.7 and 76.0 cases/100 000 population in women and in men, respectively.30 Data reported in Turkey are similar to those reported in Western countries, for example in the Spanish province of Seville.8
Abu DhabiThe overall prevalence of MS (both sexes, all ages) was 57.09 cases/100 000 population. Incidence was estimated at 5.4 cases/100 000 person-years.31 These data are similar to those reported in Western countries, for example in the Spanish province of Seville.8
KuwaitThe prevalence of MS in Kuwait was estimated at 85.05 cases/100 000 population, with a peak between the ages of 30 and 39 years. MS incidence was 6.88 cases/100 000 person-years. Between 2003 and 2011, incidence increased 3.22 times in women and 2.54 times in men.32 These data are similar to those reported in Western countries, for example in the Spanish province of Seville.8
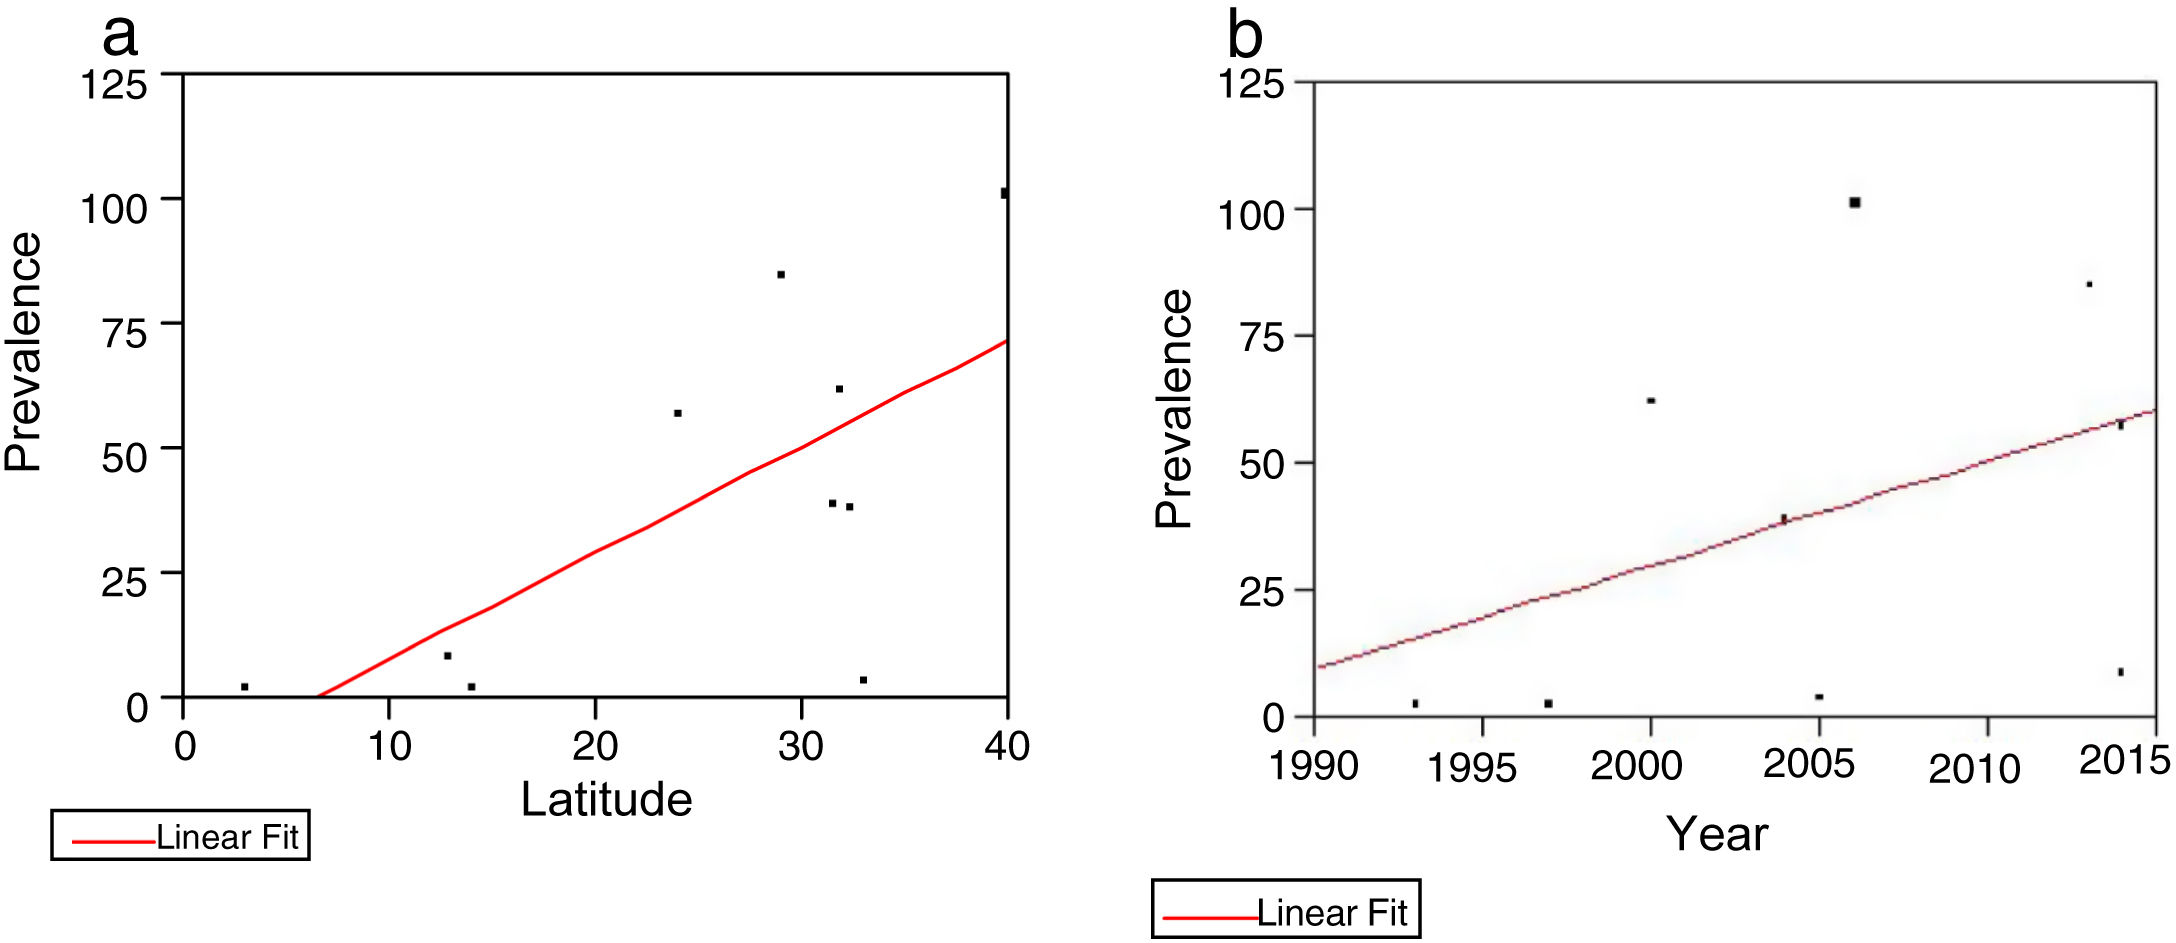
Analysis of data on prevalence and latitude for the Asian countries studied (Korea, Israel, Jordan, Malaysia, Thailand, India, Pakistan, Qatar, Kuwait, Turkey, and Abu Dhabi) revealed a statistically significant correlation between prevalence rates and latitude (r2 = 0.46; P = .0309; Fig. 7A).
 The relationship between prevalence and latitude in the remaining countries studied. We observed a significant positive correlation (r2 = 0.46; P = .0309). B) More recent studies showed higher prevalence rates, although this correlation was not statistically significant.")
We also observed higher prevalence rates in more recent studies, although this correlation was not statistically significant (Fig. 7B).
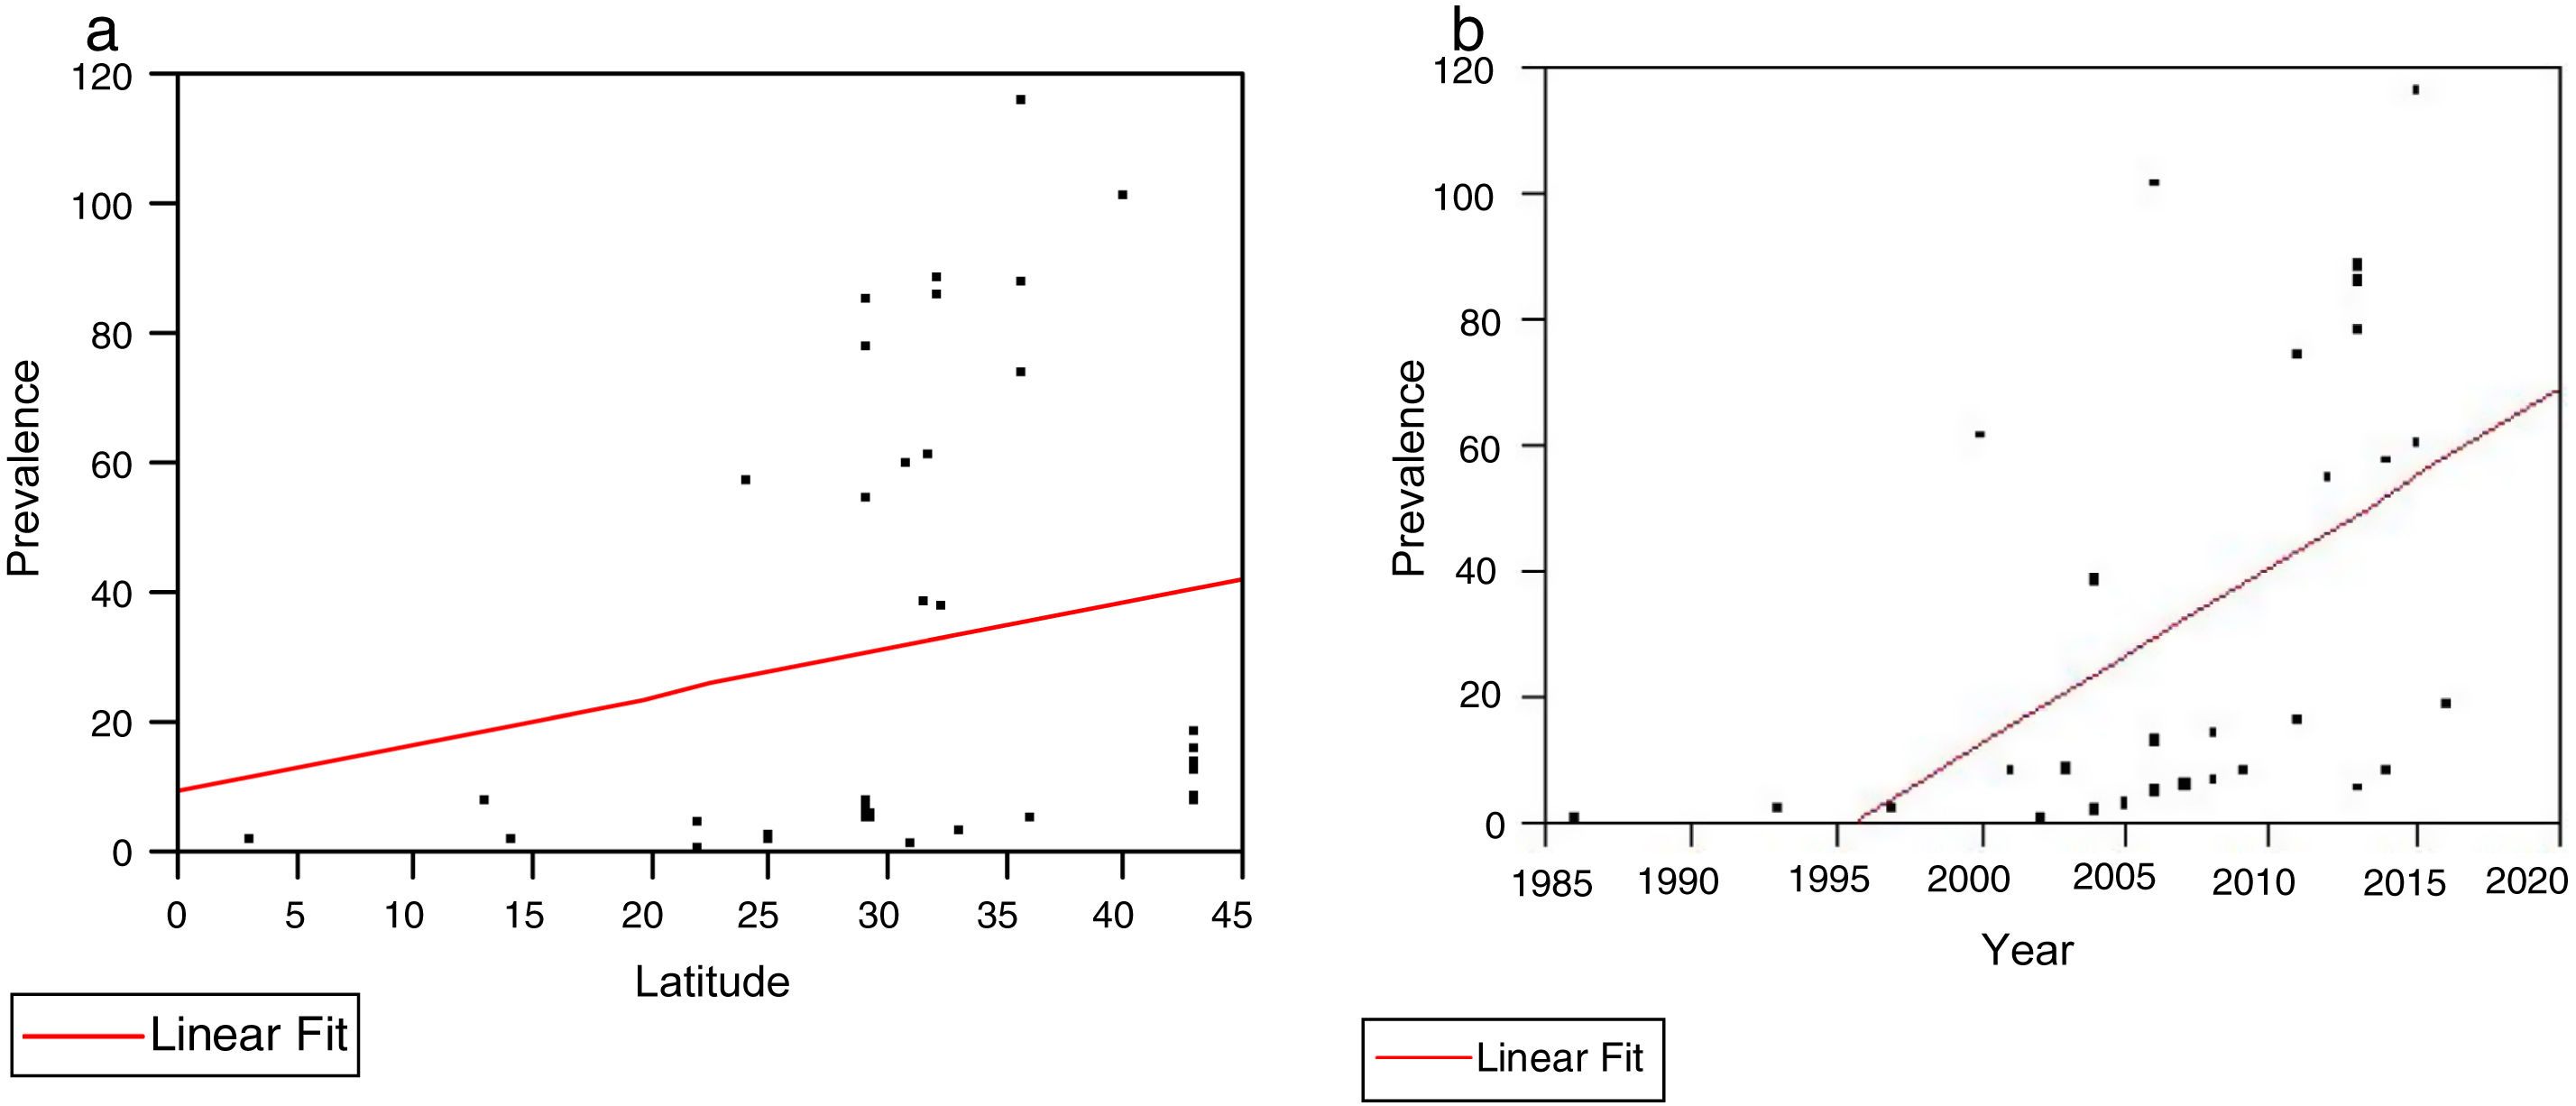
Global analysis of epidemiological data from all countries studiedStatistical significance of the correlation between latitude and prevalence was lost when the entire region studied was included in the analysis (Fig. 8A).
 The relationship between prevalence and latitude in all Asian countries studied. We observed a non-significant positive correlation (r2 = 0.036; P = .2587). The relationship between prevalence and year of publication in all Asian countries studied. We observed a significant positive correlation (r2 = 0.26; P = .001).")
A) The relationship between prevalence and latitude in all Asian countries studied. We observed a non-significant positive correlation (r2 = 0.036; P = .2587). The relationship between prevalence and year of publication in all Asian countries studied. We observed a significant positive correlation (r2 = 0.26; P = .001).
However, the correlation between prevalence and year of publication remained significant (r2 = 0.26; P = .001; Fig. 8B).
In the light of the pronounced split observed in prevalence data (much higher prevalence in countries with predominantly white populations), we decided to establish 2 groups of countries (high/low prevalence) for separate analysis.
Low-prevalence groupIn the low-prevalence group of countries, we observed a very clear correlation between prevalence and latitude (r2 = 0.47; P = .0003; Fig. 9A).
 The relationship between prevalence and latitude in low-prevalence countries, showing a positive correlation (r2 = 0.47; P = .0003). B) The relationship between prevalence and year of publication in low-prevalence countries. We observed a significant positive correlation (r2 = 0.36; P = .0021).")
A) The relationship between prevalence and latitude in low-prevalence countries, showing a positive correlation (r2 = 0.47; P = .0003). B) The relationship between prevalence and year of publication in low-prevalence countries. We observed a significant positive correlation (r2 = 0.36; P = .0021).
A clear correlation was also observed between prevalence and date of publication (r2 = 0.36; P = .0021; Fig. 9B).
High-prevalence groupIn the high-prevalence group of countries, we observed a clear but non-significant trend towards higher prevalence at higher latitudes (Fig. 10A).
 The relationship between prevalence and latitude in high-prevalence countries. We observed a positive correlation on the verge of significance (r2 = 0.26; P = .0570). The relationship between prevalence and year of publication in high-prevalence countries. We observed a positive correlation on the verge of significance (r2 = 0.20; P = .1038).")
A) The relationship between prevalence and latitude in high-prevalence countries. We observed a positive correlation on the verge of significance (r2 = 0.26; P = .0570). The relationship between prevalence and year of publication in high-prevalence countries. We observed a positive correlation on the verge of significance (r2 = 0.20; P = .1038).
We also observed a non-significant correlation between prevalence and year of publication (Fig. 10B).
Table 3 summarises the available data on prevalence in each sex, showing a clear female predominance.
Prevalence of multiple sclerosis in the different Asian countries studied, by sex.
| Country | Prevalence (men) | Prevalence (women) | M:F | Year |
|---|---|---|---|---|
| China, Shandong | 3.7 | 6.7 | 1:1.8 | 2013 |
| China, Shanghai | 0.98 | 1.8 | 1:1.8 | 2004 |
| China, Hong Kong | 1:3.2 | 2006 | ||
| China, Taiwan | 1:2.5 | 2005 | ||
| Japan | 8.5 | 27.9 | 1:3.3 | 2016 |
| Japan | 7.7 | 24 | 1:3.1 | 2011 |
| Japan | 7.7 | 17.7 | 1:2.3 | 2006 |
| Japan | 4.6 | 11.2 | 1:2.4 | 2001 |
| Korea | 3.1 | 3.9 | 1:1.26 | 2005 |
| Iran, Tehran | 63.23 | 197.21 | 1:3.1 | 2015 |
| Iran, Tehran | 37.41 | 113.49 | 1:3.03 | 2011 |
| United Arab Emirates | 38.4 | 76.89 | 1:2.0 | 2014 |
| Turkey | 76 | 118.7 | 1:1.6 | 2006 |
| Jordan, Irbid | 11 | 61 | 1:5.55 | 2004 |
| Jordan, Amman | 21 | 57 | 1:2.7 | 2004 |
| Qatar | 1:1.33 | 2010 | ||
| Kuwait | 60.82 | 108.92 | 1:1.8 | 2013 |
| India | 1:1.6 | 2014 | ||
| Thailand | 1:6.2 | 2007 | ||
| Malaysia | 1:5.1 | 1997 | ||
| Pakistan | 1:1.45 | 2007 |
Relevant findings from our analysis may be summarised as follows: prevalence rates in China range from 0.88 (1986) to 5.2 cases/100 000 population (2013), with a non-significant upward trend in prevalence (P = .08), whereas Japanese data do show a significant increase from 8.1 to 18.6 cases/100 000 population (P < .001).
Prevalence was much higher in countries with predominantly white populations, and increased over time, reaching 115 cases/100 000 population in 2015 (r2 = 0.79; P = .0001). We observed no association between risk of MS and diet- or climate-related factors.
According to our findings, higher latitude may represent a risk factor for MS in Asian countries, but appears to be less significant than previously thought.
DiscussionWe conducted a systematic review of epidemiological studies of MS in Asian countries, with particular focus on 4 Chinese regions. Our results are restricted by the limited available data, which may have influenced the prevalence, incidence, sex ratios, and mean age of onset observed. The studies reviewed present variations in data quality, sample size, diagnostic criteria, and reporting methods. Our review only included studies published in English.
Comparing prevalence and incidence rates between countries with diverse populations can represent a challenge. National and regional registries are not exhaustive or fully reliable, as they often include patient-reported data. However, we made considerable efforts to obtain data on estimated global rates.
As mentioned previously, population size can be a relevant source of bias in prevalence studies. As a general principle, the inclusion of very large populations enables more accurate estimation, although it also involves various problems, such as the loss of detail, ethnic heterogeneity, high costs, and difficulties in applying uniform diagnostic criteria and interpreting statistical significance. Most studies performed in Western Europe include populations of 200 000-500 000, an optimal size.10
Although research into rare diseases is increasingly necessary, the epidemiological study of these diseases remains a novel approach. The collection of epidemiological data on rare diseases primarily requires disease registry systems or extrapolation from other data resources. China currently does not have a specific registry of rare diseases, and data on important epidemiological parameters, such as prevalence and morbidity burden, are insufficient for the majority of rare diseases.14,33,34
The prevalence and incidence of MS vary between different parts of Asia; however, the limited national-level epidemiological data available, the poor response capacity, and the limited diagnostic infrastructure have significantly influenced the reporting of MS in many countries in the region. Some Asian countries, such as Iran and Japan, have reported higher prevalence rates in the last decade.35,36
Our literature review revealed a small but acceptable number of estimates of prevalence rates; however, as this was not the case for incidence, we focused on prevalence data, despite the fact that incidence better characterises the epidemiology of diseases.
The availability of neurologists and diagnostic tools is strongly linked to the diagnosis of MS; as a result, the prevalence of MS in Asia may rise in line with increases in access to neurology departments.37 According to the 2013 Atlas of MS, the median number of neurologists per 100 000 population is only 0.03 in low-income countries, compared to 3.6 in richer countries. The number of MRI scanners in low, low-middle, and upper-middle income countries doubled between 2008 and 2013, although great differences remain between individual countries.11 While the number of MRI scanners per 100 000 population was 0.46 worldwide in 2013, with 1.6 and 0.4 in high and upper-middle income countries, respectively, lower rates of 0.01 were reported in middle, lower-middle, and low income countries.11
One study demonstrated that in the Japanese population, latitude and UV exposure are significantly correlated with MS prevalence, whereas sunlight duration is not. Furthermore, a stepwise multiple linear regression analysis found that of the 3 factors, latitude had the greatest influence on MS prevalence.12
A recent comprehensive meta-analysis established a statistically significant positive correlation between global MS prevalence and latitude, with exceptions in Italy and northern Scandinavia.38
Considerable differences exist between the MS prevalence rates reported in different populations, with rates up to 100 times higher in high-prevalence regions (> 200 cases/100 000 population, vs < 1 case in low-prevalence areas).
China is considered a low-prevalence region. This is probably explained in part by the fact that, in China, MS is underdiagnosed or diagnosed late. Therefore, we must take into account the role of underdiagnosis of the disease as a source of bias.
Our results suggest that up to a quarter of patients diagnosed (by a neurologist) with other demyelinating diseases of the CNS at discharge should in fact be diagnosed with MS, according to the McDonald criteria. One explanation for this observation may be that, because MS is considered a rare disease in China, physicians may have uncertainties about diagnosing it in their practice. This explanation may be supported by our findings: the positive predictive value of a diagnosis of MS according to the McDonald criteria was greater than 90%, whereas the negative predictive value was only 73.4%. Furthermore, long-term follow up is not routinely performed at present in the Chinese healthcare system, and many patients with possible or probable MS may not promptly receive a definitive diagnosis.39
The southern and northern Chinese regions we studied are categorised as upper-medium and low-medium income areas, respectively. We also reviewed the most recent reports of MS prevalence in China, particularly in Shanghai, Shandong province, Taiwan, and Hong Kong. To a certain extent, prevalence is associated with latitude. However, geographical differences also play a role. Most of the regions studied have a higher socioeconomic level in terms of gross national income per capita and gross national product per capita, and better diagnostic indicators, such as better access to diagnostic infrastructure and specialist physicians. Furthermore, diagnosis of MS may be less frequent in low-income regions; relatively few articles have addressed this subject.
Limited research has been conducted in China. The first reason for this is social and economic limitations. The exact effects of such factors as healthcare services and environmental pollution are not well quantified. There are some differences in the national medical system, and insufficient morbidity data are available. However, the reality in China is that data on rare diseases are restricted and difficult to use. Currently, 92.5% of cases of rare diseases in China are diagnosed at provincial and university hospitals.34 Epidemiological studies on MS require studies outside of hospitals. The Chinese state has taken a series of effective measures to improve the diagnosis of rare diseases. However, the incidence rate obtained in this study is appropriate for use. In future studies we will gather additional information on MS to complement these findings. We believe that, once these data are available, we will be able to estimate the epidemiological parameters of the disease with greater accuracy.14
MS prevalence was low in East Asian countries, with estimated rates of 0.8-2 cases/100 000 population.40 In western Asia, rates were higher. Reported MS prevalence rates from the last decade are lower in the Chinese population than in other Asian countries.16
MS distribution varies between races and geographical regions. A north-south gradient in prevalence is reported in the Northern Hemisphere, with a south-north gradient in the Southern Hemisphere. The disease is generally rare in tropical regions, with higher rates in temperate areas, although there are some exceptions to this rule. White populations of Scandinavian and Scottish descent are extremely susceptible to the disease. On the other hand, Mongolian, Japanese, and Chinese populations present much lower prevalence rates.28
This study confirmed that female-to-male ratio in Japan has been increasing for over 15 years, with higher incidence rates among women playing a role. This increase in the female-to-male ratio strongly suggests the existence of an environmental influence on the risk of MS, with environmental factors acting at the population level rather than at the individual level.10
These data are similar to those reported in Western countries, for example in the Spanish province of Seville.8
Korea presents one of the lowest MS prevalence rates among countries at the same latitude.23 MS prevalence varies greatly between regions, peaking at latitudes of 45°-65°. The adjusted prevalence rate of MS in the United Kingdom (mean latitude of 54.6° N) is 21 cases/100 000 population, with a rate of 4 cases/100 000 population reported in northern Latin America (mean latitude of 20.7° S).41
In a study addressing the 20-year incidence trend and point prevalence of MS in Tehran (Iran), Elhami et al. reported 8026 definite cases of MS from the period 1989-2008, observing a significant increase in incidence, peaking in 2005 (4.58 cases/100 000 population). In 2009, they reported a prevalence rate of 50.57 cases/100 000 population in a population of 7896 individuals, with 77.24 and 25.54 cases/100 000 population in women and men, respectively. According to those results, the female-to-male ratio amounts to 3.11. Rates were highest between the ages of 35-39 years in women and 40-44 years in men. A similar study noted an increase in MS prevalence between different time intervals.1
The lack of referral of patients with mild symptoms at onset and variations in differential diagnosis, as well as the lack of diagnostic facilities, particularly in developing countries, are the main obstacles causing the delay in definitive diagnosis and, consequently, the variation in prevalence and incidence rates between different regions globally.1
The epidemiological and demographic data reported in the present study are generally consistent with epidemiological data on MS reported by other authors (for instance, the greater prevalence in women and in middle age). Other studies mention problems including greater prevalence rates in population groups with lower education and socioeconomic levels. Several studies suggest that this correlation is caused by higher rates of smoking and vitamin D deficiency in these groups.
The MS prevalence rate calculated in Kuwait in 2013 was 85.05 cases/100 000 population, a higher rate than those reported in other parts of the Persian Gulf (eg, Dubai, 54.77; Saudi Arabia, 40; Qatar, 64.57) and the Middle East (Jordan, 38-39; Iran, 44-52). The factors contributing to these differences in prevalence may include methodological differences between studies, as well as genetic, environmental, and cultural factors. The annual incidence rate of MS in Kuwait increased from 1.05 to 6.88 cases/100 000 person-years between 1993 and 2011 (9.1 in women and 4.6 in men).32 Between 2003 and 2011, incidence increased by 3.22 times in women and 2.54 times in men. Increases in the incidence of MS have also been reported in other Middle Eastern countries, including Jordan, Saudi Arabia, Iran, and Iraq.
International studies from China and Japan also report higher MS incidence. This upward trend may be explained by numerous factors, including a real worldwide increase in prevalence, greater public awareness, socioeconomic changes, and improvements in healthcare systems. In line with updates to diagnostic criteria, medical facilities have also improved, and the use of MRI studies may increase detection.32
Regarding sex, our study found MS to be more prevalent among women; this is consistent with the results of other studies from the region. However, the majority of recent epidemiological studies interpret this worldwide trend as a result of environmental factors (lifestyle, vitamin D deficiency, smoking) or sex-specific epigenetic interactions.42 The incidence of MS in women appears to be increasing worldwide, including in China and neighbouring countries. The medical care afforded to women is constantly improving, which has resulted in earlier diagnosis, particularly of more benign forms.43
ConclusionsMS is a rare disease in China, although its prevalence appears to have increased in recent years.
MS is more frequent among women in China and other Asian countries, similarly to the observations reported in Europe and North America.
In Asia, MS risk is lower in the yellow race (Chinese and Japanese people, among others) than in Caucasian (white and Arab) populations.
We found no evidence of a relationship between MS risk and diet or climate in Asia.
According to our findings, latitude appears to be associated with greater risk of MS in Asian populations, although its impact seems to be less significant than previously thought.
Conflicts of interestThe authors have no conflicts of interest to declare.
