


Mortality in Parkinson’s disease is increasing worldwide, but Spanish data need further study.
ObjectiveTo analyse the mortality trends of Parkinson’s disease in Spain between 1981 and 2020.
MethodsThis observational retrospective study assessed the Parkinson’s disease mortality data from 1981 to 2020 collected from the National Statistics Institute of Spain. Age-standardised mortality rates were analysed by age and sex groups, detecting significant mortality trends through a joinpoint analysis. Age-period-cohort effect and potential years of life lost analyses were conducted. The European standard population of 2013 was considered for the analyses.
ResultsA total of 88 034 deaths were assessed. The overall age-standardised mortality rate rose throughout the period from 3.67 to 8.57 per 100 000 inhabitants. Mortality rates in men were higher than in women, 11.63 versus 6.57 deaths per 100 000 inhabitants. The sex ratio showed an increase in premature mortality in men during 2020. The overall joinpoint analysis recorded a rise in mortality, primarily since the 20th century, mainly in male and older groups, that matched with a period effect. The age effect was detected, confirming higher mortality at an older age. The analysis of potential years of life lost detected a growth in this rate, changing from 0.66 in 1981 to 1.06 in 2020.
ConclusionsMortality data for Parkinson’s disease in Spain rose significantly in forty years. Mortality rate was higher in the male and age group above 75 years of age. The sex ratio showed premature mortality in men in 2020, which will need further study.
La mortalidad de la Enfermedad de Parkinson está incrementando a nivel mundial, pero los datos españoles necesitan ser estudiados en profundidad.
ObjetivoAnalizar las tendencias de mortalidad de la Enfermedad de Parkinson en España entre 1981 y 2020.
MétodosEste estudio observacional retrospectivo analizó los datos de mortalidad de la Enfermedad de Parkinson extraídos desde 1981 a 2020 del Instituto Nacional de Estadística de España. Las tasas de mortalidad estandarizada por edad fueron analizadas por grupos de edad y sexo, detectando cambios de tendencia de mortalidad significativos mediate un análisis de joinpoint. Se llevaron a cabo análisis de Edad-Periodo-Cohorte y años potenciales de vida perdidos. La población estándar europea fue considerada para el análisis.
ResultadosUn total de 88.034 defunciones fueron examinadas. La tasa global de mortalidad estandarizada por edad creció a lo largo del periodo estudiado desde 3,67 a 8,47 por cada 100.000 habitantes. Las tasas de mortalidad fueron mayores en hombre que en mujeres, 11,63 frente a 6,57 fallecimientos por cada 100.000 habitantes. La proporción de sexo mostró un incremento en la mortalidad prematura en hombre durante 2020. El análisis de joinpoint global reportó un aumento de mortalidad, principalmente desde el siglo XX, siendo más notable en hombre y grupos de edad avanzada, que coincidió con un efecto periodo. Se detectó un efecto de edad confirmando una mayor mortalidad a edad más edad avanza. El análisis de años potenciales de vida perdidos detectó un crecimiento en esta tasa, cambiando de un 0,66 en 1981 a 1,06 en 2020.
ConclusionesLos datos de mortalidad para la Enfermedad de Parkinson en España ha incrementado significativamente durante cuarenta años. La tasa de mortalidad fue mayor en hombre y en grupos de edad mayores de 75 años de edad. La proporción de sexo mostró una mortalidad prematura en hombres en 2020, que necesitará ser estudiado en mayor profundidad.
Parkinson’s disease (PD) is the second most common neurological disease worldwide and is expected to double its prevalence in the next 3 decades.1 PD is a neurodegenerative disease characterised by cell loss of the substantia nigra and other central areas, but the primary aetiology is still unknown.2 The first PD denomination was made in 1817 by James Parkinson,3 so the first registries of mortality started after this date. Diagnostic criteria for PD have changed over the years, until the MDS criteria were established in 2015 by the Movement Disorders Society.4 The main diagnostic criteria for PD, based on motor symptoms, are bradykinesia plus resting tremor or rigidity.4
A recent study analysed PD mortality trends worldwide using the World Health Organization mortality database, assessing data from a 25-year period, specifically from 1994 to 2019.5 The worldwide standardised mortality rate was 5.67 per 100 000 inhabitants in 2019, while the Spanish rate reached 3.9 per 100 000 inhabitants.5,6 In recent decades, without explained reasons, a striking rise in mortality rates worldwide has been recorded, as well as an exponential increase in incidence and prevalence.1,5
The study of PD mortality trends is important for patient information, disease management, and design of future clinical trials.7 Regarding the epidemiological context of mortality, it is essential to examine the effects of age, period, and cohort effects (APC) to assess how temporal trends of mortality of PD could be affected.8 Although the study by Lampropoulos et al.5 analysed the worldwide mortality rate, no previous literature on mortality trends has focused on the Spanish population with PD. Also, to the best of our knowledge no previous studies on PD had analysed the effects on mortality of age, period, and birth cohorts. Therefore, this study aims to assess the standardised mortality trends and age-period-cohort effects adjusted by age and sex for PD mortality in Spain over a 40-year period.
Materials and methodsData source and data extractionIn this observational retrospective study, we assessed data on mortality caused by PD in the Spanish population from the period between 1981 and 2020. We selected this specific period due to the reliability of the data available in the institutional database. We consulted and collected all mortality data from the Spanish National Statistics Institute (http://www.ine.es). To ensure the veracity and reliability of the data, we based our analysis on death certificates coded with the International Classification of the Diseases (ICD). We only included cases in which the cause of mortality was PD. In ICD-8 and ICD-9 PD was classified as paralysis agitans under codes 342.0 and 332.0, respectively. After that, the PD denomination was recognised in the ICD-10 with the code G20. The code G21 was not considered because it was related to secondary parkinsonism. In our analysis, we also excluded the diagnosis of dementia with parkinsonism (ICD-10 G31.83), to focus only on primary PD.
Although this study did not report global mortality data, to carry out good practice, we followed the Guidelines for Accurate and Transparent Health Estimates Reporting standards statements (GATHER).9 The STROBE guideline for observational studies were also considered. No institutional or ethical approval was required for this study.
Statistical analysisStandardised mortality ratesTo manage and analyse mortality data, we used EPIDAT (v.4.2; https://www.sergas.es/Saude-publica/EPIDAT), Microsoft Excel (Microsoft Corp.; Redmond, WA, USA), and SPSS Statistics (v.25; IBM SPSS,;Armonk, NY, USA) statistical software. This study calculated the age-specific mortality rate in 5-year age groups, as well as the annual age-standardised mortality rate (ASMR) stratified by sex and age (35-54, 55-74 and ≥ 75 years old). We estimated the sex ratio for all ages as the proportion of male relative to female mortality. In this study, the rates were displayed as 100 000 inhabitants. All analyses were carried out using the direct method and adjusted for the European Standard Population of 2013.10
We identified significant trend changes in mortality stratified by sex and age using a joinpoint analysis. To conduct this analysis, the Joinpoint Regression program, developed by the Surveillance Research Program of the US National Cancer Institute, was used (V4.8.0.1; https://surveillance.cancer.gov/joinpoint). The statistical significance for a mortality trend was established as P < .05. The maximum number of joinpoints allowed in the analysis was 5, while the number of periods was one more than the number of registered joinpoints. The joinpoint was equal to zero when no joinpoint was registered. Additionally, the annual average percent change (AAPC) was computed by sex and age group using the mentioned method.
Age-period-cohort modelTo examine the effect of age, period, and birth cohort on mortality rate fluctuation, an APC analysis was conducted. The age effect refers to the change in mortality caused by the ageing process detected by varying rates over age groups. Period effects refer to an external factor that affects all ages in a concrete calendar period. The birth cohort effect refers to changes derived from factors, experiences, or exposures that involve a group of subjects with a common birth year.11 The APC model was performed using the penalty function proposed by Decarli and La Vecchia.12 To run the analysis and generate the graphic representation of the results, we used the R studio software (v.4.1.2). The authors13 kindly provided the generalised linear interactive modelling (GLIM) macros to perform the analyses using the APC package (v.1.3., 3; https://cloud.r-project.org/web/packages/APCtools/vignettes/main_functionality.html). Assuming a Poisson distribution, all joinpoints would represent a significant change in mortality trends. Data were divided into 5-year periods and 5-year age groups to make these estimates. The goodness of fit of the possible APC models was also compared, showing a better fit with a lower Akaike information criterion (AIC) and a narrower deviation.
Potential years of life lostIn order to assess the burden of PD mortality and quantify premature mortality, we carried out a potential years of life lost (PYLL) analysis. We calculated the crude and standardised PYLL for each study year and the sex group.
ResultsA total of 88 034 deaths due to PD were identified between 1981 and 2020, with a mean age of mortality of 81.70 and a standard deviation (SD) of 7.74. Of the total number, 43 108 deaths were women with a mean age of 82.75 (7.71) and 44 926 men with a mean age of 80.70 (7.64).
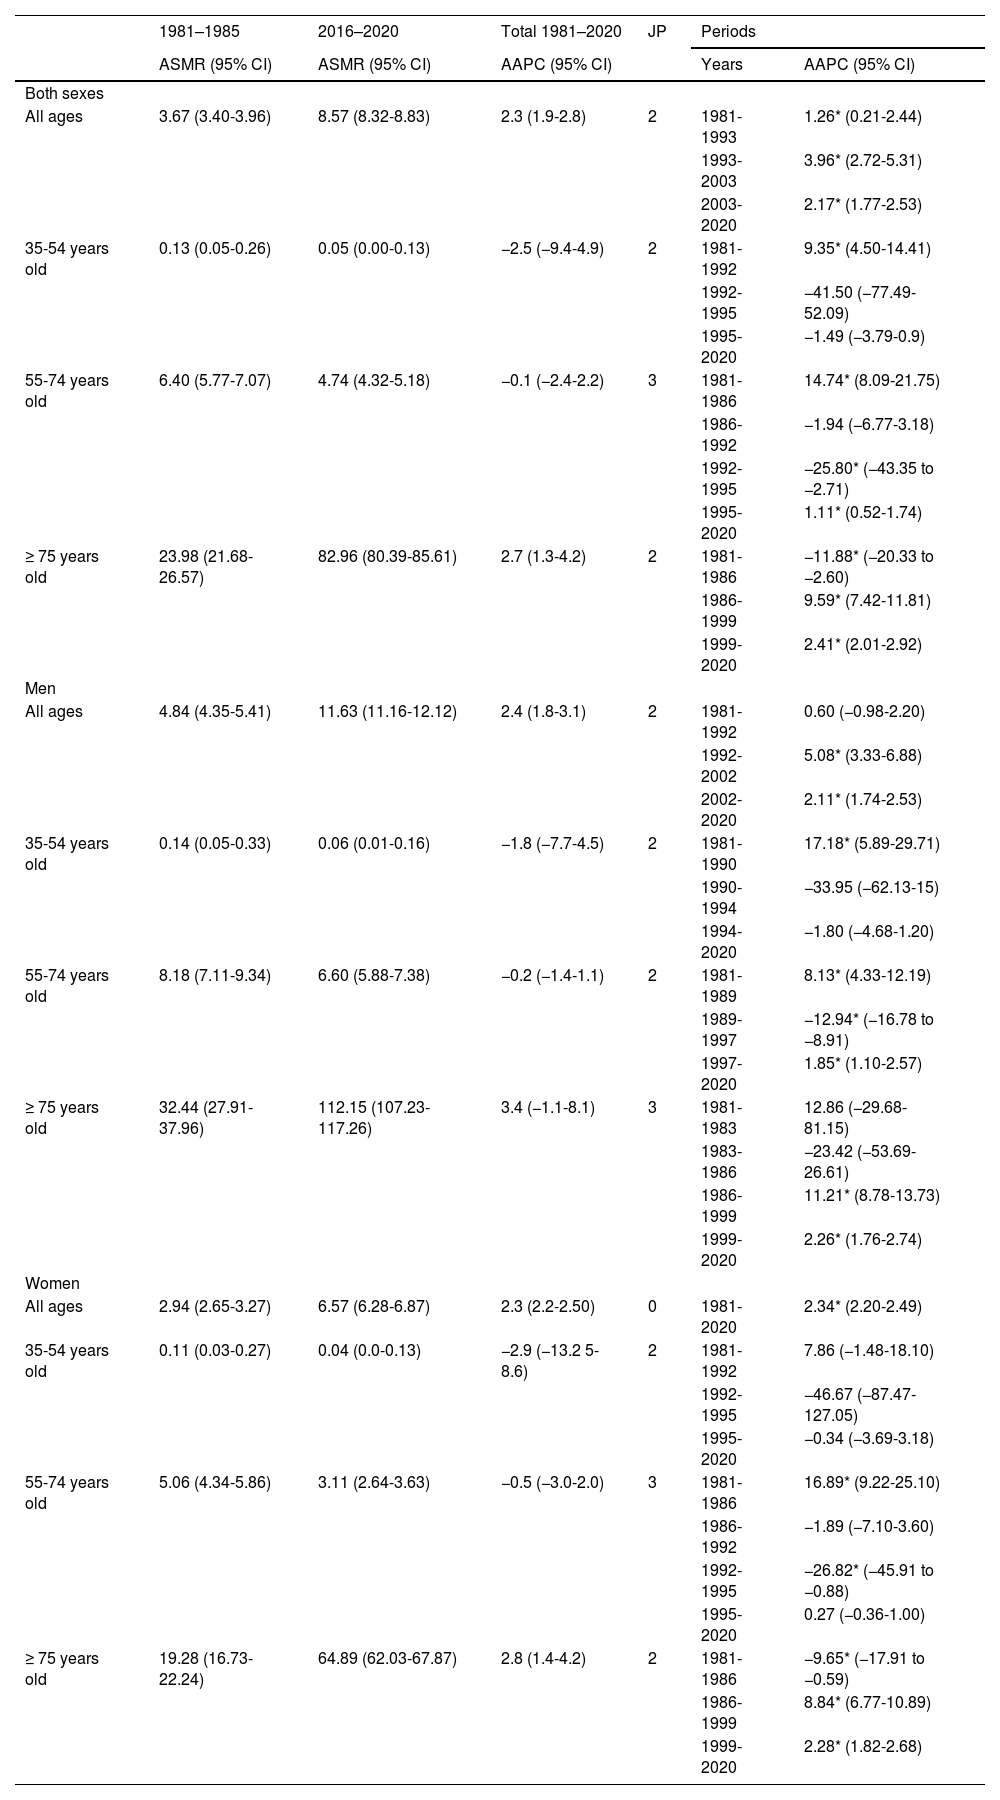
Standardised mortality rateThe total ASMR in PD between 1981 and 1985 was 3.67 per 100 000 inhabitants, rising to 8.57 per 100 000 in the period between 2016 and 2020. For males, the ASMR reached 8.84 per 100 000 between 1981 and 1985, changing to 11.63 per 100 000 inhabitants for 2016 to 2020. Female ASMR increased from 2.94 to 6.57 per 100 000 inhabitants from 1981-1985 to 2016-2020 (Table 1). The ASMR for each year of study can be found in Table A1 of the Supplementary Material.
Age-standardised mortality rates of Parkinson’s disease in Spain per 100 000 inhabitants and trend analysis of annual average percentage change according to age and sex.
| 1981–1985 | 2016–2020 | Total 1981–2020 | JP | Periods | ||
|---|---|---|---|---|---|---|
| ASMR (95% CI) | ASMR (95% CI) | AAPC (95% CI) | Years | AAPC (95% CI) | ||
| Both sexes | ||||||
| All ages | 3.67 (3.40-3.96) | 8.57 (8.32-8.83) | 2.3 (1.9-2.8) | 2 | 1981-1993 | 1.26* (0.21-2.44) |
| 1993-2003 | 3.96* (2.72-5.31) | |||||
| 2003-2020 | 2.17* (1.77-2.53) | |||||
| 35-54 years old | 0.13 (0.05-0.26) | 0.05 (0.00-0.13) | −2.5 (−9.4-4.9) | 2 | 1981-1992 | 9.35* (4.50-14.41) |
| 1992-1995 | −41.50 (−77.49-52.09) | |||||
| 1995-2020 | −1.49 (−3.79-0.9) | |||||
| 55-74 years old | 6.40 (5.77-7.07) | 4.74 (4.32-5.18) | −0.1 (−2.4-2.2) | 3 | 1981-1986 | 14.74* (8.09-21.75) |
| 1986-1992 | −1.94 (−6.77-3.18) | |||||
| 1992-1995 | −25.80* (−43.35 to −2.71) | |||||
| 1995-2020 | 1.11* (0.52-1.74) | |||||
| ≥ 75 years old | 23.98 (21.68-26.57) | 82.96 (80.39-85.61) | 2.7 (1.3-4.2) | 2 | 1981-1986 | −11.88* (−20.33 to −2.60) |
| 1986-1999 | 9.59* (7.42-11.81) | |||||
| 1999-2020 | 2.41* (2.01-2.92) | |||||
| Men | ||||||
| All ages | 4.84 (4.35-5.41) | 11.63 (11.16-12.12) | 2.4 (1.8-3.1) | 2 | 1981-1992 | 0.60 (−0.98-2.20) |
| 1992-2002 | 5.08* (3.33-6.88) | |||||
| 2002-2020 | 2.11* (1.74-2.53) | |||||
| 35-54 years old | 0.14 (0.05-0.33) | 0.06 (0.01-0.16) | −1.8 (−7.7-4.5) | 2 | 1981-1990 | 17.18* (5.89-29.71) |
| 1990-1994 | −33.95 (−62.13-15) | |||||
| 1994-2020 | −1.80 (−4.68-1.20) | |||||
| 55-74 years old | 8.18 (7.11-9.34) | 6.60 (5.88-7.38) | −0.2 (−1.4-1.1) | 2 | 1981-1989 | 8.13* (4.33-12.19) |
| 1989-1997 | −12.94* (−16.78 to −8.91) | |||||
| 1997-2020 | 1.85* (1.10-2.57) | |||||
| ≥ 75 years old | 32.44 (27.91-37.96) | 112.15 (107.23-117.26) | 3.4 (−1.1-8.1) | 3 | 1981-1983 | 12.86 (−29.68-81.15) |
| 1983-1986 | −23.42 (−53.69-26.61) | |||||
| 1986-1999 | 11.21* (8.78-13.73) | |||||
| 1999-2020 | 2.26* (1.76-2.74) | |||||
| Women | ||||||
| All ages | 2.94 (2.65-3.27) | 6.57 (6.28-6.87) | 2.3 (2.2-2.50) | 0 | 1981-2020 | 2.34* (2.20-2.49) |
| 35-54 years old | 0.11 (0.03-0.27) | 0.04 (0.0-0.13) | −2.9 (−13.2 5-8.6) | 2 | 1981-1992 | 7.86 (−1.48-18.10) |
| 1992-1995 | −46.67 (−87.47-127.05) | |||||
| 1995-2020 | −0.34 (−3.69-3.18) | |||||
| 55-74 years old | 5.06 (4.34-5.86) | 3.11 (2.64-3.63) | −0.5 (−3.0-2.0) | 3 | 1981-1986 | 16.89* (9.22-25.10) |
| 1986-1992 | −1.89 (−7.10-3.60) | |||||
| 1992-1995 | −26.82* (−45.91 to −0.88) | |||||
| 1995-2020 | 0.27 (−0.36-1.00) | |||||
| ≥ 75 years old | 19.28 (16.73-22.24) | 64.89 (62.03-67.87) | 2.8 (1.4-4.2) | 2 | 1981-1986 | −9.65* (−17.91 to −0.59) |
| 1986-1999 | 8.84* (6.77-10.89) | |||||
| 1999-2020 | 2.28* (1.82-2.68) | |||||
95% CI: 95% confidence interval; AAPC average annual percent change; ASMR: age standardised mortality rate; JP: joinpoint.
*P < .05.
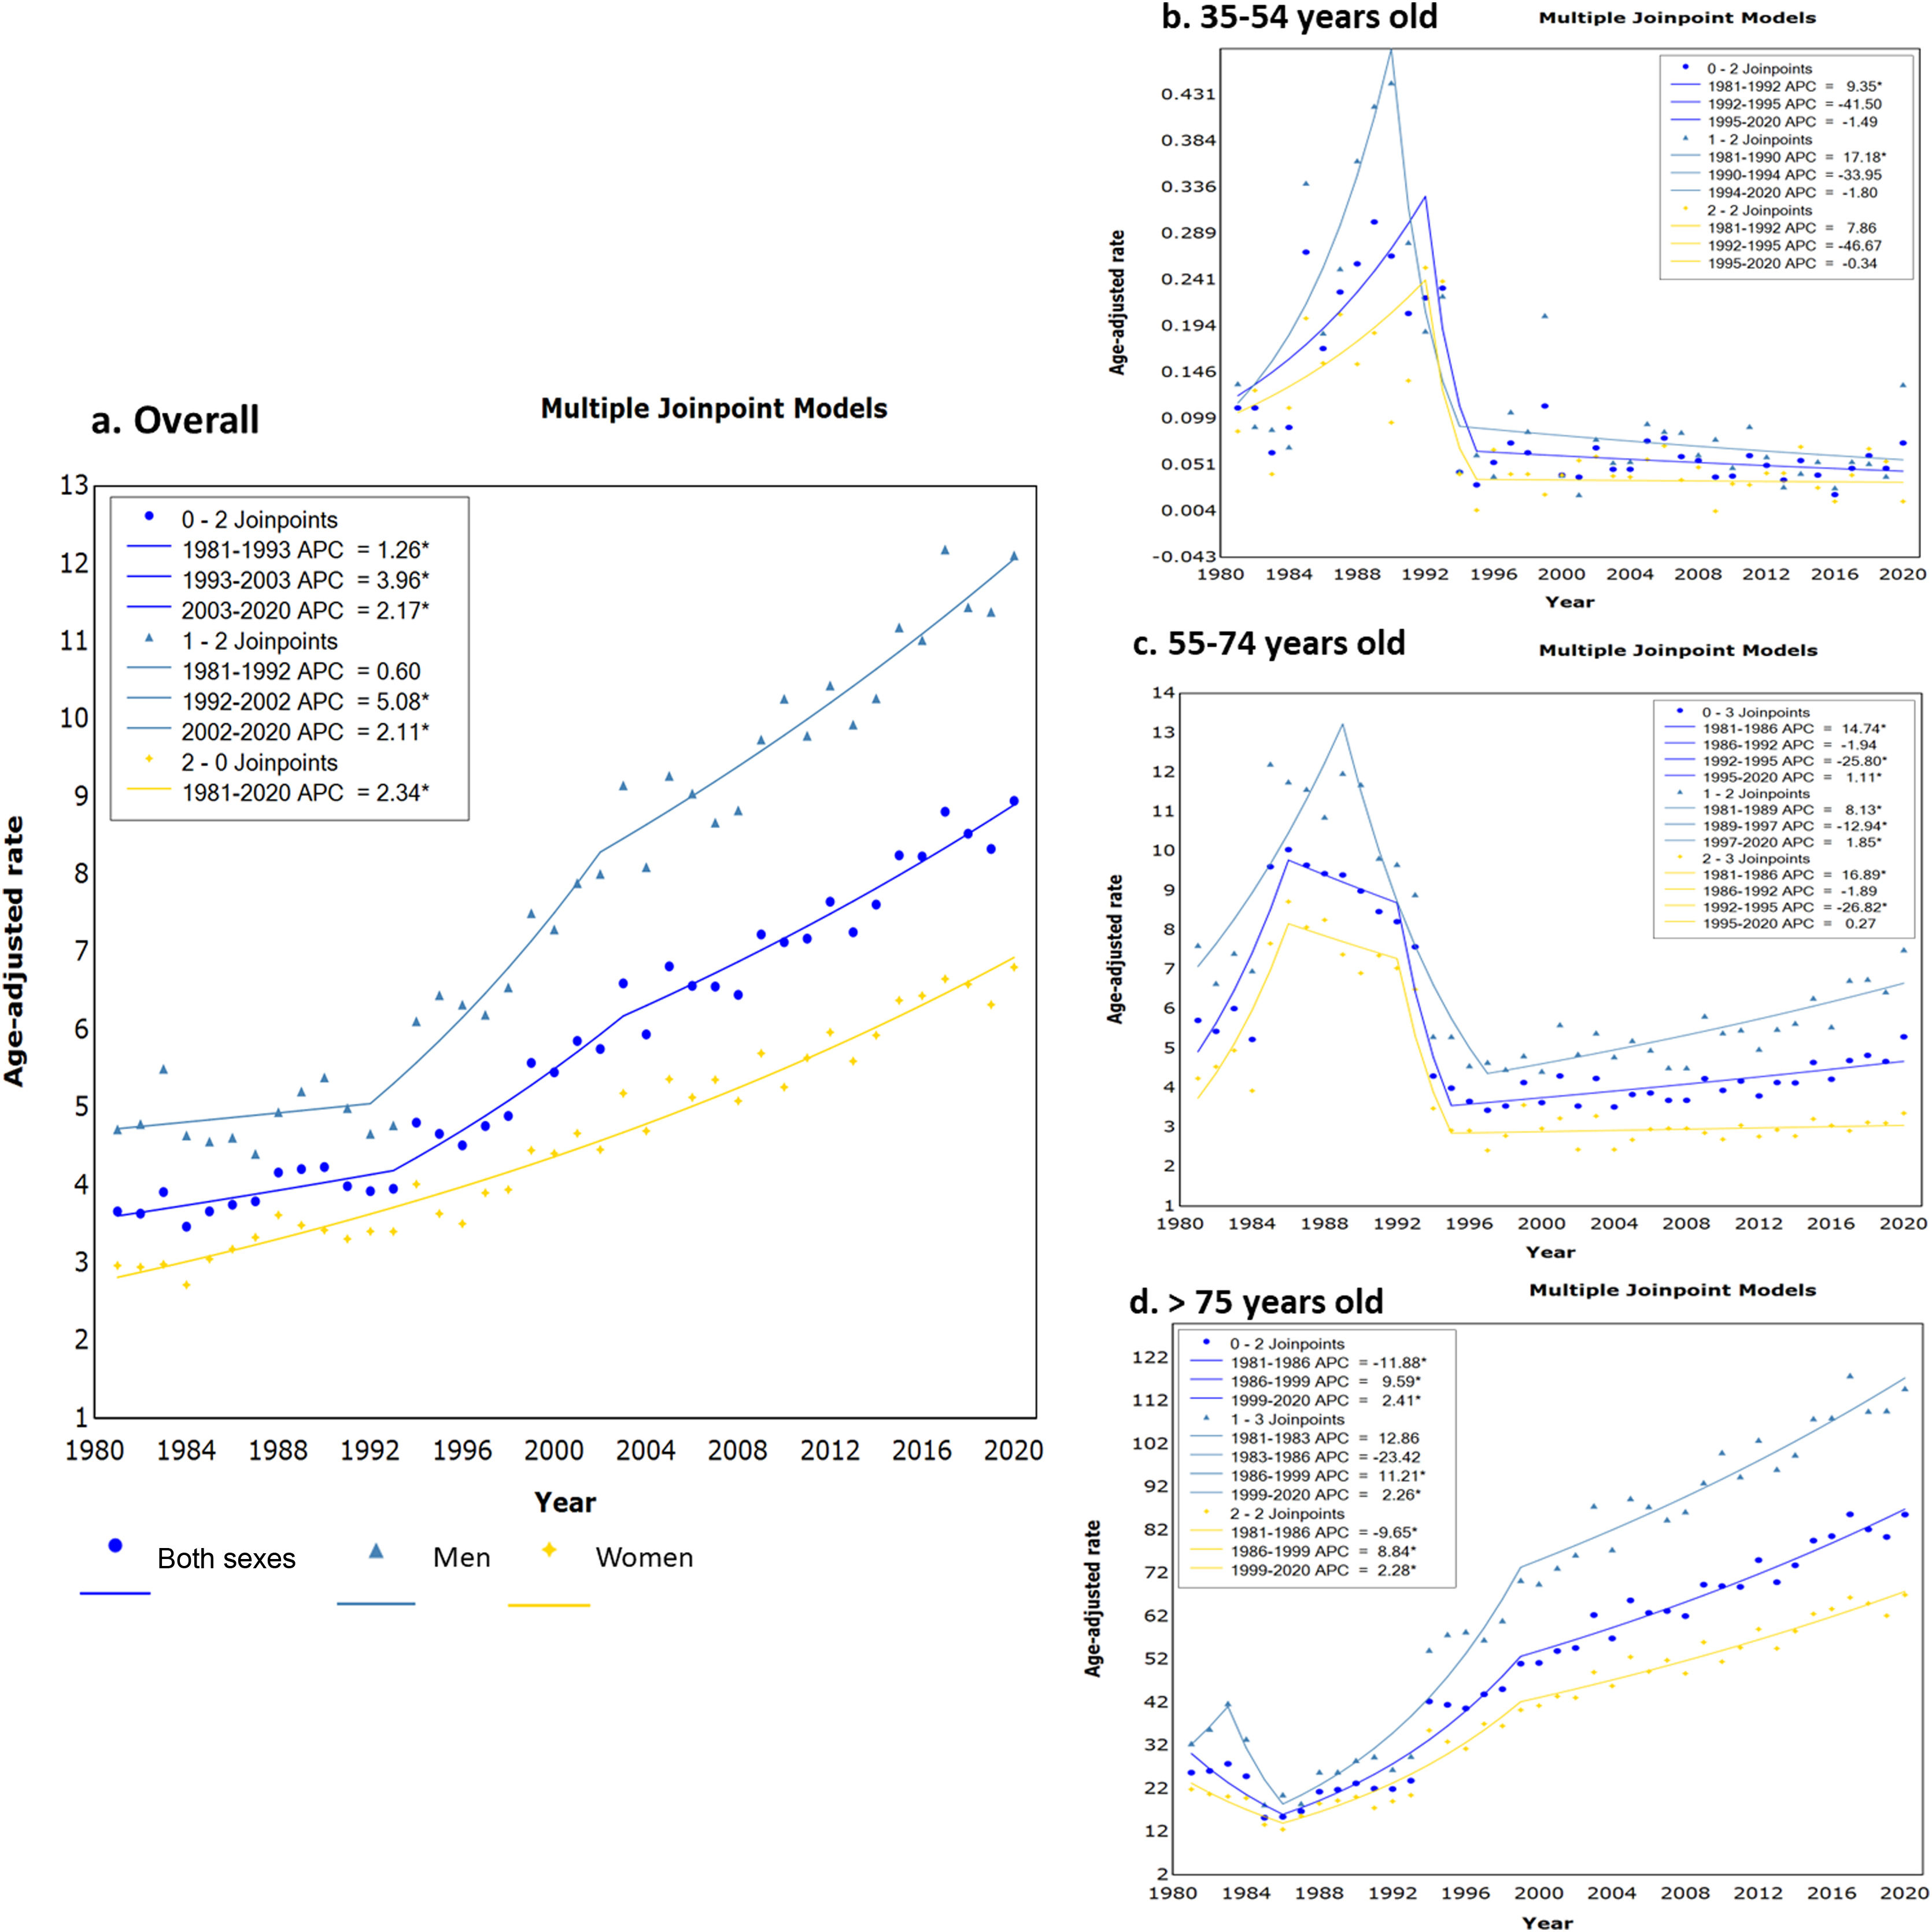
The results of ASMR by age group are shown in Table 1 and mortality trends by age group are presented in Fig. 1. The overall population and the male curve underwent 2 changes in the mortality trend over 3 periods (Fig. 1a). All mortality trends in PD were significant, but it is necessary to highlight the growth of death cases during the last period of 2003 and 2020 with a global AAPC of 2.17%; this was more noticeable in men, as reflected in Fig. 1a. In the case of females, no mortality trend was detected (without joinpoints), but a steady ascent of ASMR was observed. A similar curve compared to the one of the 2 sexes was obtained in people older than 75 years of age (Fig. 1d). The main difference was that in the first period, from 1980 to 1986, the ASMR significantly dropped (AAPC = −11.88%) and later continued to rise until 2020 in the 3 curves. For the age group 35 to 54 and 54 to 74 years in both sexes, a notable mortality trend registered an increase in the AAPC recorded during the periods 1981 to 1992 for the younger group (AAPC = 9.35%), and in 1981 to 1986 in the group between 55 and 74 years (AAPC = 14.74%) (Fig. 1b and c). The latter group displayed a rise in mortality for both sexes in the last periods of the 3 curves. In contrast to all previous age groups between 35 and 54 years old, underwent a steady descent in mortality since the year 1994 in men and 1995 for the overall and women curves (Fig. 1b). However, we observed in 2020 an increase of mortality in men with PD between 35 and 54 years of age, this fact being confirmed by the results of the sex ratio.
 all ages, b) 35 to 54 years old, c) 55 to 75 years old, and d) ≥ 75 years old. APC: Average percent change; *Indicates a significant mortality trend change; spot mark: overall data; triangle mark: men data; star mark: women data. The number that appears before the joinpoint results are the number of periods.")
Joinpoint regression analysis of mortality rates of Parkinson’s disease in Spain between 1981 and 2020 for a) all ages, b) 35 to 54 years old, c) 55 to 75 years old, and d) ≥ 75 years old. APC: Average percent change; *Indicates a significant mortality trend change; spot mark: overall data; triangle mark: men data; star mark: women data. The number that appears before the joinpoint results are the number of periods.
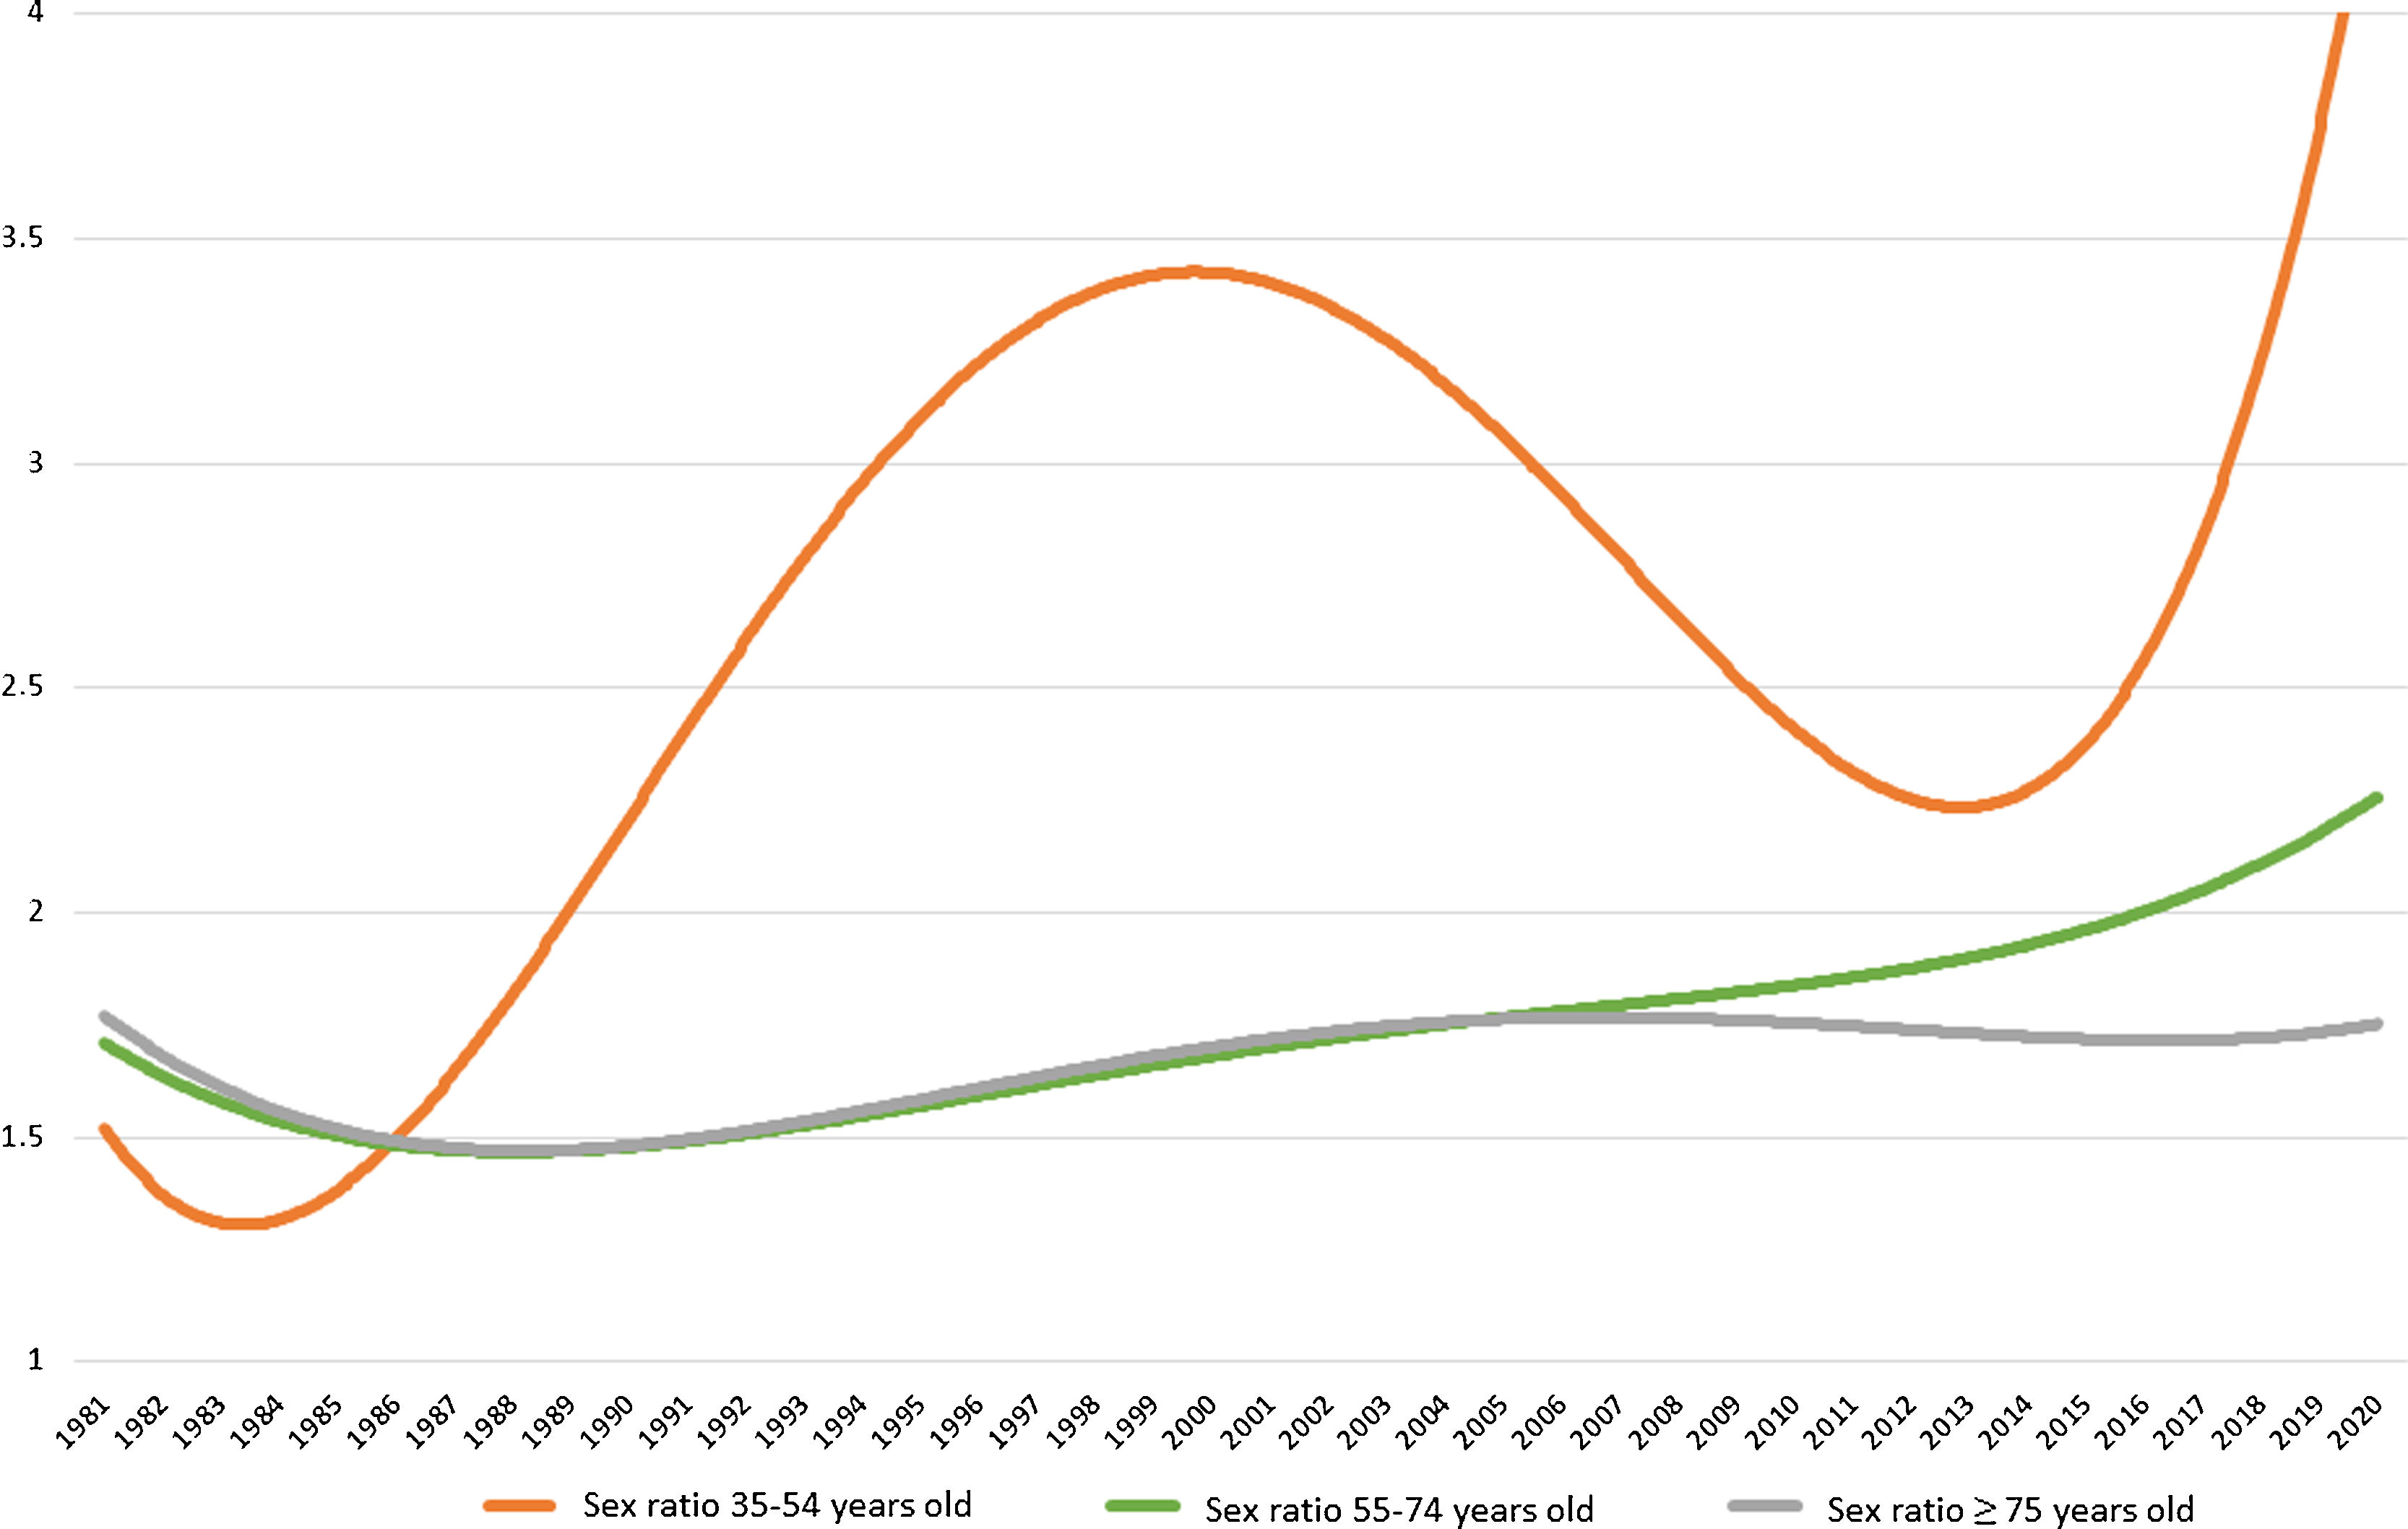
In the group older than 75 years of age, the sex ratio (male/female) slightly ascend throughout the study period. The sex ratio for group between 55 and 74 years of age ascent more markedly from 2007. The younger group (35-54 years old) doubled the sex ratio from the inception of the study period until 2000 when started decreasing until 2014. From this year, the male/female ratio experienced a drastic increase in 2020, achieving a sex ratio of 9.94, compared to the previous ratio of 0.74 obtained in 2019 (Fig. 2).
Age-period-cohort model over the years 1981 to 2020 in Spain, sorted by age group. Note: Y-axis refers to sex ratio (men/women); X-axis refers to the studied years.")
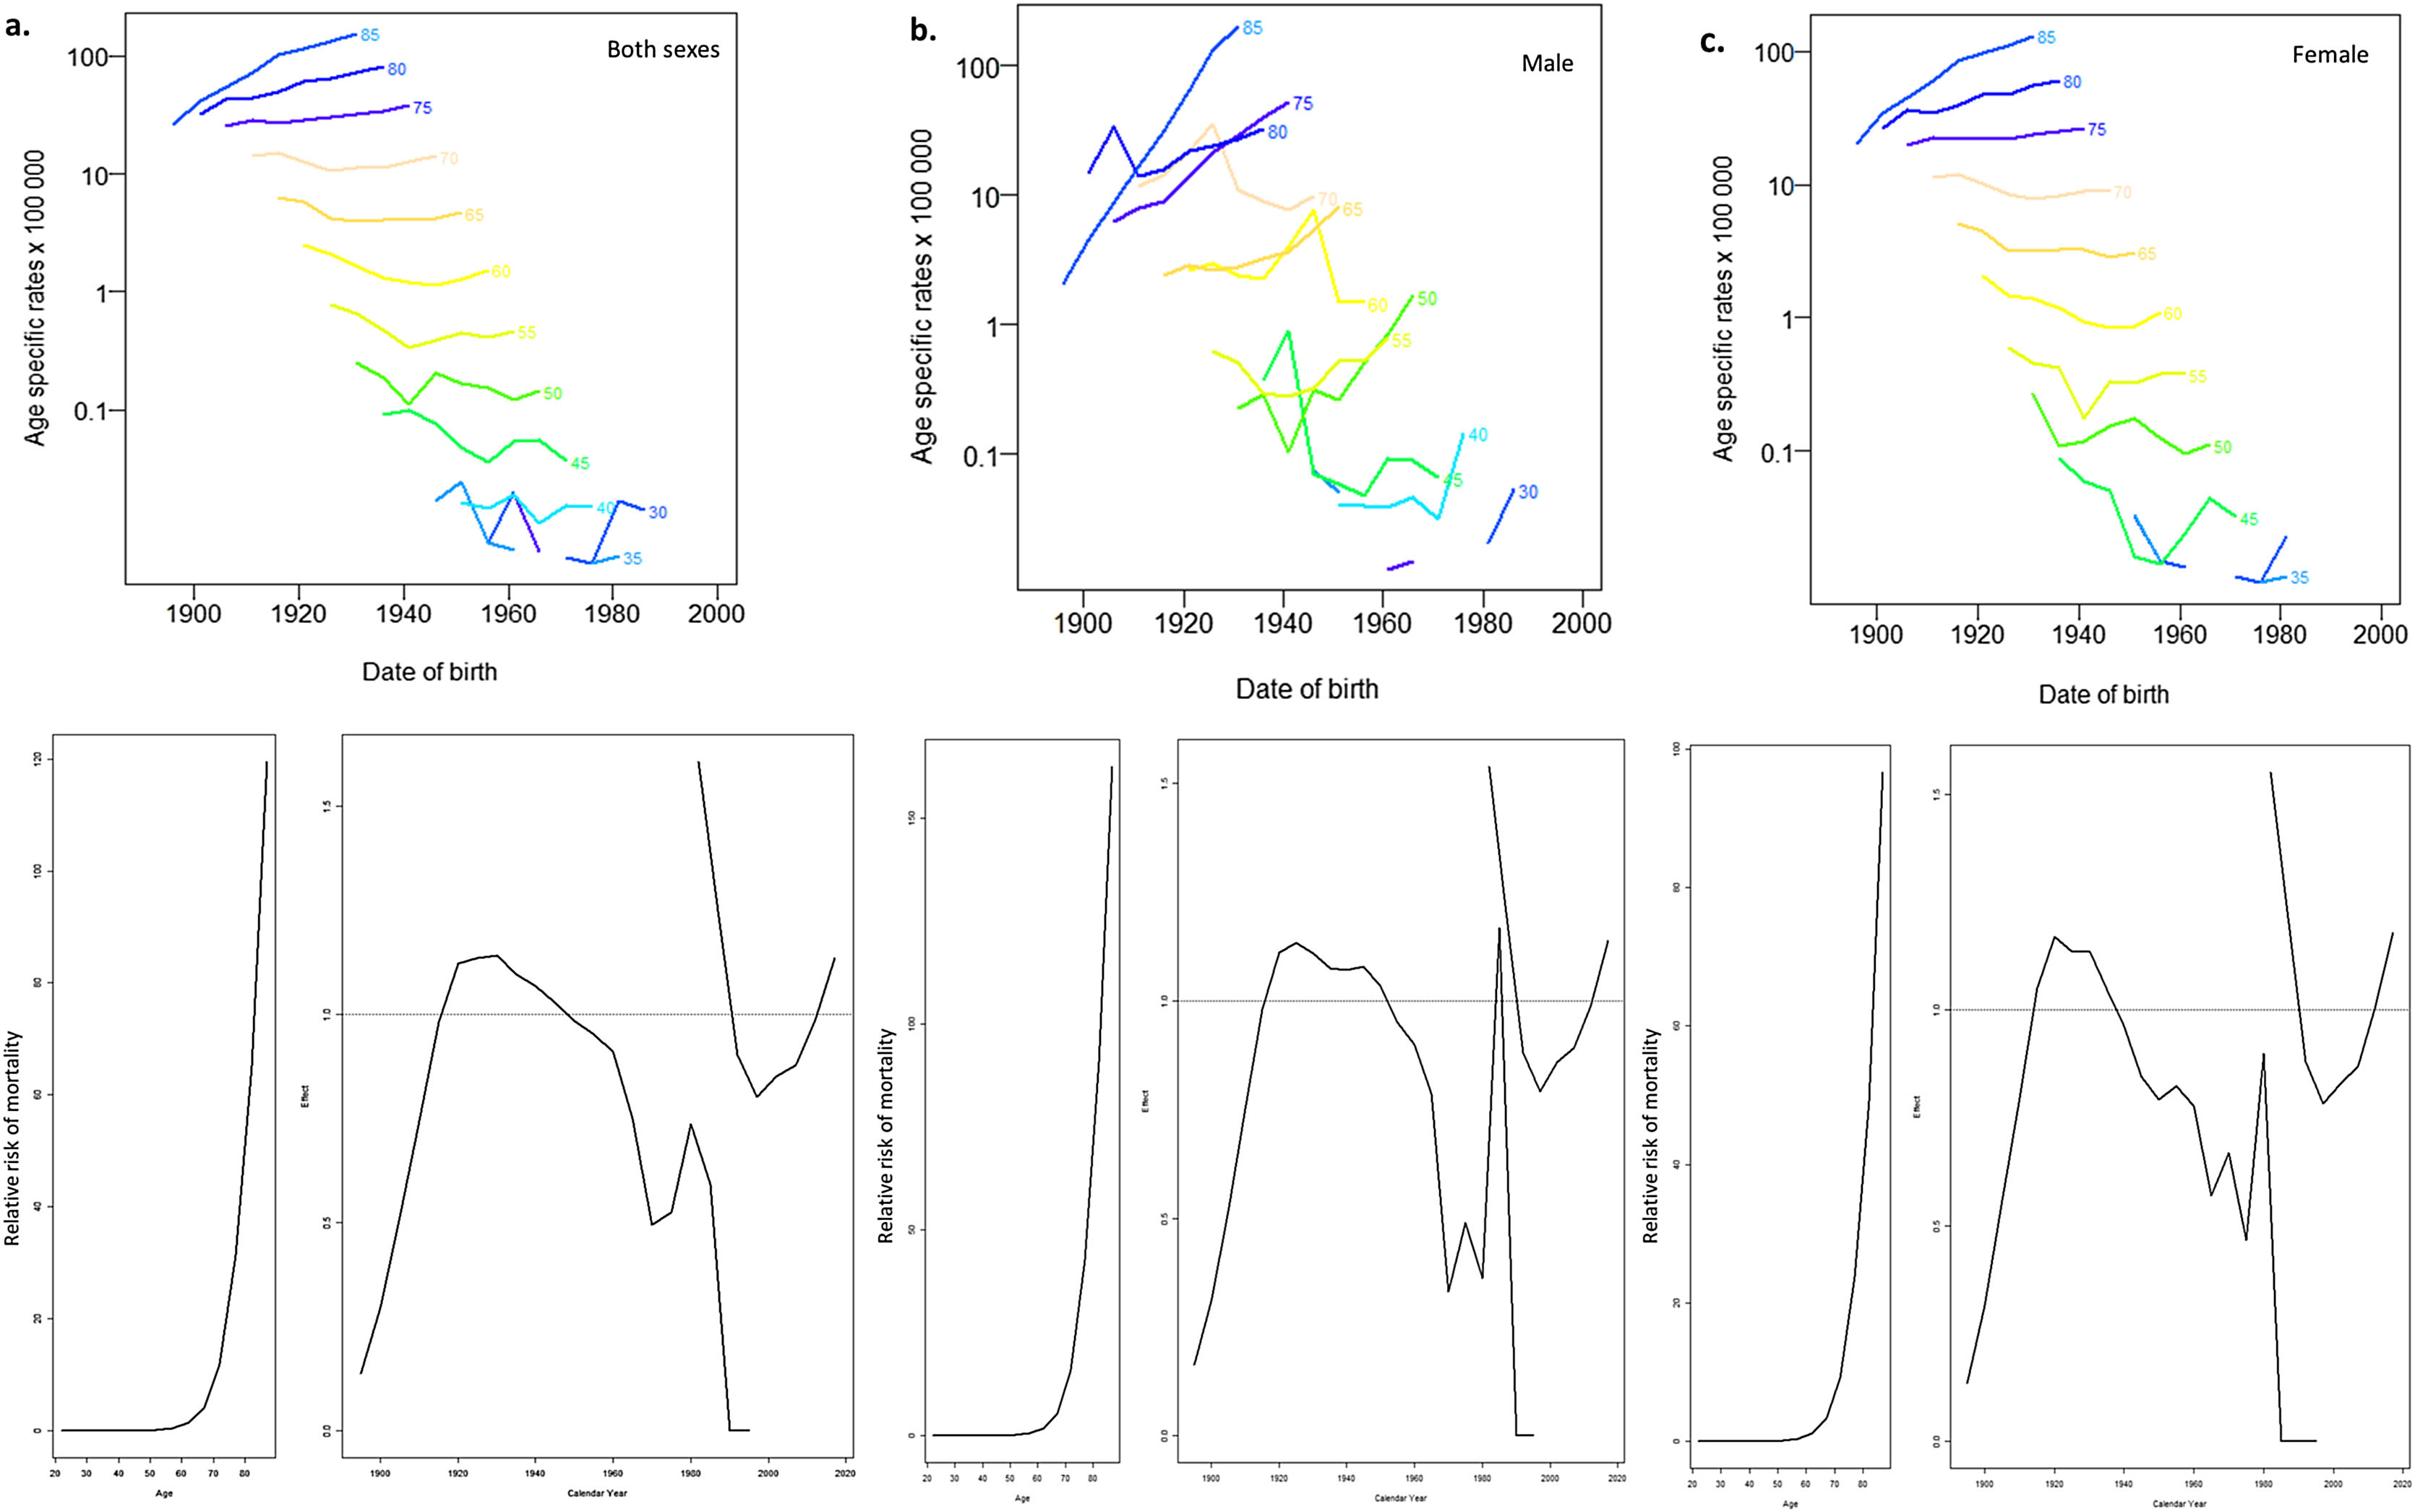
Regarding the age effect, a marked increase in mortality is observed for both sexes after 70 years of age. It is remarkable that the period effect observed in PD since the beginning of the 21st century, when the mortality rate started to rise, has been remarkable until the end of the study. This period effect was more notable in men. Related to birth cohort effect, an increase in mortality was recorded in the cohort born before 1920; from this moment on, a drop was observed. This fall ended with an increase in the relative risk of death of PD, which is more notable in men in birth cohorts since 1960. Fig. 3 illustrates the results of the APC analysis. The data for the goodness of fit of the different APC models are reported in Table A1 in the Supplementary Material. The APC effect was the model that better fit for both sexes, male and female showing the lower AIC and the narrower deviance.
 both sexes, b) males and c) females. Note: The upper graphs are related to age effect and show the mortality rates for each 5-year age. Age-specific rates are given per 100 000 inhabitants. The lower graph shows the variation of the relative risk of mortality for the different age (left-pictures in the second row) cohorts (first part of right-picture in the second row) and period effects (second part of right-picture in the second row).")
Analysis of the age-period-cohort effect of Parkinson’s disease in Spain for a) both sexes, b) males and c) females. Note: The upper graphs are related to age effect and show the mortality rates for each 5-year age. Age-specific rates are given per 100 000 inhabitants. The lower graph shows the variation of the relative risk of mortality for the different age (left-pictures in the second row) cohorts (first part of right-picture in the second row) and period effects (second part of right-picture in the second row).
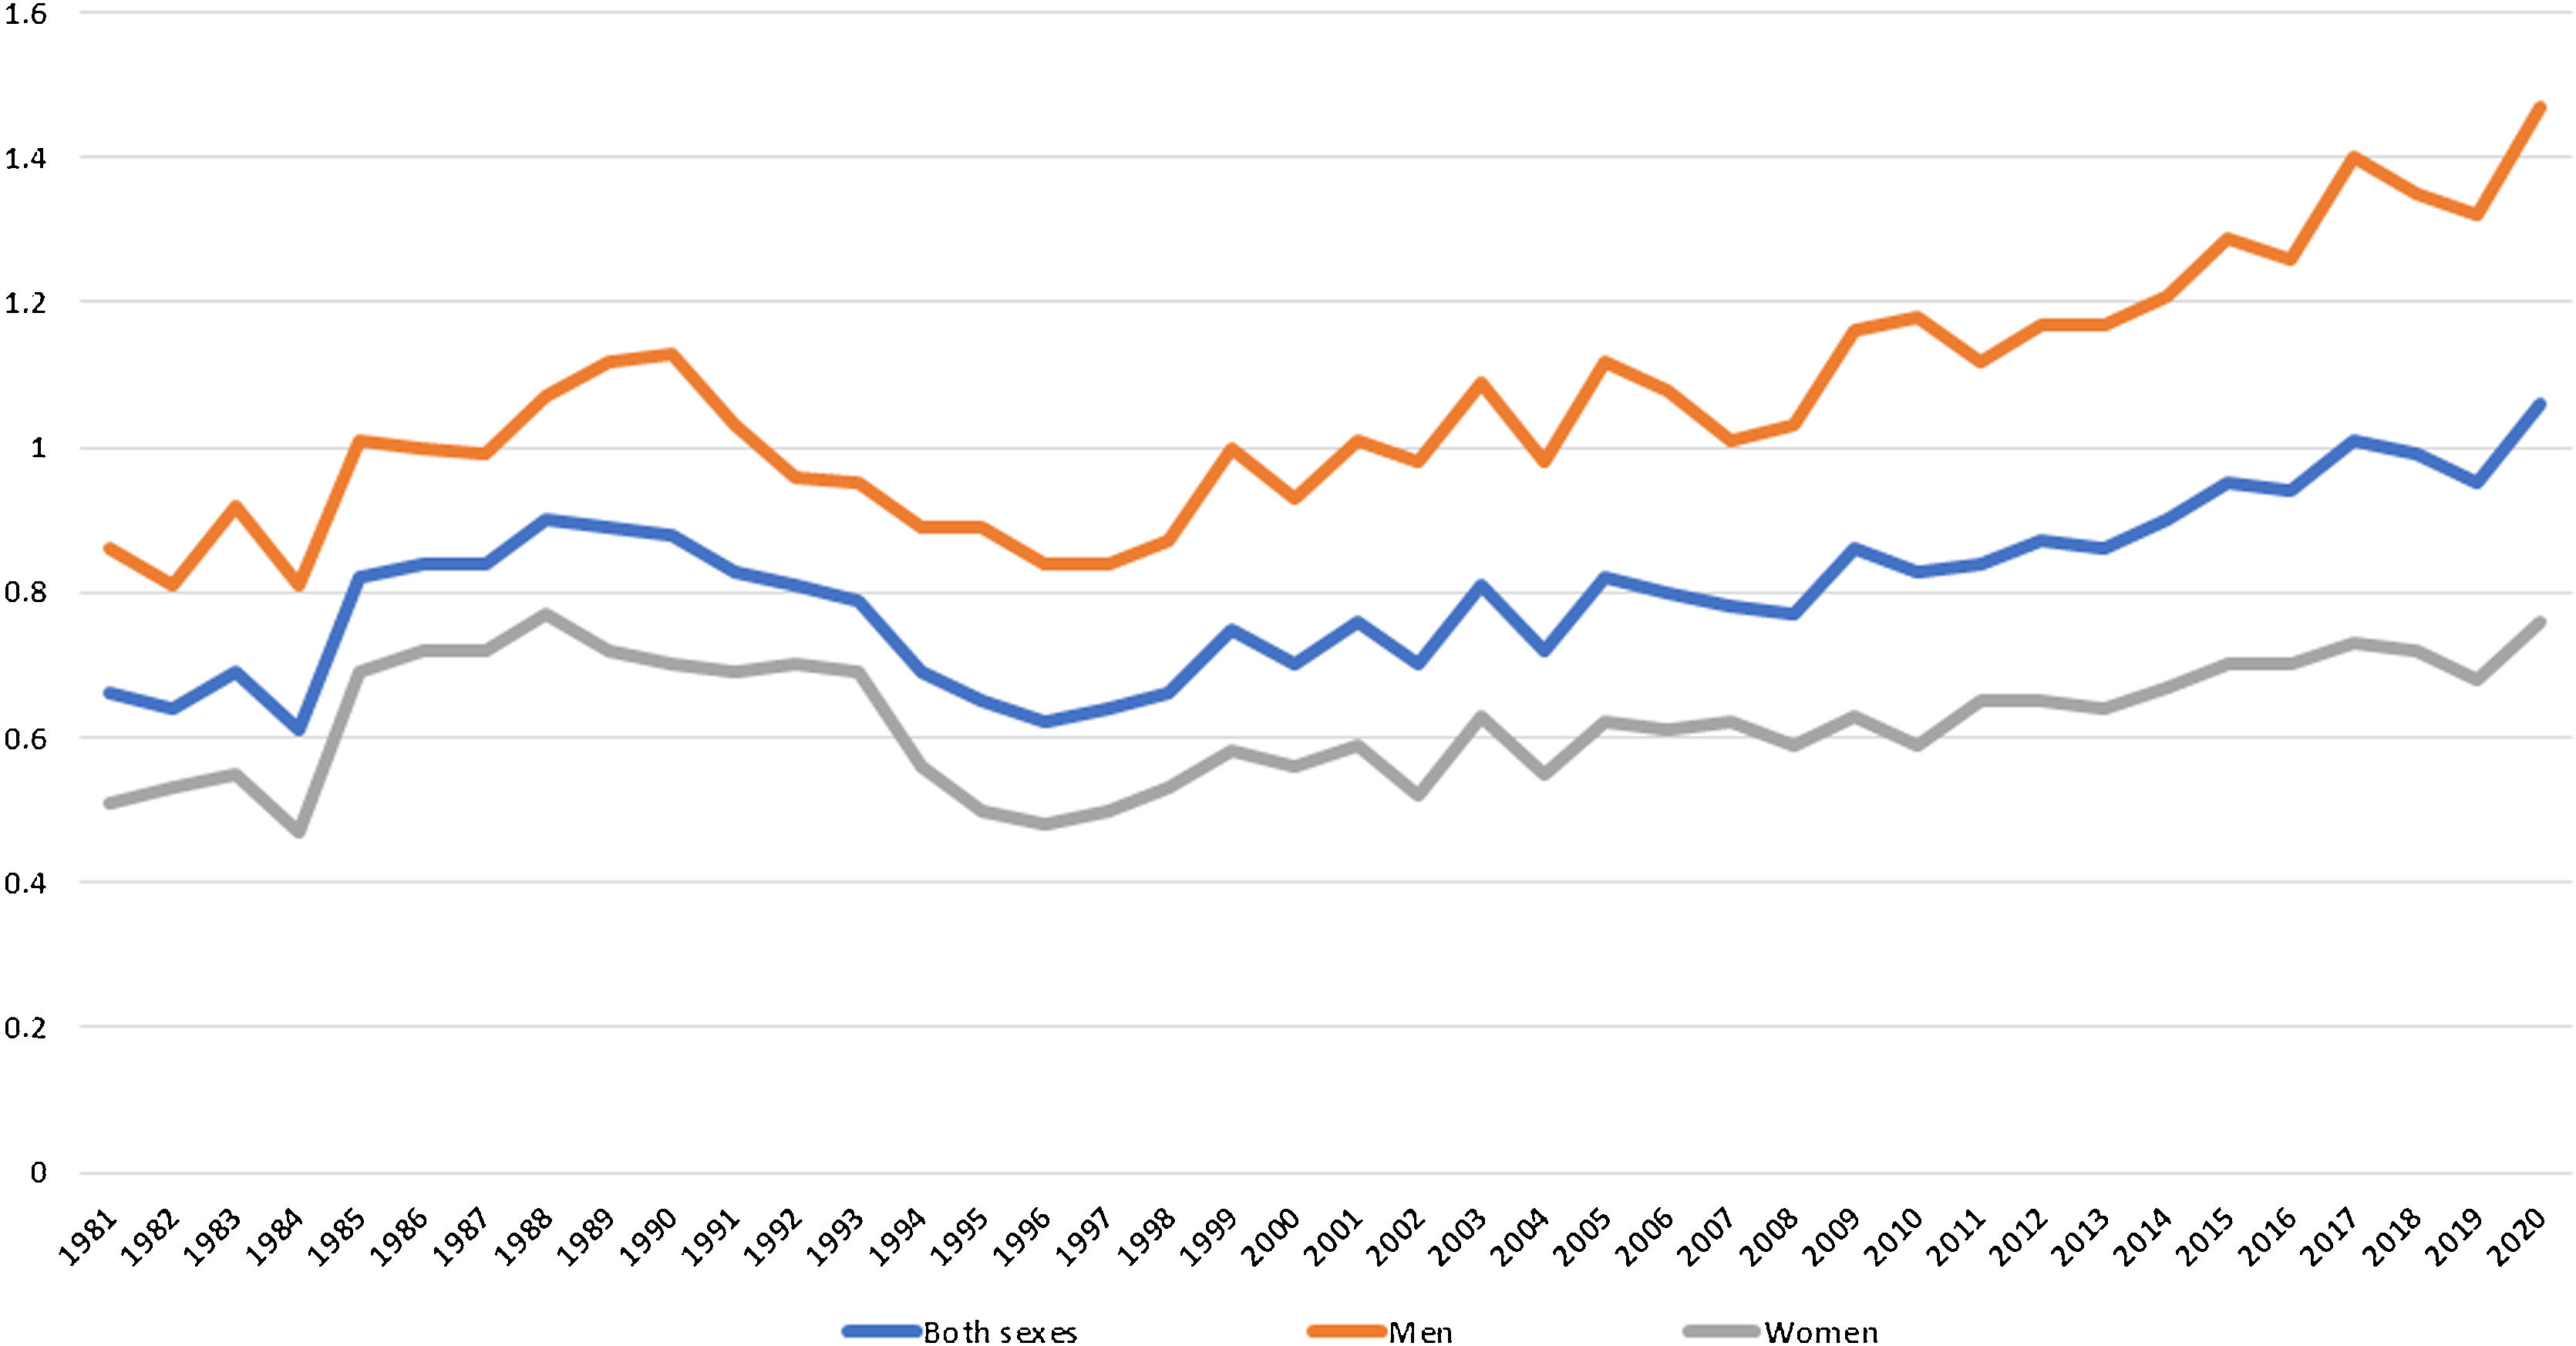
A total of 1 183 932 potential years of life were lost in the 40 years of study. The 3 curves illustrated in Fig. 4 showed a rise in the PYLL rate as the years go by, resulting from data for both sexes, an adjusted rate of 0.66 in 1981 and 1.06 in 2020. Men had the highest PYLL rate during the entire period, changing from an adjusted PYLL rate of 0.86 in 1981 to 1.47 in 2020. All data and rates of PYLL can be found in Table A2 of the Supplementary Material.
Discussion
This study presents the widest study period (40 years) assessed in the mortality of PD in Spain. The analysis showed a general trend of increased mortality throughout the period for both sexes and the age group 55 to 74 years and older than 75 years. Only the group between 35 and 54 years of age showed a steady decline in PD mortality since the 1990s, increasing again only in the curve of both sexes and in the male curve in 2020. Mortality rates in men were higher than in women regardless of age group.
Our results are in line with recent literature that reported a considerable increase in PD mortality rates worldwide5 or in specific territories like the United Stated of America,14 the United Kingdom,15 and Italy.16
No specific reasons could be directly attributed to this mortality increase, highlighting the last 2 decades.5,17 However, the rise in PD mortality in the 21st century could be related to several factors such as the increased incidence and prevalence registered on the disease,18 even in Spain.19 This fact could be translated into an exponential increment of mortality rates in both sexes as we recorded in our analysis. Furthermore, environmental factors such as pollution, herbicides, or health behaviours such as smoking appear to be related to a higher incidence and mortality in PD.20,21 Other factors that could model epidemiology in PD are the increase in life expectancy. An older population is more likely to be diagnosed with PD, as well as a greater possibility of presenting comorbidities.22 Our analysis showed that death cases were strikingly higher in the group over 75 years old than in younger groups, as occurred in previous researches.5,14,15 Another factor is increased awareness of the disease among healthcare professionals and more accurate registries based on death certificates coded by the ICD.23 In addition, diagnostic criteria tended to be more precise, leading to and early detection of the disease and diagnose,24 so all this may influence PD mortality data.
Our results did not only show differences in mortality rates with respect to age, but also sex variability was found. According to the previous literature on PD, mortality was higher in males than females25; only the study focused in Estonian population with PD reported similar rates for both sexes.26 Within our results of the sex ratio (male/female), we have to underline the increase in male mortality compared to female mortality in the group between 35 and 54 years of age. This pointed to premature mortality in men compared to women with PD that occurred between 1986 and 2000, which later increased again from 2014 until 2020. In our results, the number of men versus women deceased was much higher in 2020 concurring with the coronavirus disease 2019 pandemic (COVID-19). Recent studies confirmed that COVID-19 augmented the death cases in people with PD compared to the general population with a higher number of deaths in males than females.27 A Spanish cross-sectional survey of 568 patients with PD during the COVID-19 pandemic reported a worsening of disease symptoms in 65.7% of the cases.28 A worsening of motor and nonmotor symptoms in PD and comorbidities (primarily pneumonia) were described as mortality predictors by Bugalho et al.29 During the pandemic, young people were more affected by COVID-19 than older people with PD, and the main comorbidity was pneumonia.30 Comorbidities seem to affect in early stages of PD,31 that could be related to premature mortality. Taking into account the information mentioned and the results obtained, we stated the need for future studies that assessed mortality trends during pandemic years not only in Spain, but also in other countries and worldwide. The study of Fedeli et al.27 stated the need for further studies focused on PD mortality during the COVID-19 pandemic and claimed a correct practice on death certification for not underestimating or biasing future mortality trends studies. We also considered it of interest to perform an APC analysis to know if there will be a period effect on PD mortality, due to COVID-19 being exposed to the entire PD population for a concrete period of time.
Our APC analysis showed age and period effects on mortality during the studied period, but no effect on the birth cohort was found. The age effect only shows the natural course of the disease, presenting a higher mortality at an older age. The period effects could be related to the use of levodopa treatment. Although pharmacological therapy for PD has not been proven to promote changes in mortality trends, some authors reported that levodopa delayed death in people diagnosed with PD; but real effects of levodopa on mortality trends remains controversial.32 Around 1980 first side effects of long-term administration which involve a worsening on disease symptoms.33 After our analysis of APC, the period effect observed in the Spanish population appears to be concordant with the beginning of levodopa prescription in the decade of the 1960s to 70s. However, after 2000 mortality started to increase strikingly, which could be related to awareness of levodopa side effects and the search for new therapy options. This could also be related to the slight ascent of mortality and the descent in mortality in the group above 75 years observed in the joinpoint analysis before the beginning of the 20th century, with a later mortality ascent. This idea was supported by Ulivelli et al.16 who stated a descent in Italian mortality rates in the PD population associated with levodopa, followed by a later rise in mortality. Regarding other therapeutic options, recently Tvete et al.34 reported that dopamine-agonists presented lower risk of mortality compared to monoamine oxidase B (MAO-B). However, we must point out that because of the study design used, no relational causes could be established, so the hypothesis under the period effect should be taken with caution.
Finally, our PYLL analysis supported the known and stated reduction in life expectancy of the disease, being higher in male.35
Clinical implicationsOne of the main clinical implications that could be extracted from our findings is the need to strengthen health measures to manage the disease, due to the remarkable increase in the mortality from PD between 1981 and 2020. In order to achieve this goal, the PARKINSON 2030 Delphi project has been proposed in the Spanish territory, to pave the road toward an accurate diagnostic and a proper therapeutic management of PD.36 Additionally, recognition of the increase in mortality in PD in 2020 could enable the identification of risk factors (such as comorbidities) and be the first step to plan health care programmes that would impact the survival of people diagnosed with PD.7
Strengths and limitationsThis study has strengths. To our knowledge, we provided the largest period assessed in Spain (40 years) to analyse mortality trends in the PD population. Another strength of our study is the use of the APC model to know how these factors could influence mortality throughout the analysis period. To our knowledge, this is the first study to use this model to examine Spanish mortality trends in PD. The use of the European Standard Population of 2013 will allow comparison with future studies. The use of a national mortality register ensured data reliability and allowed for the analysis of large death cases.
The main limitation of this study was the inability of APC methods to explain the reasons under changes in mortality trends. One example of this, is that we could hypothesise that the increase in mortality data could be caused by an underdiagnosis during first years of study, or the ageing of Spanish population during the studied period, but further research is needed to support these ideas. Regarding the ageing of population, it seems to be a risk factor for underdiagnosis or overdiagnosis in degenerative diseases, like PD,37 so this issue should be considered when interpreting our mortality rates results. We used data based on death certificates which could present bias, for example in PD mortality studies the attribution of death cause could change depending on the health care professional (eg, neurologist, internist, cardiologist). Even within the group of neurologists the fact that this professional is an expert or not in PD, it could condition the cause of death registered in death certificates, possibly leading to additional bias. These issues and the likely sticky-diagnosis bias could have conditioned our results.38 In addition, the number of neurologists since 1981 has grown exponentially in Spain and so the diagnostic precision; being possible that initial cases from 1981 could be diagnosed like only PD not identifying atypical parkinsonism cases. This could not only influence diagnosis, but also death certificates registries or mortality data. Changes in the ICD between 1981 and 2020 could have influenced our findings. However, there is no evidence of major changes associated with successive ICD revisions. Furthermore, data about comorbidities and clinical management were not available and could not be considered during the analysis.
ConclusionsThis study addressed mortality rates and trends, sex ratio, age-period-cohort effects, and potential years of life lost between 1981 and 2020 in the Spanish population with PD. We found a rise in mortality throughout the studied period, more notable in men. The overall trend of mortality for all ages was directly influenced by the results obtained in the older age group, which had the highest mortality rate. Although the group between 35 and 54 years old presented a descent in mortality from 1992, men experimented an ascension in mortality in 2020 supported by the sex ratio analysis. Alarming premature mortality in men recorded since 2014, and the strikingly increased in 2020 needs further study. The age, period, and cohort effects were found in the APC analysis. Regarding the continued rise of PD mortality in Spain, stronger efforts on early diagnoses and disease management should be considered.
Ethic approvalThe study received authorisation of Spanish National Statistics Institute to conduct this research (21 January 2020; reference no. ES002/2020). Informed consent not applicable.
FundingThe authors did not receive support from any organisation for the submitted work.
Data availability statementThe data that support the findings of this study are available from the corresponding author upon reasonable request.
Conflicts of interestNone.
The following is Supplementary data to this article:
