Supplement “Pulmonary Interstitial Pathology”
More infoThe term interstitial lung disease (also called diffuse infiltrative lung disease) encompasses a heterogeneous group of processes characterized by the appearance of an inflammatory reaction in the alveolar wall that can be triggered by different antigens. This group of diseases represents a wide spectrum of processes of diverse etiologies, and sometimes the nomenclature can be confusing.
High-resolution computed tomography (HRCT) is the imaging method of choice for the evaluation and diagnosis of interstitial lung diseases because it confirms the presence of lung disease and establishes the correct diagnosis for associated complications. Nevertheless, the definitive diagnosis of these entities requires the imaging findings to be interpreted together with their clinical manifestations and histological confirmation. In this group of diseases, HRCT findings play a fundamental role, being especially important for avoiding unnecessary biopsies. For these reasons, clinicians need to be familiar with the basic radiologic patterns associated with this group of lung diseases: septal, reticular, nodular, ground-glass, cystic, and consolidations. This chapter describes the features of these patterns and ways that they can present, and it reviews some of the most common interstitial lung diseases, emphasizing the predominant radiologic patterns in each of them.
Las enfermedades pulmonares intersticiales (EPI) o EPI difusas (EPID) engloban un grupo heterogéneo de procesos caracterizados por la aparición de una reacción inflamatoria en la pared alveolar, desencadenada por diferentes antígenos.
Este grupo de enfermedades representa un espectro de procesos de etiología diversa y, en ocasiones, nomenclatura confusa.
La tomografía computarizada de alta resolución (TCAR) es el método de imagen de elección en la evaluación y el diagnóstico de las EPID, ya que confirma la presencia de enfermedad pulmonar y establece el correcto diagnóstico de las complicaciones asociadas. No obstante, el diagnóstico definitivo de estas enfermedades requiere la concordancia con las manifestaciones clínicas y la comprobación anatomopatológica. Las imágenes radiológicas obtenidas por la TCAR en este grupo de enfermedades tienen un papel fundamental, de especial importancia para evitar la realización de biopsias innecesarias. Por estas razones, el médico clínico debe familiarizarse con los patrones radiológicos básicos asociados a este grupo de enfermedades pulmonares: septal, reticular, nodular, en «vidrio deslustrado», quístico y de condensación. En este capítulo se describen las características y la forma de presentación de estos patrones, y se revisan algunas de las EPID más frecuentes, haciendo hincapié en los patrones radiológicos predominantes en ellas.
The term “interstitial lung disease” (ILD) or acute or chronic “diffuse infiltrative lung disease” (DILD) encompasses a heterogeneous group of processes characterised by the appearance of an inflammatory reaction in the alveolar wall and triggered by different antigens that reach the alveolar epithelium after inhalation via the bloodstream. The response triggered by these varied antigens is usually stereotyped and leads to an inflammatory reaction initially located in the alveolar wall, which then extends into the alveoli and interstitium.
The incidence of DILD is estimated at 31.5 cases per 100,000 males and 26.1 cases per 100,000 females.1 The most common interstitial diseases are idiopathic interstitial pneumonia (IIP), sarcoidosis, and hypersensitivity pneumonitis (HP).2,3
Radiological imaging techniques are essential in studying DILD, mainly high-resolution computed tomography (HRCT). The radiologist’s role is to identify the radiological pattern and work with the clinician and pathologist to establish an agreement on a clinical diagnosis.
This paper aims to review the role of imaging tests in diagnosing DILD, in addition to describing the different basic radiological patterns in DILD, focusing on the role of HRCT in particular.
Radiological diagnostic methods in diffuse interstitial lung diseaseChest radiographyChest radiography continues to be a useful technique in the assessment of DILDs. It is accessible and inexpensive, and its radiation dose is low. It is also used to assess associated complications, such as pneumonia, pneumothorax, and lung cancer. Comparing new radiological findings with previous ones makes it possible to assess the progression and severity of the process.
Radiologically, the interstitial pattern is characterised by the presence of linear and micronodular images with the bilateral and diffuse distribution. Interstitial diseases are challenging to interpret in a simple chest study; disagreement between observers is up to 30%. In its initial phase, the sensitivity of chest radiography is very low. A radiopathologic correlation study in patients with the histologically confirmed interstitial disease showed that 10% of cases had a normal chest radiograph.4
High resolution computed tomographyHRCT is a widely used technique in DILD and small airway diseases.
Using this technique, morphologically detailed images of the anatomy of the secondary pulmonary lobule (SPL) are obtained, similar to the gross anatomy of the lungs. In CT-pathologic correlation studies of patients with histologically confirmed DILD, HRCT was normal in 11% of cases.5
From a technical point of view, HRCT is characterised by making thin slices (less than 2 mm thick, usually 1–1.5 mm). Using thicker slices makes it challenging to assess small structures, and slices with a thickness less than these values can increase the noise associated with the image and more radiation (Fig. 1). Using high-resolution and high-spatial-frequency reconstruction algorithms increases the resolution of parenchymal images, which appear more sharply defined. A sufficient radiation level in milliampere-seconds (mAs) is required to keep the noise level of the image as low as possible without subjecting the patient to excessively high doses of radiation. Rotation time should be as low as possible (e.g. 200−500 ms) and pitch’ should be 1–1.5.6–9
(a) 1-mm thick HRCT image obtained at the level of the lung bases in a patient with hypersensitivity pneumonitis in the chronic phase, with extensive bilateral pulmonary fibrosis and pronounced traction bronchiectasi in the middle lobe (arrow). (b) CT image with slice thickness of 5 mm at the same level has less clarity in detecting findings. The presence of prosthetic material in the ascending aorta stands out.
A dynamic expiratory acquisition will be performed in the baseline and control studies of patients with airway disease. To do this, images are obtained in maximal forced expiration at several selected levels.10–12
Imaging conducted with the patient in the prone position is optional, especially in patients with incipient DILD, asbestosis, or if posterior lung density is suspected in supine studies.13,14
The use of multiplanar reconstructions with maximum intensity projection (MIP) and minimum intensity projection, as well as reformatted images in coronal and sagittal planes, provides information additional to that of conventional studies.15–18
The recommended window width values are between 1000–1500 HU in the lung parenchyma and approximately 350–450 HU in the mediastinum. Window level values are –600 to –700 HU in the lung parenchyma and approximately 40–50 HU in the mediastinum.19–21
The indications for HRCT in DILD are: a) demonstrating the presence of lung disease in cases with clinical suspicion and normal radiography; b) more precisely characterising lung disease that has previously been demonstrated on chest radiograph, identifying its morphological pattern; c) assessing the possible activity of the disease and its treatment possibilities; d) indicating the most appropriate anatomical site for performing a biopsy and the type of procedure to be performed, and e) assessing the evolution of the disease.
It is important to adjust the tube current (mA) and voltage (kV) to the minimum values necessary to obtain quality images whilst keeping the radiation dose reasonable. This is especially important in young patients or those who will require multiple follow-ups. The low-dose technique must be appropriate for the patient and the available technology.
Anatomy of the secondary pulmonary lobuleThe SPL constitutes the smallest anatomical and functional unit of the lung. It is located at the subsegmental level, and its morphology is polyhedral and irregular, surrounded on all its faces by connective tissue septa. Its size is 1–1.25 cm at its maximum diameter and contains approximately 12 pulmonary acini. The pulmonary acini are fed by the respiratory bronchioles and make up the basic gas exchange unit. In the centre of the lobule is the arteriole and the terminal bronchiole. The venules and lymphatic ducts are located on the periphery of the same, inside the interlobular septa.22,23
HRCT is capable of identifying the three basic components of the SPL: the lobular parenchyma, the centrilobular structures, and the interlobular septa. These structures will be affected in a differentiated way in the different diseases that make up the DILDs. The pulmonary arteriole located in the centre of the SPL can be identified under normal conditions, it being more evident in cases in which it has an increased calibre, such as, for example, in pulmonary oedema. It has an approximate diameter of 0.5–1 mm. However, the terminal bronchiole cannot be identified under normal conditions due to the minimal thickness of its wall (approximately 0.15 mm).24
Basic radiological patternsThe assessment of DILDs by chest radiography is difficult. However, this imaging technique is the first diagnostic step to follow for a patient in whom the interstitial disease is suspected. It is important to note that HRCT should always confirm the detection of an interstitial pattern on a chest radiograph. With this technique, we will not only be able to characterise the findings, but we will also be able to assess their anatomical distribution.25
Using HRCT, interstitial lesions are grouped into seven basic patterns:
- 1.
Linear/reticular pattern.
- 2.
Small nodules, or micronodular pattern
- 3.
Ground-glass opacity pattern.
- 4.
Crazy-paving pattern.
- 5.
Consolidation pattern.
- 6.
Cystic pattern.
- 7.
Mosaic attenuation and mosaic perfusion pattern.
This pattern is due to interstitial thickening at the level of the interlobular septa or the intralobular interstitium:
- a)
Thickening of interlobular septa. The thickening of interlobular septa may be due to their infiltration by oedema, cellular infiltration, and infiltration by other materials such as amyloid, lymphatic dilation or proliferation, or fibrosis.
On the chest radiograph, interlobular septal thickening is represented by Kerley lines. When centrally located, it produces linear images several centimetres in length. The septa located on the periphery and perpendicular to the pleural surface give rise to the so-called Kerley B lines.
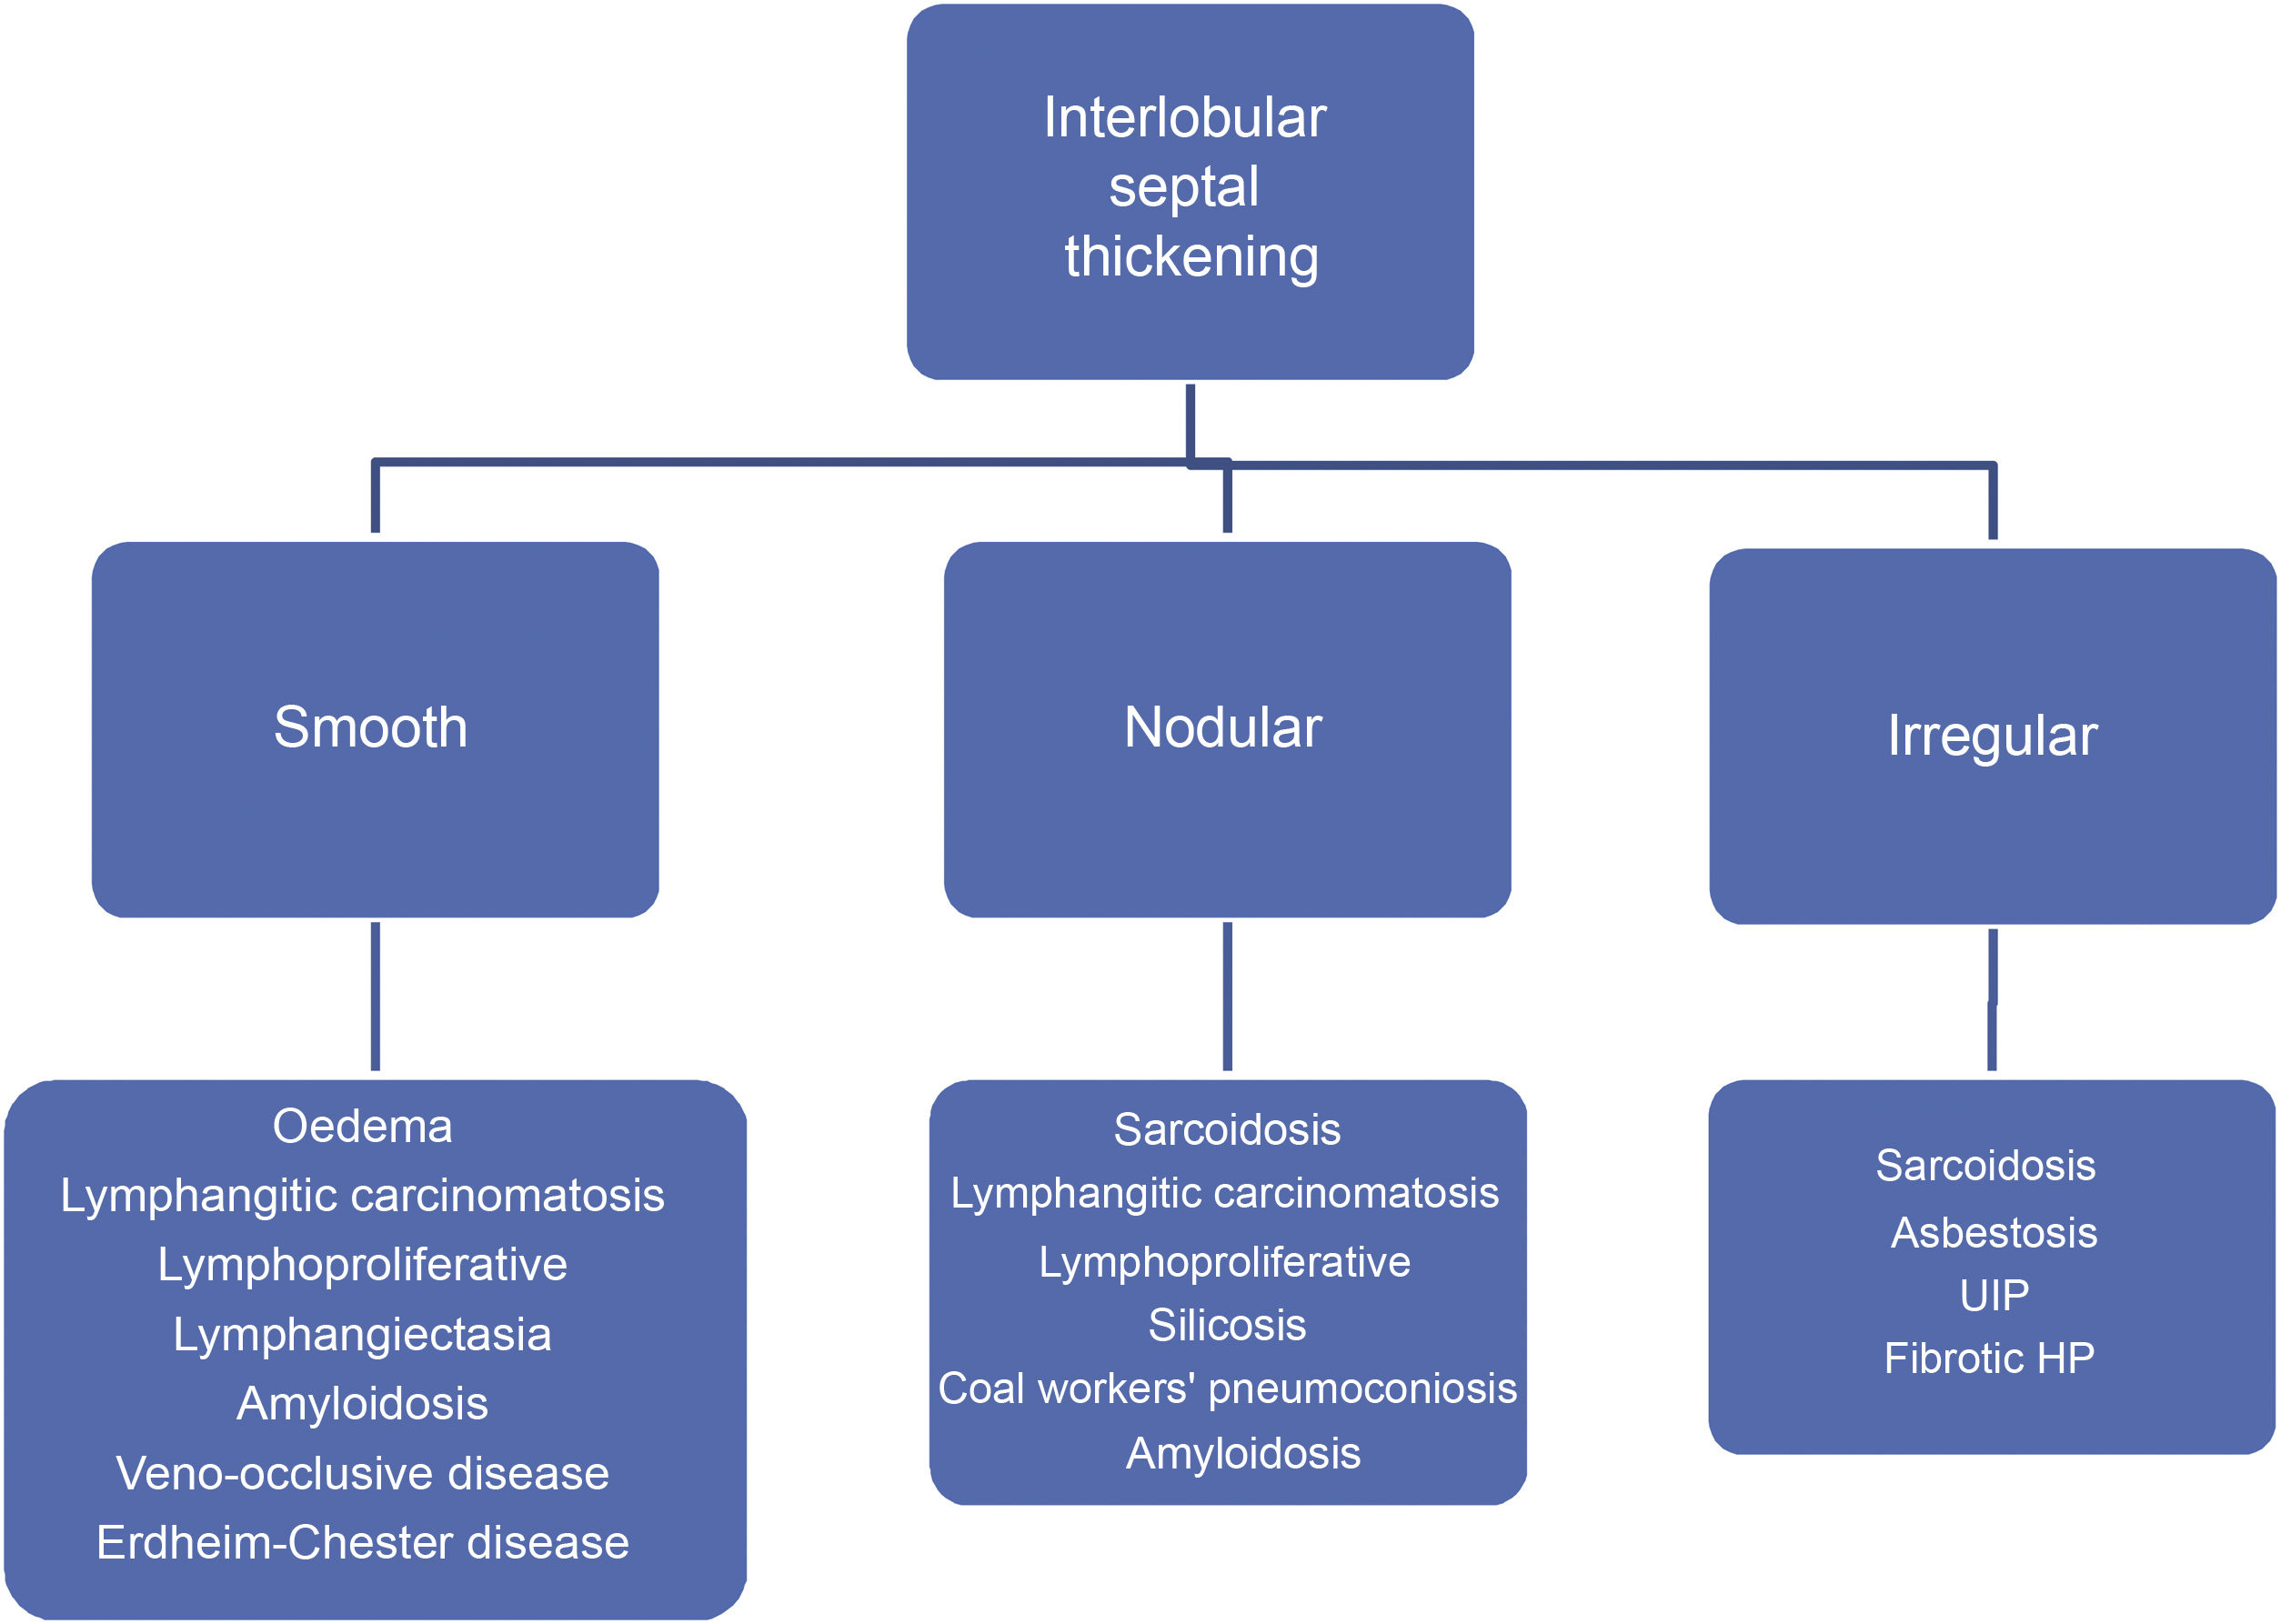
Septal thickening has a relative diagnostic value when it occurs in association with other HRCT abnormalities. But its differential diagnosis is limited when it occurs in an isolated or highly predominant way. Septal thickening may be smooth, nodular, or irregular. The assessment of its morphology facilitates the differential diagnosis (Algorithm 1).
Acute or chronic pulmonary oedema is the most common cause of smooth septal thickening (Fig. 2). Lymphangitic carcinomatosis should be considered in the differential diagnosis.
Nodular septal thickening is frequently associated with a perilymphatic distribution of nodules. It includes in its differential diagnosis sarcoidosis, lymphangitic carcinomatosis (Fig. 3), silicosis and coal workers’ pneumoconiosis, and amyloidosis, among other causes.
Interlobular septal thickening may occasionally present in an irregular form. This appearance is associated with pulmonary fibrosis, parenchymal distortion, and honeycombing, although it is not a predominant finding. It can be seen in pulmonary interstitial pneumonia, asbestosis, and HP. The coexistence of sarcoidosis with fibrotic phenomena can also be reflected by this pattern.
- b)
Reticular pattern or intralobular interstitial thickening. It is characterised by the presence of a fine reticular network that extends from the peribronchovascular structures in the centre of the lobule to the interlobular septa, with a “spider web” morphology (Fig. 4). This pattern is associated with interstitial fibrosis or infiltration or inflammation in the absence of fibrosis. The distortion produced by fibrotic phenomena makes it difficult to identify the lobule’s anatomy, so the term reticular pattern is preferable to intralobular interstitial thickening.
Small nodules are considered to be those with a diameter of less than 1 cm. In response to the Nomenclature Committee of the Fleischner Society, it is recommended that the term micronodule be used in a nodular structure of which the diameter is less than 3 mm.23 The micronodular pattern indicates the presence of numerous micronodules. However, alternating nodules of different sizes are common, especially in haematogenous metastases. This variation in size is less common in granulomatous infections, with a clear example being the miliary pattern, characterised by the presence of abundant micronodules with a diameter of less than 3 mm, of uniform size and distributed diffusely in the lung fields. The miliary pattern is a typical presentation of hematogenous tuberculosis dissemination and some haematogenous metastatic disseminations (Fig. 5).
Miliary pattern in a 51-year-old woman with thyroid neoplasm and pulmonary nodular dissemination. (a) The HRCT image obtained at the level of the pulmonary infundibulum reveals multiple pulmonary micronodules of the random bilateral distribution corresponding to pulmonary metastases. (b) The MIP reconstruction image at the same level facilitates the recognition of extensive lung involvement.
Assessing the contours and density of the nodules is useful for establishing the differential diagnosis. Ground-glass density nodules usually have poorly defined contours and are normally located in the centre of the SPL. Nodules in the interstitium usually have a soft or solid tissue density, and their contours are better defined. Table 1 shows the differential diagnosis of the nodular pattern based on contours.
Differential diagnosis of micronodular diseases based on the nodular contour.
| Well-defined | Poorly-defined | Well- or poorly-defined |
|---|---|---|
| Sarcoidosis | Hypersensitivity pneumonitis | Langerhans cell histiocytosis |
| Metastasis | Respiratory bronchiolitis | Lymphocytic interstitial pneumonia |
| Miliary infections | Follicular bronchiolitis | Pneumoconiosis |
| Amyloidosis | Multinodular lung adenocarcinoma | Infections |
| Organising pneumonia | ||
| Aspiration | ||
| Lung haemorrhage | ||
| Vasculitis | ||
| Pulmonary oedema |
The anatomical distribution of the nodules is the most valuable morphological datum for establishing a correct differential diagnosis. The nodular pattern may have a perilymphatic, centrilobular, or random distribution.
Perilymphatic distributionIn entities with nodules with perilymphatic distribution, HRCT reveals micronodules located in: a) the perihilar and peribronchovascular interstitium; b) the interlobular septa; c) the subpleural and fissural region, and d) in the peribronchovascular centrilobular interstitium. These regions are rich in lymphatic vascularity. The confluence of subpleural nodules can lead to the appearance of pseudoplaques, corresponding to linear areas of subpleural location several millimetres thick that mimic the appearance of pleural plaques from asbestos exposure.
The perilymphatic distribution is indicative of sarcoidosis (Fig. 6), silicosis, coal worker’s pneumoconiosis, lymphangitic carcinomatosis, lymphocytic interstitial pneumonia (LIP), and amyloidosis, among other entities.
Pulmonary sarcoidosis in a 31-year-old male patient. (a) The HRCT image located in the RUL reveals the peribronchovascular distribution of the pulmonary micronodules, surrounding the bronchovascular structures of the right hilum at the level of the RUL (yellow arrow). The septal distribution of micronodular involvement also stands out (white arrow). (b) The HRCT image located in the R major fissure also reveals the presence of micronodules at this level (arrow).
The term “centrilobular nodule” indicates the relationship with structures in the centre of the SPL, such as the terminal bronchioles and pulmonary arterioles. They are usually located at a distance of 5–10 mm from the pleural surfaces, fissures, and interlobular septa. They are typically found at the perivascular level in the centre of the SPL. Sometimes the air-filled terminal bronchiole can be identified in the centre of the same. Their contours can be poorly delimited, especially when they are located inside the alveolus. Their attenuation can be soft tissue or ground glass. The differential diagnosis of centrilobular nodules is broad and varies depending on their attenuation (soft tissue or ground glass) (Table 2; Fig. 7) and their overall distribution (Table 3).
Differential diagnosis of centrilobular nodules according to their attenuation.
| Ground-glass opacities | Soft tissues |
|---|---|
| Infectious bronchopneumonia or bronchiolitis | Infectious bronchopneumonia or bronchiolitis |
| Hypersensitivity pneumonitis | Langerhans cell histiocytosis |
| Respiratory bronchiolitis | Mucinous adenocarcinoma |
| Follicular bronchiolitis | Organising pneumonia |
| Organising pneumonia | Aspiration |
| Aspiration | |
| Mucinous adenocarcinoma | |
| Pulmonary oedema | |
| Lung haemorrhage | |
| Pulmonary arterial hypertension | |
| Vasculitis |
Differential diagnosis of centrilobular nodules according to their attenuation.
| Diffuse | Patchy | Upper | Lower |
|---|---|---|---|
| Infection | Endobronchial infection | Hypersensitivity pneumonitis | Aspiration |
| Oedema | Mucinous adenocarcinoma | Respiratory bronchiolitis | |
| Haemorrhage | Aspiration | Langerhans cell histiocytosis | |
| Pulmonary arterial hypertension | Pneumoconiosis | ||
| Hypersensitivity pneumonitis | |||
| Respiratory bronchiolitis | |||
| Follicular bronchiolitis |
The micronodular pattern with the “tree-in-bud” morphology deserves special mention. This pattern represents the presence of centrilobular micronodular structures with associated branches reminiscent of the morphology of a tree in bud. The differential diagnosis comprises a spectrum of entities with endobronchial and peribronchiolar involvement, including mucoid impactions, inflammation, or fibrosis. It is a pattern of peripheral predominance. It is common in panbronchiolitis, endobronchial dissemination of infection by mycobacteria and other infections (Fig. 8), and cystic fibrosis. On other occasions it can occur in non-infectious diseases of the airway, as in the case of pulmonary invasive mucinous adenocarcinoma. Rarely, disease originates from the centrilobular pulmonary arteriole, as in the case of intravascular injection of talc, tumour embolism, and pulmonary tumour thrombotic microangiopathy26 (Fig. 9).
Pulmonary tumour thrombotic microangiopathy in a male patient with pulmonary disseminated gastric neoplasm. The CT image located in the RLL reveals multiple branching micronodular images with a “tree-in-bud” morphology (arrows) corresponding to pulmonary intra-arteriolar dissemination, demonstrated at autopsy.
This type of distribution occurs in entities associated with pulmonary haematogenous dissemination. The most typical cases are miliary tuberculosis (Fig. 10), some fungal infections and haematogenous metastases. They usually appear in the form of well-defined micronodules with soft tissue density. Their distribution is often bilateral and symmetrical.
Miliary tuberculosis in a 32-year-old male patient. The CT image in MIP reconstruction located at the level of the upper lobes reveals extensive bilateral miliary micronodular dissemination of random distribution. Note the presence of a right pleural effusion with loculated morphology.
On HRCT, ground-glass opacity is defined as a slight increase in lung density, often geographically distributed, that does not obliterate underlying vascular structures. It is a non-specific pattern associated with alveolar, interstitial or mixed diseases. It is caused by partial filling of the airspace, by interstitial thickening (due to fluid, cells, or fibrosis), by partial collapse of alveolar structures, by increased capillary flow, or by a combination of several of these causes. Its presence in DILDs often indicates a potentially treatable cause. Its radiological interpretation constitutes a diagnostic challenge, with assessing the clinical context: acute, subacute or chronic, is very important.
Acute causes of ground glass opacity are: pulmonary oedema, pulmonary haemorrhage, acute interstitial pneumonia (AIP), adult respiratory distress syndrome, viral pneumonia, Pneumocystis jirovecii (P. jirovecii) pneumonia (Fig. 11), acute eosinophilic pneumonia and radiation pneumonitis, among others.
P. jirovecii pneumonia in a 43-year-old HIV+ male patient. (a) HRCT image in cross-section through the upper lobes of the lungs reveals increased bilateral diffuse ground-glass density. Multiple bilateral air-filled cystic images are seen in relation to infection by P. jirovecii. (b) HRCT image in coronal reconstruction highlights extensive bilateral involvement.
Subacute or chronic causes are: non-specific interstitial pneumonia, desquamative interstitial pneumonia, respiratory bronchiolitis, HP, organising pneumonia (OP), chronic eosinophilic pneumonia, pulmonary mucinous adenocarcinoma, lipoid pneumonia, and LIP, among others.
Crazy-paving patternThe crazy-paving pattern appears as a thickening of the interlobular septa and intralobular interstitium on a ground-glass pattern. It usually occurs with geographic margins. This pattern was initially described in association with alveolar proteinosis. Still, it has also been observed in exogenous lipoid pneumonia, alveolar haemorrhage, pulmonary oedema, diffuse alveolar damage, and P. jirovecii infection (Fig. 12), among other causes.
Consolidation patternThe consolidation pattern is characterised by an increase in pulmonary attenuation associated with blurring of the adjacent vessels’ contour; sometimes, an air bronchogram can be identified. In most cases it represents alveolar disease. It is a pattern that is frequently observed in infections and can also occur in AIP, OP (Fig. 13) and HP. In all these cases its attenuation is that of soft tissue. If it appears with low attenuation (fat) it is indicative of lipoid pneumonia (Fig. 14). Conversely, if its attenuation is high, it may suggest amiodarone poisoning.
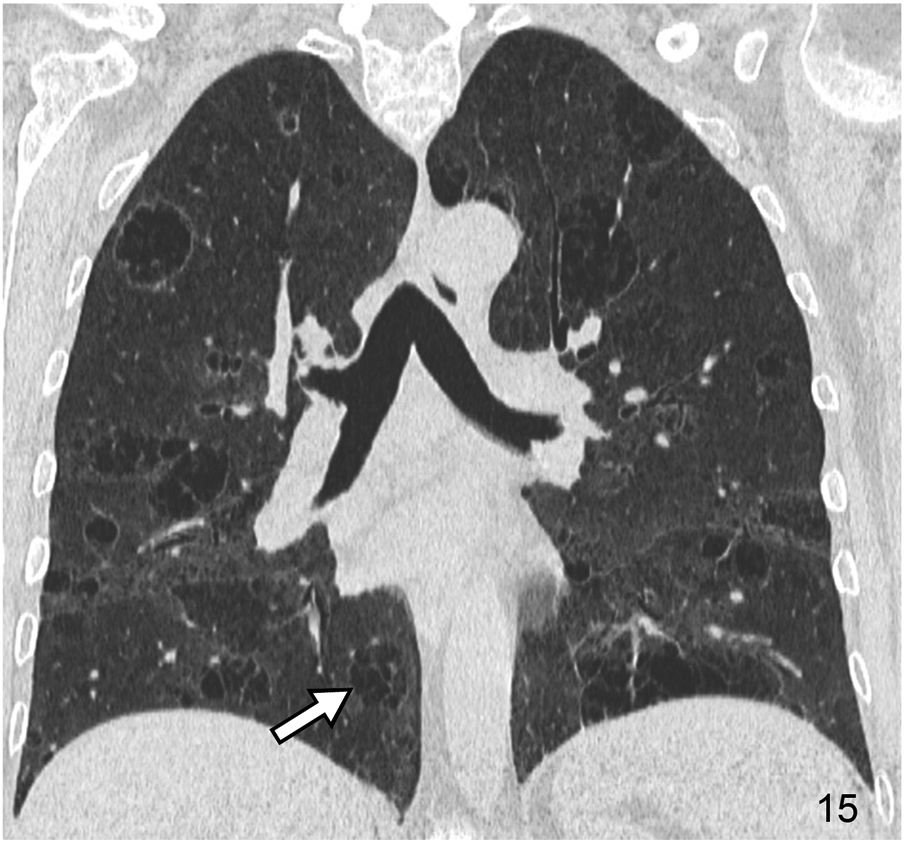
It is characterised by the existence of rounded images with thin walls (generally 1–2 mm thick), that are well-defined and with air inside. Cysts may represent pneumatoceles, honeycomb areas, and cystic bronchiectasis. Pneumatoceles are usually isolated, and cystic bronchiectasis has a tubular morphology on multiplanar reconstructed images. DILDs associated with cysts include usual interstitial pneumonia/idiopathic pulmonary fibrosis (UIP/IPF), LIP (Fig. 15), pulmonary Langerhans cell histiocytosis, and lymphangioleiomyomatosis, among others. The basic HRCT pattern in Langerhans cell histiocytosis consists of multiple cystic images predominantly involving the upper portions of both lungs. The coexistence of cystic and nodular lesions, with or without cavitation, is a very characteristic finding of this disease. In lymphangioleiomyomatosis, the HRCT pattern is characterised by multiple thin-walled, round-shaped air cysts with a diffuse distribution.
Cystic pattern in a 65-year-old woman with Sjögren’s syndrome and lymphocytic interstitial pneumonia (LIP). The HRCT image in the coronal reconstruction plane reveals extensive bilateral cystic involvement. Many of the cystic images with air content show abundant intralesional septa (arrow).
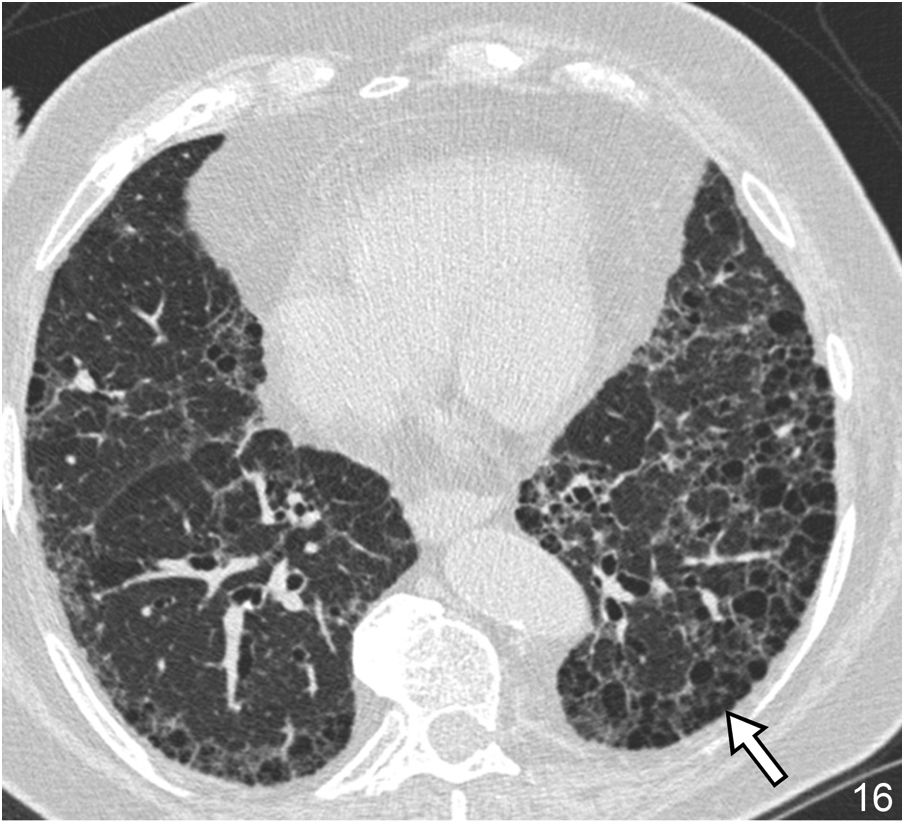
The honeycomb pattern is a variant of the cystic pattern of special importance in the study of DILD. Its identification establishes a prognosis since it reflects the presence of lung in the final stage, as the progressive phase of advanced pulmonary fibrosis. On HRCT, it manifests as a group of air cyst spaces with a diameter between 3–10 mm, but which, on occasion, can reach 2.5 cm. Their walls are 1–3 mm thick, and their location is peripheral at the subpleural level. The honeycomb pattern reflects rupture of the alveolar walls, dilation of the alveolar ducts, and bronchiolar dilatation. Its presence in a basal and posterior location is of great diagnostic value in UIP/IPF27 (Fig. 16). The correct identification of this pattern and its appropriate use in the radiological report is of great importance. Its reading generates discordance between observers in 29% of cases, especially in cases of paraseptal emphysema and traction bronchiectasis.28
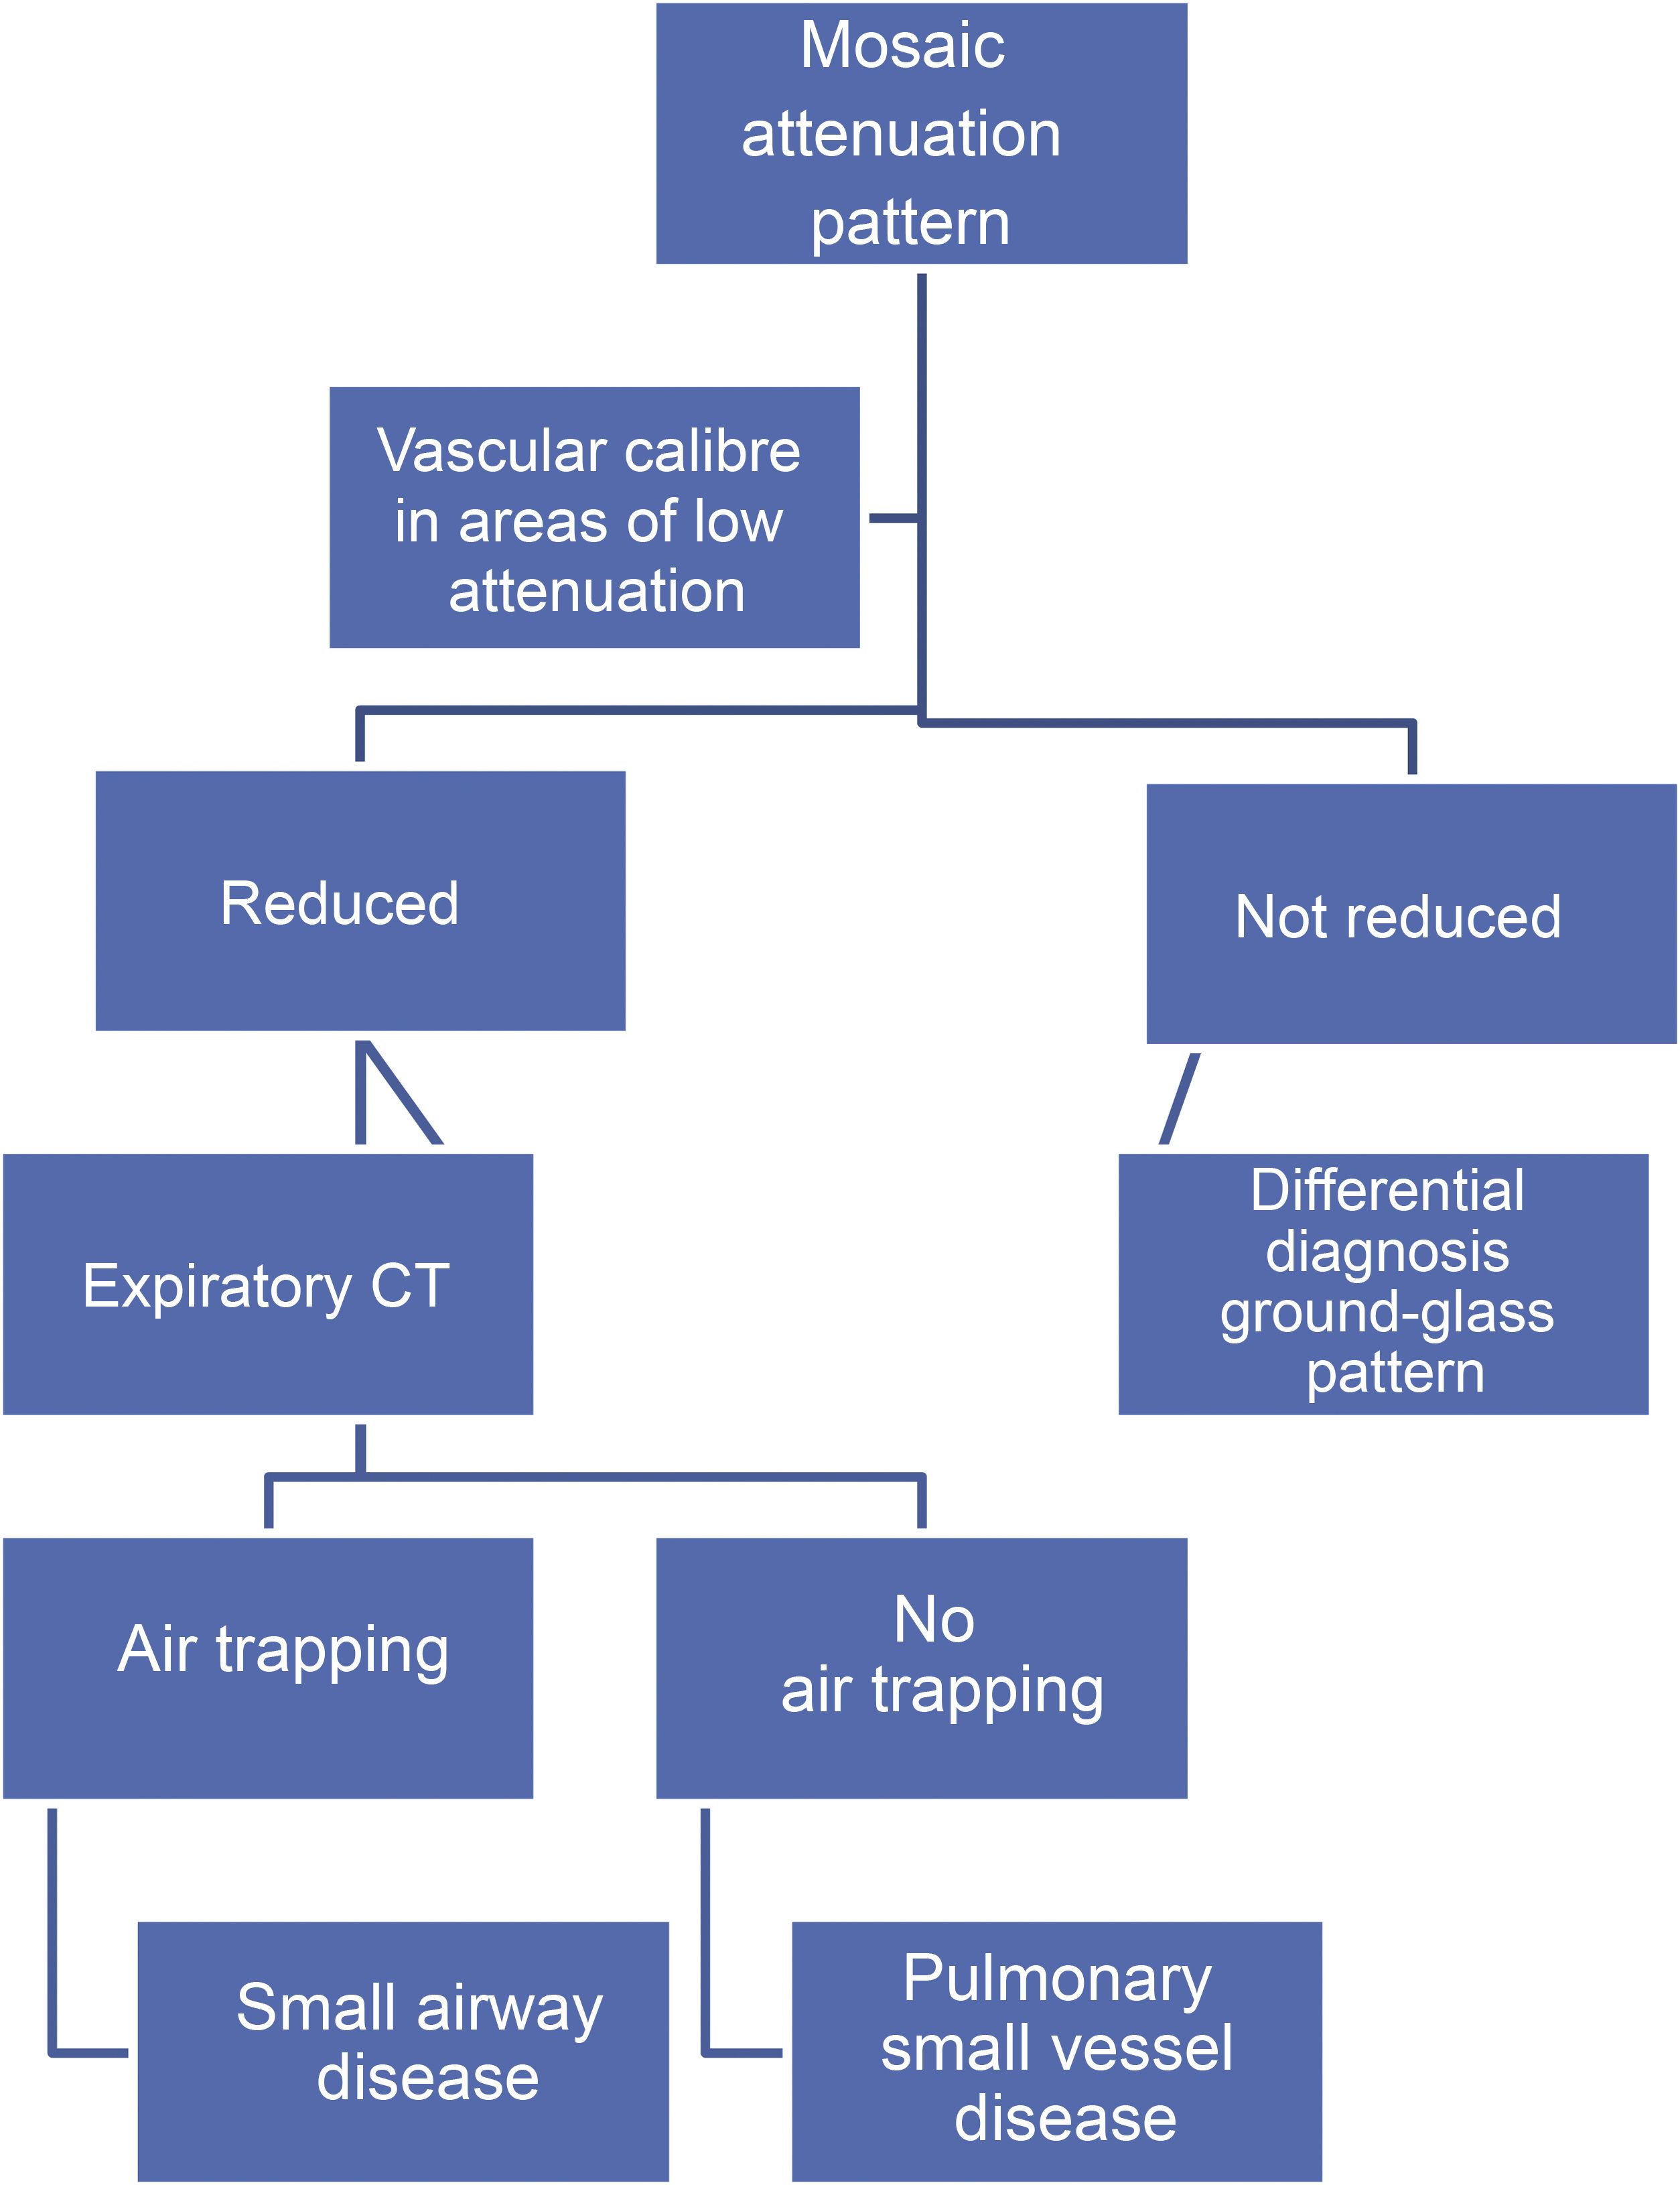
Mosaic attenuation patternThe mosaic attenuation pattern is characterised by alternating areas of low attenuation with others of higher attenuation in the lung. It is a common finding in HRCT, being identified in up to 20% of studies.29 The differential diagnosis of this pattern includes: a) DILD with patchy distribution on ground glass; b) obliterative small airway disease, and c) pulmonary small vessel disease.
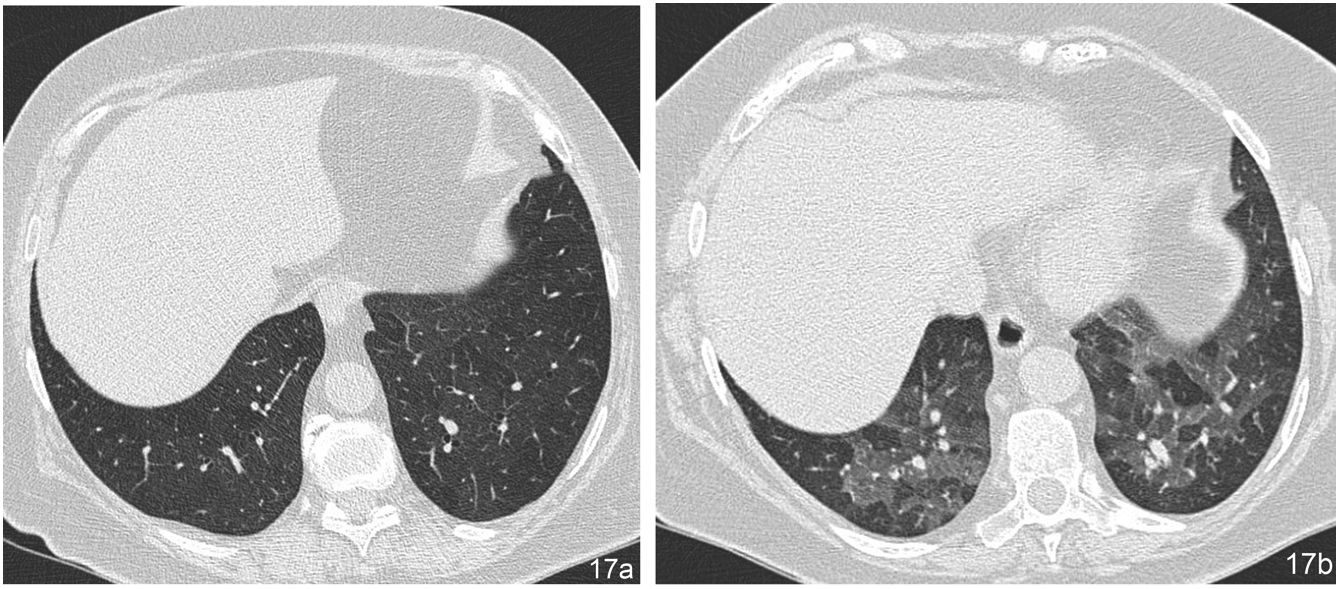
The term “mosaic perfusion pattern” only includes cases in which there is a decrease in vascular calibre in areas of low attenuation. When a mosaic perfusion pattern is identified, the study should be completed with dynamic expiratory slices, which will detect air trapping in cases of obliterative small airway disease, as in the case of bronchiolitis obliterans (Fig. 17) and bronchial asthma. In cases not associated with air trapping, pulmonary arteriole disease should be suspected, as in the case of chronic pulmonary embolism (Algorithm 2).
Mosaic perfusion pattern corresponding to bronchiolitis obliterans. (a) In the HRCT image during inspiration, no assessable abnormalities are observed. (b) The expiratory slice at the same level reveals multiple patchy areas of low attenuation with decreased vascular calibre, corresponding to air trapping.
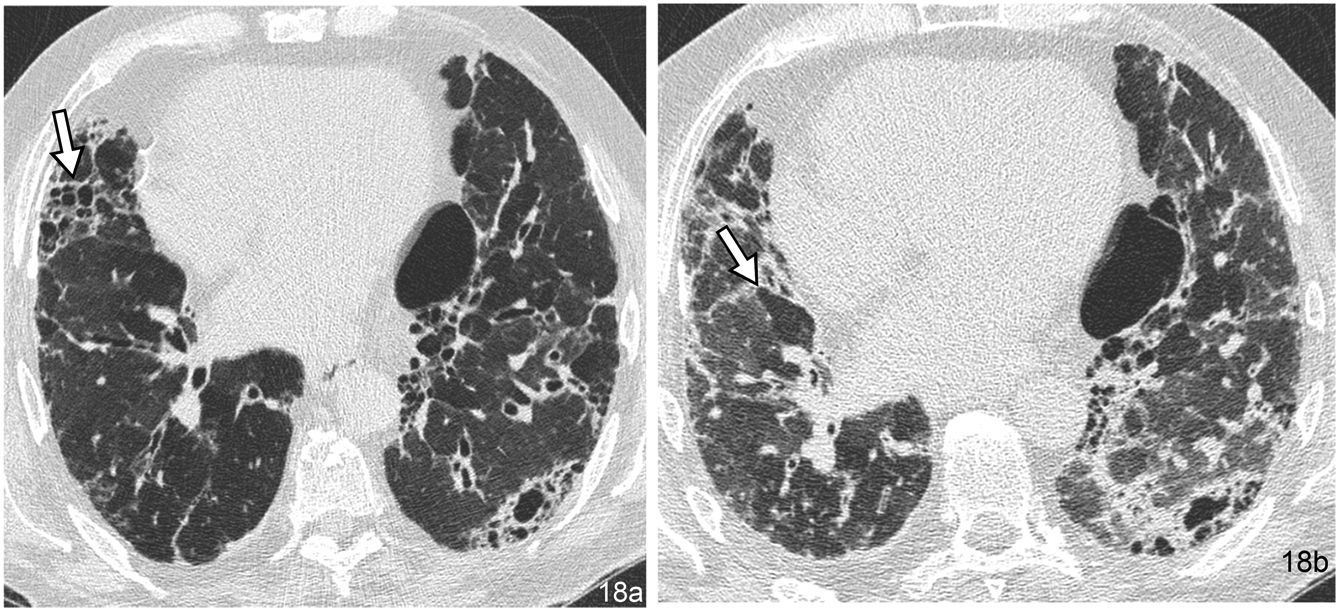
The “head cheese” pattern is a specific type of mosaic attenuation pattern. In this pattern, the disease is located in both areas of high attenuation and areas of low attenuation. Typically, the appearance on HRCT is reminiscent of a cold cut originating in Europe with this name. Alternating areas of high attenuation, reflecting fibrosis or infiltration, and areas of low attenuation, with decreased vascular calibre, reflecting obstructive small airway disease (Fig. 18) are observed. The new descriptive term, the “three-density” pattern, has recently been adopted to reflect underlying mixed infiltrative and obstructive disease.30 The most characteristic entity represented by this pattern is HP, but it has also been described in other entities, such as atypical pneumonias and LIP.
“Cheese head” pattern in a 74-year-old male patient with chronic hypersensitivity pneumonitis. (a) The inspiratory HRCT image shows alternating areas of pulmonary fibrosis with a honeycomb pattern (arrow) and areas of hypoattenuation of the parenchyma corresponding to air trapping. (b) The areas of trapping are shown more clearly in the expiratory slice at the same level (arrow).
The so-called ILD or DILD constitute a heterogeneous group of entities with confusing nomenclature and variable prevalence. They are characterised by involvement of the pulmonary interstitium and, variably, the alveolar space, bronchioles, and pulmonary vessels. Radiological imaging techniques, mainly HRCT, are very useful in the evaluation of these diseases, due to their role in identifying the different basic radiological patterns, which helps to establish an early diagnosis and facilitates specific treatment, especially in the earliest phases. Understanding the radiological anatomy of the lung functional unit, the SPL, and recognising the different basic patterns is of great importance. Correct identification is key in the differential diagnosis of these entities. The final diagnosis of DILDs must be made by multidisciplinary consensus, integrating clinical, radiological and pathological findings.
Authorship- 1.
Responsible for the integrity of the study: AG.
- 2.
Study conception: AG.
- 3.
Study design: AG.
- 4.
Data acquisition: AG and SM.
- 5.
Data analysis and interpretation: AG and TF.
- 6.
Statistical processing:
- 7.
Literature search: AG, SM and TF.
- 8.
Drafting of the article: AG, SM and TF.
- 9.
Critical review of the manuscript with intellectually significant contributions: AG, SM and TF.
- 10.
Approval of the final version: AG, SM and TF.
The authors declare that they have no conflicts of interest.


