


Ultrasonography (US) is the method of choice for evaluating thyroid nodules. In 2017, the American College of Radiology (ACR) created a classification system based on US characteristics. For the system to be adopted, it must be reproducible.
ObjectivesTo determine the intraobserver and interobserver variability of the ACR TI-RADS.
MethodsCross-sectional study; three radiologists with different levels of experience used the ACR TI-RADS to classify 100 nodules on two occasions one month apart, and we calculated the intraobserver and interobserver variability.
ResultsRegarding intraobserver variability, the first radiologist had nearly perfect concordance for composition, echogenicity, shape, and margins and substantial concordance for echogenic foci; the second radiologist had nearly perfect concordance for composition, echogenicity, shape, and margins and substantial concordance for echogenic foci, and the third radiologist had nearly perfect concordance for composition, echogenicity, and shape and substantial concordance for margins and echogenic foci. The interobserver concordance was calculated for the two readings; the concordance was substantial except for shape in the first reading and for echogenicity and margins in the second reading, which had moderate concordance.
ConclusionsThe ACR TI-RADS classification system is reproducible.
La ecografía es el método de elección para evaluar el nódulo tiroideo. En 2017, el American College of Radiology (ACR) creó un sistema de clasificación basado en características ecográficas. Para que el sistema se pueda adoptar, debe ser reproducible.
ObjetivosDeterminar la variabilidad intraobservador e interobservador del TIRADS-ACR.
MetodologíaEstudio transversal; 100 nódulos fueron clasificados de manera independiente por tres radiólogos con diferente experiencia utilizando el TIRADS-ACR. Se clasificaron los nódulos en dos oportunidades con intervalo de 1 mes. Se obtuvo la variabilidad interobservador e intraobservador.
ResultadosLa variabilidad intraobservador fue la siguiente: primer evaluador: concordancia casi perfecta para composición, ecogenicidad, forma y bordes y concordancia sustancial para focos ecogénicos. Segundo evaluador: concordancia casi perfecta para composición, ecogenicidad, forma y bordes y concordancia sustancial para focos ecogénicos. Tercer evaluador: concordancia casi perfecta para composición, ecogenicidad, forma y concordancia sustancial para focos ecogénicos y bordes. Las concordancias interobservador se obtuvieron en las dos evaluaciones. Los resultados estuvieron en categoría de concordancia sustancial excepto para forma en la primera evaluación y para ecogenicidad y bordes en la segunda evaluación que tuvieron concordancia moderada.
ConclusionesEl sistema de clasificación TIRADS-ACR es reproducible.
The prevalence of thyroid nodules depends on the diagnostic method, ranging from 20% to 60% with ultrasound and post-mortem studies.1,2 Although less than 10% of these nodules are malignant, the incidence of thyroid cancer has increased as more nodules are being diagnosed and more biopsies are being performed. We currently have a problem of over-diagnosis3 and over-treatment.4–6
Ultrasound is the method of choice to assess thyroid nodules,7,8 due to its ease of use and high availability, and the fact that it is not ionising, has high resolution in soft tissues, provides information in real time and assesses the vasculature. It also serves as a guide for biopsy.
Several ultrasound classifications have been designed to establish the risk of malignancy of thyroid nodules (American Thyroid Association, Chilean Thyroid Imaging Reporting and Data System [TIRADS], Korean TIRADS, Fernández Sánchez TIRADS, French TIRADS and European Thyroid Association TIRADS [EU-TIRADS]).9–17 These systems have been measured for their predictive value with the pathology results (Bethesda system).17–19
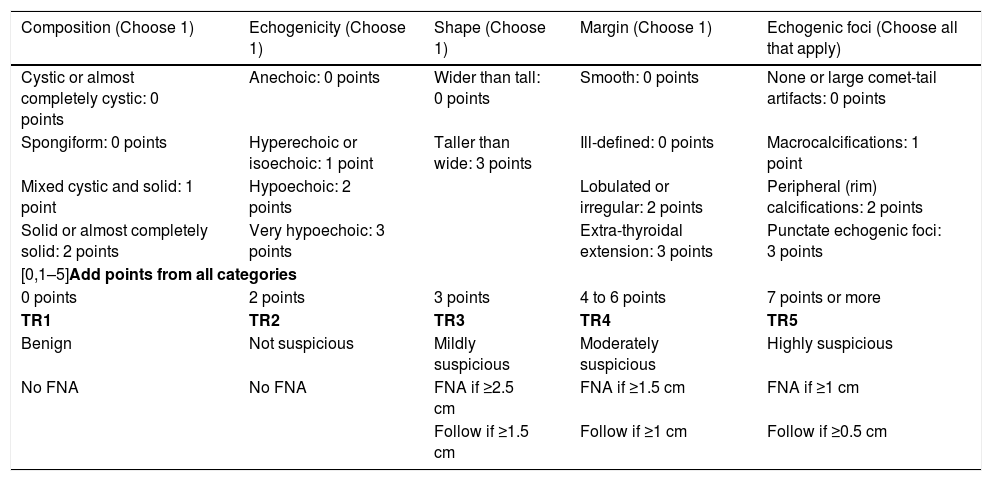
The American College of Radiology (ACR) created its classification system (ACR TI-RADS)20,21 (Table 1) based on ultrasound characteristics, and classifies thyroid nodules into five categories. Use of this system has led to a reduction in the number of biopsies,22 concordance with fine-needle aspiration (FNA) in excess of 83%18,19,23 and safety in paediatrics24; and that is why we are using it.
ACR TI-RADS.
| Composition (Choose 1) | Echogenicity (Choose 1) | Shape (Choose 1) | Margin (Choose 1) | Echogenic foci (Choose all that apply) |
|---|---|---|---|---|
| Cystic or almost completely cystic: 0 points | Anechoic: 0 points | Wider than tall: 0 points | Smooth: 0 points | None or large comet-tail artifacts: 0 points |
| Spongiform: 0 points | Hyperechoic or isoechoic: 1 point | Taller than wide: 3 points | Ill-defined: 0 points | Macrocalcifications: 1 point |
| Mixed cystic and solid: 1 point | Hypoechoic: 2 points | Lobulated or irregular: 2 points | Peripheral (rim) calcifications: 2 points | |
| Solid or almost completely solid: 2 points | Very hypoechoic: 3 points | Extra-thyroidal extension: 3 points | Punctate echogenic foci: 3 points | |
| [0,1–5]Add points from all categories | ||||
| 0 points | 2 points | 3 points | 4 to 6 points | 7 points or more |
| TR1 | TR2 | TR3 | TR4 | TR5 |
| Benign | Not suspicious | Mildly suspicious | Moderately suspicious | Highly suspicious |
| No FNA | No FNA | FNA if ≥2.5 cm | FNA if ≥1.5 cm | FNA if ≥1 cm |
| Follow if ≥1.5 cm | Follow if ≥1 cm | Follow if ≥0.5 cm | ||
FNA: fine-needle aspiration.
However, to be adopted, the system must be reproducible. The aim of our study was to determine the intraobserver and interobserver variability of the ACR TI-RADS.
Materials and methodsWe designed a cross-sectional study. The study was approved by the hospital's independent ethics committee. Informed consent was not required.
PatientsTwo of the investigators, third- and fourth-year radiology residents who were not going to act as assessors, with prior study of the ACR TI-RADS system, retrospectively selected 100 thyroid nodules from the hospital's picture archive system. Other similar studies had a similar sample size.25–29 With a sample size of 100, there was a 90% confidence level to reject the two-tailed null hypothesis that the kappa value was equal to 0.5 (that is, agreement between the assessors was exclusively by chance), with a kappa value to be detected of 0.8 and assuming a rate of the finding under study in the total sample of at least 30%. The indications for these ultrasound scans ranged from screening to pain, suspected nodule on physical examination and incidental nodule. They were selected consecutively and by consensus until 20 nodules were obtained from each of the five categories proposed by ACR TI-RADS (Fig. 1), using the "augmentation" strategy described by Zhou and cited by Obuchowski to guarantee a sufficient number of cases in each category.30 The ultrasound scans were performed from 1 July 2016 to 30 June 2018. Nodules were chosen from patients 18–70 years of age. There was no discrimination by gender, ethnicity, race or country of origin. The plan was not to include studies with incomplete or low quality images. However, none were excluded.
Study technique
The ultrasounds were performed by any of the 14 radiologists at our hospital, using one of two available ultrasound scanners (90 nodules were examined with the Siemens Acuson S3000 system and 10 patients were examined with the Siemens SC2000 system with 12 and 18MHz transducers). The images of the nodules were anonymised and presented in JPG format with axial and longitudinal sections (two images for each nodule).
Image analysisThe images were assessed by three radiologists with different amounts of experience. They had no knowledge of the clinical data or the radiology report. Assessor 1 was a third-year resident, assessor 2 was a radiologist with 15 years of experience and assessor 3 was a radiologist with 30 years of experience. The assessors classified the nodules twice, one month apart, using the ACR TI-RADS system.
Statistical analysisThe data obtained with the collection instrument were tabulated, differentiating each of the categories that make up the ACR TI-RADS. Intraobserver and interobserver variability was evaluated using the kappa statistic. As prevalence bias was found in the distribution of the results for intraobserver variability (marked imbalance in the frequency of the category assigned by the assessors due to the higher frequency of a response category) in the category "nodule shape", when evaluating for the prevalence indices and the asymmetry index in the agreement, the prevalence-adjusted bias-adjusted kappa (PABAK) was obtained, corresponding to the value that the kappa would take in the absence of bias and with equal prevalence of the categories. For the interobserver variability of the ACR TI-RADS category, which has five response possibilities, quadratic weighting was selected for two reasons: first, the more response possibilities, the greater the potential for discrepancies, which underestimates the true concordance; and, second, they wanted less penalisation of discrepancies between responses with neighbouring categories (e.g. where one assessor assigned the category ACR TI-RADS 1 and the other assigned the category ACR TI-RADS 2) and more penalisation of discrepancies between responses with non-neighboring categories (e.g. ACR TI-RADS 1 and ACR TI-RADS 4). For the other concordances, which showed no prevalence bias and fewer possible responses, the raw kappa was estimated.
The kappa index values were classified according to the Landis and Koch table (1977),31 as follows:
- •
0.00: no agreement.
- •
0.01–0.20: slight.
- •
0.21–0.40: fair.
- •
0.41–0.60: moderate.
- •
0.61–0.80: substantial.
- •
0.81–1.00: almost perfect agreement.
Intraobserver variability compared the assessments of the same observer, weighing the results of their first assessment against their second. Interobserver variability compared assessments between the different observers, both in the first and in the second assessment.
The kappa values were calculated with their confidence intervals and P values with the Epidat 4.2 and WINPEPI 11.65 software programs. A P<.05 was considered statistically significant.
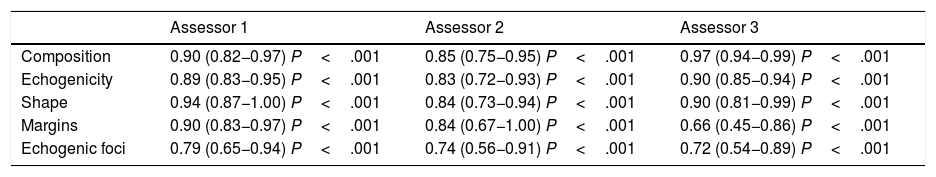
ResultsIntraobserver variability is shown in Table 2 and Fig. 2.
Intraobserver variability.
| Assessor 1 | Assessor 2 | Assessor 3 | |
|---|---|---|---|
| Composition | 0.90 (0.82−0.97) P<.001 | 0.85 (0.75−0.95) P<.001 | 0.97 (0.94−0.99) P<.001 |
| Echogenicity | 0.89 (0.83−0.95) P<.001 | 0.83 (0.72−0.93) P<.001 | 0.90 (0.85−0.94) P<.001 |
| Shape | 0.94 (0.87−1.00) P<.001 | 0.84 (0.73−0.94) P<.001 | 0.90 (0.81−0.99) P<.001 |
| Margins | 0.90 (0.83−0.97) P<.001 | 0.84 (0.67−1.00) P<.001 | 0.66 (0.45−0.86) P<.001 |
| Echogenic foci | 0.79 (0.65−0.94) P<.001 | 0.74 (0.56−0.91) P<.001 | 0.72 (0.54−0.89) P<.001 |
The kappa values are adjusted for prevalence bias.
The numbers in parentheses are the confidence intervals.
Assessor 1: third-year radiology resident. Assessor 2: radiologist with 15 years of experience. Assessor 3: radiologist with 30 years of experience.

Intraobserver variability was as follows:
- •
The first assessor, a radiology resident, had almost perfect agreement for composition, echogenicity, shape and margins, and substantial agreement for the category of echogenic foci.
- •
The second assessor, a radiologist with 15 years of experience, had almost perfect agreement for composition, echogenicity, shape and margins, and substantial agreement for the category of echogenic foci.
- •
The third assessor, a radiologist with 30 years of experience, had almost perfect agreement for composition, echogenicity and shape, and substantial agreement for echogenic foci and margins; the greatest variability was for margins.
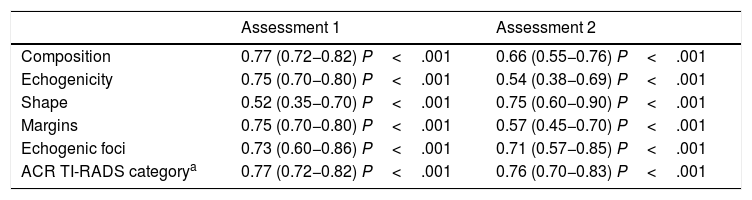
The interobserver variability is shown in Table 3 and Fig. 3. Agreement was obtained in both the first and second assessments:
- •
Composition: substantial agreement in the first and second assessments.
- •
Echogenicity: substantial agreement in the first assessment and moderate in the second.
- •
Shape: moderate agreement in the first assessment and substantial in the second.
- •
Margins: substantial agreement in the first assessment and moderate in the second.
- •
Echogenic foci: substantial agreement in the first and second assessments.
- •
ACR TI-RADS category: substantial agreement in both assessments.
Interobserver variability.
| Assessment 1 | Assessment 2 | |
|---|---|---|
| Composition | 0.77 (0.72−0.82) P<.001 | 0.66 (0.55−0.76) P<.001 |
| Echogenicity | 0.75 (0.70−0.80) P<.001 | 0.54 (0.38−0.69) P<.001 |
| Shape | 0.52 (0.35−0.70) P<.001 | 0.75 (0.60−0.90) P<.001 |
| Margins | 0.75 (0.70−0.80) P<.001 | 0.57 (0.45−0.70) P<.001 |
| Echogenic foci | 0.73 (0.60−0.86) P<.001 | 0.71 (0.57−0.85) P<.001 |
| ACR TI-RADS categorya | 0.77 (0.72−0.82) P<.001 | 0.76 (0.70−0.83) P<.001 |
The numbers in parentheses are the confidence intervals.
Interval between the two assessments: 30 days.

In our study, we found that intraobserver agreement ranged from substantial to almost perfect, and was better than interobserver variability. Our results were consistent with the findings of other similar studies in which intraobserver and interobserver agreement was measured.29,32 This was indicative that each assessor had well-defined, consistent criteria.
Within our intraobserver agreement, the category of echogenic foci had the lowest agreement index for the three assessors. In a study by Persichetti,29 the lowest level of intraobserver agreement was for margins. This may have been influenced by the way in which the nodules were presented (still photos in which the factors in our study could not be changed compared to picture archiving and communication system [PACS] images in the cited study). Routine daily practice conditions could produce different results.
The intraobserver agreement figures were higher for the resident than for the assessor with 15 years of experience, without affecting the agreement categories. In similar studies in which agreement was evaluated according to experience, performance was poorer among assessors with less experience.27,33 It has also been shown that performance improves with time and feedback.27,32,34,35 One possible explanation is, then, the rigour with which the resident applied the definitions and the resident's practice time with this classification.
Interobserver variabilityThe interobserver variability ranged from substantial to moderate, being moderate in the categories of shape, echogenicity and echogenic foci. None of the categories showed acceptable, mild or poor agreement, in contrast with a study by Hoang et al., in which shape and echogenic foci had acceptable interobserver agreement.25 Another study36 reported acceptable interobserver variability for composition, echogenicity and echogenic foci, and poor interobserver variability for shape and margins. A third study37 showed moderate interobserver agreement for composition, echogenic foci and shape, and acceptable agreement for echogenicity and margins. In studies of interobserver variability for other classifications of thyroid nodules, the most important factor for their behaviour was whether the study was multicentre or conducted at a single institution.29 Interobserver variability is better when, as in our case, the study is conducted at a single institution. When working at the same institution, definitions and criteria are unified; this is represented in our results.
LimitationsThe retrospective selection of the nodules and their presentation to the assessors in JPG format prevented variations in technical factors when assessing the nodules. This might have affected how they were perceived.
Despite the one-month interval between the two assessments, there could still have been recall bias. In similar studies, intervals ranging from four weeks to four months have been used.25,29,32
In summary, our study showed that most categories had almost perfect intraobserver agreement and substantial interobserver agreement. Assessment of thyroid nodules with the ACR TI-RADS classification system is reproducible.
Authorship- 1
Responsible for study integrity: CMGV and JAMD.
- 2
Study conception: CMGV.
- 3
Study design: VGG.
- 4
Data acquisition: CMGV, JAMD, SIZ, JFGL and VGG.
- 5
Data analysis and interpretation: CMGV, JAMD, SIZ, JFGL and VGG.
- 6
Statistical processing: N/A
- 7
Literature search: N/A
- 8
Drafting of the manuscript: CMGV, JAMD, SIZ and JFGL.
- 9
Critical review of the manuscript with intellectually significant contributions: CMGV, JAMD, SIZ and JFGL.
- 10
Approval of the final version: CMGV, JAMD, JFGL and VGG.
The authors declare that they have no conflicts of interest.
Please cite this article as: González Vásquez CM, Muñoz Durán JA, Isaza Zapata S, González Londoño JF, García Gómez V. Concordancia del TIRADS-ACR. Radiología. 2021;63:469–475.

