


Breast radiology: New horizons in times of pandemics
More infoThere have always been concerns about the secondary effects of diagnostic methods that use ionizing radiation. During mammography, the parameters to be concerned about are the mean glandular dose and the scatter dose. We evaluated the dose of radiation to the breast, thyroid gland, and lens in digital mammography in women with and without implants, in tomosynthesis in women with and without implants, and in contrast-enhanced mammography.
Materials and methodsThe study included 212 women with and without disease who were attended at the Centro Clínico de Estereotaxia, CECLINES, in Caracas, Venezuela, between June 2017 and August 2017; the women were classified into five groups according to the mammographic modality used to evaluate them and whether or not they had implants. The statistical analysis included descriptive statistics for the study population. We used the Mann-Whitney U to compare the mean glandular dose and dose in the thyroid gland and lens between groups.
ResultsThe mean glandular dose and the dose of radiation received in the thyroid and lens were within the acceptable range. In a few exceptions, the mean glandular dose per view was slightly higher than 3 mGy. The scatter dose to the thyroid gland and the lens during mammography has a very small contribution to the annual dose equivalent.
ConclusionThe mean glandular dose and the scatter dose to the thyroid gland and lens delivered during tomosynthesis and 2D mammography in women with implants were higher than those delivered during other mammographic techniques in women without implants.
Siempre ha existido preocupación por los efectos secundarios de métodos diagnósticos que utilizan radiaciones ionizantes. Durante una mamografía preocupa la dosis glandular promedio y la dosis de radiación dispersa. Evaluamos la dosis de radiación a la mama, glándula tiroides y cristalino con mamografía digital sin y con implante, tomosíntesis sin y con implante y mamografía con contraste.
Materiales y métodosEl estudio incluyó 212 mujeres sanas y con patología que fueron divididas en 5 grupos dependiendo de la modalidad mamográfica y de la presencia o no de implantes. Acudieron al Centro Clínico de Estereotaxia, CECLINES, en Caracas, Venezuela, entre junio y agosto de 2017. El análisis estadístico contempla una descripción de la población en estudio. Se comparó la dosis glandular promedio y la dosis en glándula tiroides y cristalino entre los grupos, utilizando el estadístico U de Mann Whitney.
ResultadosLa dosis glandular promedio y la dosis de radiación recibida en la glándula tiroides y el cristalino están dentro de los valores aceptables. En pocas excepciones, la dosis glandular promedio por proyección estaba discretamente por encima de los 3 mGy. La radiación dispersa a glándula tiroides y cristalino durante una mamografía tiene una contribución muy pequeña a la dosis anual equivalente.
ConclusiónLas pacientes con implante (tomosíntesis y mamografía 2D) tuvieron la mayor mediana de dosis glandular promedio y dosis a glándula tiroides y cristalino mayor que las modalidades mamográficas sin implantes.
Mammography is useful in the screening, diagnosis, treatment and follow-up of patients with breast cancer, but the fact that it uses X-rays has raised concerns about its use.1,2
It is not easy to demonstrate harmful, stochastic effects in the different medical diagnostic study techniques, as a result of using X-rays in radiodiagnosis, in the organs targeted or due to scatter radiation.1,2 This is because the dose levels used are continually decreasing and without immediate effects.
Mammography as a screening method has been questioned due to the possible induction of breast cancer or alterations in nearby organs,3 such as thyroid cancer and lens opacity (cataracts), and has been discussed in scientific documents, newspapers, magazines and even on social media.4,5
Those responsible for radiodiagnosis equipment must ensure that the radiation dose is within the permitted levels, as it is difficult to assess stochastic effects.2,6
Over the years, there have been notable improvements in mammography equipment, the technique used, our understanding of the advantages of compression, and the development and improvements of the different components of the equipment to take advantage of the delivered radiation dose, which is reflected in better image quality with a lower radiation dose.7,8
Differences between patients must be taken into account, such as the thickness and density of the breast, which conditions the power of the radiation used and variations in the exposure time. To these can be added the presence of breast implants, which require a greater number of projections, and greater breast thickness, requiring the technique to be adjusted in order to undertake a complete and interpretable study.4
In recent years, there has been a boom in the emergence of new mammographic modalities, such as tomosynthesis (3D mammogram) and contrast-enhanced mammography,9 which entail a significantly lower radiation dose and fewer projections per study.
A 2D mammogram requires four projections, but in patients with breast implants, more projections are required per breast. The number of projections can vary depending on the protocol of the centre, up to a maximum of eight according to Eklund et al.10 Contrast-enhanced mammography requires four projections, but there is variation in the tube, filters and in the power of the beam.9
Tomosynthesis deserves a special mention. Initially, the need to perform “combos” (four 3D projections plus four 2D projections) was considered.11 Subsequently, the number of projections varied until the reconstructed image was developed,8 and four 3D projections plus four reconstructed 2D projections are recommended.12 In patients with retropectoral implants, four 2D projections are added with the inclusion of the implants, which would increase the total radiation.
There are national and international bodies responsible for establishing dose limits and monitoring compliance.13–15
That is why we have proposed to estimate, in patients referred to our centre, the mean glandular dose (MGD) in the mammary gland and the radiation dose to the lens and the thyroid gland during the different mammography modalities: digital mammography (2D) and tomosynthesis (3D) with and without implants, and contrast-enhanced mammography.
Materials and methodsThe study was carried out with 218 women, healthy or with some condition, who went to the Centro Clínico de Estereotaxia (CECLINES) [Stereotactic Clinical Centre], in Caracas, Venezuela, to have a mammogram, between June and August 2017.
The patients signed the informed consent form. As the referral doctor's indication was not modified, an evaluation by the ethics committee was not necessary. Five study groups were analysed.
Inclusion criteria: female patients, healthy or with some condition, with or without retropectoral breast implants. Only patients with standard projections.
Exclusion criteria: male patients, pregnant women, patients with prepectoral implants, patients with additional views.
EquipmentWe used two Senographe Essential® machines from GE Healthcare, Buc, France, with an added SenoClaire® unit for tomosynthesis and SenoBright® unit for contrast-enhanced mammography. The correct working order of the equipment was confirmed three months prior by a medical physicist from the Laboratorio Secundario de Calibración Dosimétrica (LSCD) [Secondary Dosimetric Calibration Laboratory], Nuclear Technology Unit of the Instituto Venezolano de Investigaciones Científicas (IVIC) [Venezuelan Institute for Scientific Research] in Venezuela, based on national and international protocols.16
MeasuresThe MGD values, kilovoltage, milliamperage per exposure time in seconds, breast thickness, compression force, technical parameters (automatic or manual) and the details of the anode, molybdenum-rhodium and molybdenum-rhodium and copper filter, were all transcribed, per projection, from the doctor's viewing screen to an Excel spreadsheet, along with the patient's age, the presence or absence of implant, number of views and breast density according to BI-RADS®.17 An automatic technique was used in breasts without implants and a manual technique in patients with implants (Table 1).
Analysis of variation in the mean glandular dose values in relation to the technical parameters used in each of the mammographic projections by study group (group 1 to 4).
| Group | Projection | Technical parameters | |||||||||
|---|---|---|---|---|---|---|---|---|---|---|---|
| Kvp | mAs | Thickness (cm) | Comp. (N) | Mean glandular dose (mGy) | |||||||
| Avg. (max-min) | CV% | Avg. (max-min) | CV% | Avg. (max-min) | CV% | Avg. (max-min) | CV% | Avg. (max-min) | CV% | ||
| 1 | RCC | 29.0 (30.0−27.0) | 2.99 | 60.6 (79.0−44.4) | 21.04 | 5.9 (7.5−2.9) | 26.41 | 108.9 (130−80) | 14.11 | 1.45 (1.8−1.0) | 18.11 |
| LCC | 28.9 (31.0−26.0) | 4.39 | 67.6 (99.0−44.0) | 24.68 | 6.1 (7.6−2.9) | 24.58 | 94.4 (110−70) | 17.65 | 1.60 (2.1−1.1) | 23.80 | |
| RMLO | 29.0 (31.0−26.0) | 4.56 | 67.6 (91.0−43.0) | 25.36 | 6.4 (10.0−3.1) | 29.70 | 115.6 (140−80) | 20.12 | 1.63 (2.2−1.2) | 20.12 | |
| LMLO | 29.0 (31.0−26.0) | 4.56 | 68.6 (89.0−44.0) | 19.71 | 6.4 (8.7−2.9) | 25.60 | 93.3 (110−70) | 16.94 | 1.60 (2.1−1.3) | 15.80 | |
| 2 | RCC | 28.1 (30.0−27.0) | 2.20 | 78.2 (80.0−56.0) | 6.52 | 7.8 (9.8−6.2) | 11.81 | 69.4 (90−30) | 24.79 | 1.3 (1.6−0.9) | 15.8 |
| LCC | 28.2 (30.0−27.0) | 2.57 | 78.6 (80.0−56.0) | 6.26 | 7.8 (9.7−6.0) | 12.56 | 71.5 (100−40) | 23.91 | 1.3 (2.1−0.9) | 20.14 | |
| RMLO | 28.2 (30.0−27.0) | 2.52 | 78.6 (80.0−56.0) | 6.26 | 7.4 (9.6−1.0) | 12.99 | 72.3 (110−30) | 26.53 | 1.3 (1.9−0.9) | 18.01 | |
| LMLO | 28.2 (30.0−27.0) | 2.52 | 78.6 (80.0−56.0) | 6.26 | 7.4 (9.4−6.2) | 12.98 | 72.2 (100−30) | 25.02 | 1.3 (2.2−0.1) | 25.31 | |
| RCC ID | 27.9 (29.0−26.0) | 2.67 | 65.1 (80.0−38.0) | 22.41 | 3.8 (5.8−1.7) | 27.40 | 55.9 (90−30) | 30.83 | 1.7 (2.7−0.9) | 27.44 | |
| LCC ID | 27.7 (29.0−26.0) | 2.61 | 67.4 (84.0−40.0) | 19.92 | 3.8 (8.0−2.0) | 32.93 | 58.7 (100−23) | 33.01 | 1.7 (2.5−1.0) | 26.21 | |
| RMLO ID | 27.4 (29.0−26.0) | 2.85 | 66.3 (80.0−45.0) | 20.25 | 3.7 (5.2−1.3) | 25.47 | 61.7 (110−30) | 34.66 | 1.7 (2.9−1.0) | 29.02 | |
| LMLO ID | 27.6 (29.0−26.0) | 2.99 | 65.5 (80.0−33.0) | 21.55 | 3.6 (5.8−1.7) | 27.75 | 61.3 (110−30) | 28.51 | 1.7 (2.6−0.8) | 29.85 | |
| 3 | RCC | 29.1 (31.0−26.0) | 2.50 | 66.2 (117.0−36.0) | 27.00 | 5.3 (7.5−2.4) | 21.9 | 93.1 (130−50) | 20.1 | 1.9 (3.4−0.8) | 25.5 |
| LCC | 29.2 (31.0−26.0) | 2.40 | 68.2 (189.0−27.0) | 32.50 | 5.4 (8.5−2.6) | 21.5 | 94.9 (140−40) | 20.1 | 1.9 (5.3−0.9) | 31.5 | |
| RMLO | 29.3 (31.0−26.0) | 3.10 | 70.3 (144.0−27.0) | 28.10 | 5.4 (7.9−2.5) | 22.6 | 96.5 (150−50) | 20.9 | 2.0 (4.0−1.0) | 28.5 | |
| LMLO | 29.3 (26.0−26.0) | 2.90 | 72.3 (225.0−36.0) | 33.40 | 5.5 (8.7−2.6) | 22.3 | 96.3 (150−50) | 18.3 | 2.0 (6.1−1.1) | 32.5 | |
| 4 | RCC | 28 | 0 | 80 | 0 | 7.3 (9.0−3.7) | 17.7 | 61.5 (90−30) | 29.5 | 1.4 (1.7−1.1) | 12.4 |
| LCC | 28.1 (29.0–28.0) | 0.8 | 80 | 0 | 7.5 (9.2−3.7) | 16.7 | 62.0 (90−40) | 27.5 | 1.4 (1.6−1.1) | 12.1 | |
| RMLO | 28 | 0 | 80 | 0 | 7.0 (9.1−3.4) | 18.3 | 66.5 (100−40) | 25.5 | 1.4 (1.6−1.1) | 12.2 | |
| LMLO | 28 | 0 | 80 | 0 | 7.2 (9.6−3.1) | 20 | 65.0 (100−40) | 26.2 | 1.3 (1.9−0.91) | 16.5 | |
| RCC ID | 28.9 (29.0−26.0) | 2.3 | 47.0 (63.0−27.0) | 24.6 | 4.3 (8.0−1.5) | 33.7 | 55.0 (80−40) | 20.9 | 1.4 (1.9−0.85) | 19.7 | |
| LCC ID | 28.7 (29.0−26.0) | 3.2 | 50.4 (72.0−27.0) | 24.9 | 4.2 (7.2−1.7) | 30 | 56.5 (80−40) | 19.3 | 1.5 (2.1−0.97) | 19.3 | |
| RMLO ID | 29 | 0 | 50.0 (81.0−27.0) | 25.8 | 4.2 (6.4−1.9) | 27.6 | 54.2 (80−30) | 26.3 | 1.5 (2.3−0.88) | 22.3 | |
| LMLO ID | 28.7 (29.0−26.0) | 3.2 | 46.1 (72.0−27.0) | 26.7 | 4.0 (6.3−1.5) | 29.2 | 58.0 (80−30) | 22.8 | 1.4 (1.9−0.89) | 21.8 | |
avg.: average; cm: centimetre; comp: compression; CV%: coefficient of variation; kVp: peak kilovoltage; LCC: left craniocaudal; LCC ID: left craniocaudal with implant displacement; LMLO: left mediolateral oblique; LMLO ID: left mediolateral oblique with implant displacement; mAs: milliampere seconds; max: maximum; mGy: milligrays; min: minimum; proj: projections; RCC: right craniocaudal; RCC ID: right craniocaudal with implant displacement; RMLO: right mediolateral oblique; RMLO ID: right mediolateral oblique with implant displacement.
Thermoluminescent dosimeters (TLDs) were used to measure radiation in the thyroid gland and in the lens. The dose to the thyroid gland and the lens is the result of the sum of all the projections. One TLD was placed between the two eyebrows and another one over the isthmus of the thyroid gland. The studies were carried out by radiological technicians and were evaluated by radiologists with five years and 22 years of experience, respectively.
After exposure, the TLDs were submitted for reading in less than five hours. Background radiation was recorded using three TLDs placed outside the mammography room, the average value of which was subtracted from the value recorded by each dosimeter to give the radiation dose to the skin of the thyroid gland and to the lens.
Fifty Radcard® (Poland) MCP-type TLD-100H dosimeters were used, made of lithium fluoride doped with magnesium, copper and phosphorus, CHIP type and measuring 3.2 mm × 3.2 mm × 0.9 mm. Detection threshold: 50 nGy. The TLDs were calibrated according to the method used by the LSCD and described by Leal et al.18
The statistical analysis was carried out in two phases. The first entailed a descriptive statistic that characterised the study population. In the second phase, the comparative evaluation of the median MGD and measured doses in the thyroid gland and lens between the groups was carried out, using the Mann Whitney U comparison statistic for the number of patients in each study group. Statistical significance was established as P < .05. Statistical calculations were performed using Microsoft Excel® 2013 (Microsoft, Redmont, USA) and with the statistical program Real Statistics Using Excel (www.real-statistic.com).
Groups with the same number of projections with different modalities of mammography were compared. For the comparison of the groups with implants, the total dose of each projection was considered as the sum of the dose with implant plus that of the implant displacement.
ResultsOf the 218 patients, six were excluded for having prepectoral implants, so a total of 212 patients were included. All implants were silicone.
Patient groups:
Group 1: 9 patients (4.2%) with 2D digital mammograms without implants, four projections.
Group 2: 29 patients (13.7%) with 2D digital mammograms with implants: four with the inclusion and four with the displacement of the implants.
Group 3: 139 patients (65.6%) with 3D mammography. Four 3D views and four synthetic 2D images were made.
Group 4: 20 patients (9.4%) with implant and 3D mammography: four 2D views with inclusion and four 3D views with implant rejection and four synthetic 2D images.
Group 5: 15 patients (7.1%) with contrast-enhanced spectral mammography (CESM).
Table 2 shows the characterisation of the population, with a median age of 52 years (79 to 31), the distribution by group and breast density according to ACR-BI-RADS®. The results were analysed as follows:
Characterisation of the population.
| Classification of the population by study group and breast density | |
|---|---|
| Total population | 212 |
| Age (years) | Med. (max-min) |
| 52 (79−31) | |
| Classification | n (%) |
| Group 1 | 9 (4.2) |
| DA | 4 (44.4) |
| DB | 3 (33.3) |
| DC | 2 (22.2) |
| Group 2 | 29 (13.7) |
| DB | 12 (41.4) |
| DC | 14 (48.3) |
| DD | 3 (10.3) |
| Group 3 | 139 (65.6) |
| DA | 16 (11.5) |
| DB | 46 (33.1) |
| DC | 51 (36.7) |
| DD | 26 (18.7) |
| Group 4 | 20 (9.4) |
| DA | 1 (5.0) |
| DB | 9 (45.0) |
| DC | 9 (45.0) |
| DD | 1 (5.0) |
| Group 5 | 15 (7.1) |
| DB | 5 (33.3) |
| DC | 8 (53.3) |
| DD | 2 (13.3) |
DA, DB, DC, DD: A, B, C, D density respectively, by ACR; max: maximum; med.: median; min: minimum.
Mean glandular dose: group 5 was excluded for not having been able to retrieve all the necessary data.
The mean value, range and coefficient of variation (CV%) were obtained to observe the behaviour of the values of each of the parameters that could affect the mean glandular dose (Table 1).
In group 3, the median MGD (Table 3) for the right craniocaudal (RCC), left craniocaudal (LCC), right mediolateral oblique (RMLO) and left mediolateral oblique (LMLO) views were 1.29, 1.02, 1.12 and 1.15 times higher, respectively, than those of group 1. When comparing groups 2 and 4, no statistically significant differences were observed (P > .05). Most of the values in group 2 were higher than in group 4.
Comparison of mean glandular dose (MGD) between groups with the same number of projections, but with different modality of mammography, and comparison of MGD between groups with a different number of projections, but with the same modality of mammography.
| Mann-Whitney U (α = 0.05) | ||||||
|---|---|---|---|---|---|---|
| Projection | MGD. G1 (mGy) | MGD. G3 (mGy) | P value | Sig. | ||
| Median | Average (max-min) | Median | Average (max-min) | |||
| RCC | 1.36 | 1.45 (1.79−1.03) | 1.76 | 1.85 (3.43−0.84) | .005 | Yes |
| LCC | 1.75 | 1.60 (2.10−1.10) | 1.78 | 1.91 (5.25−0.93) | .137 | No |
| RMLO | 1.65 | 1.62 (2.15−1.20) | 1.85 | 1.98 (4.00−0.96) | .049 | Yes |
| LMLO | 1.62 | 1.60 (2.06−1.26) | 1.86 | 2.03 (6.07−1.12) | .013 | Yes |
| Projection | MGD. G2 (mGy) | MGD. G4 (mGy) | P value | Sig. | ||
|---|---|---|---|---|---|---|
| Median | Average (max-min) | Median | Average (max-min) | |||
| RCC + RCC ID | 2.95 | 2.97 (4.00−2.01) | 2.94 | 2.89 (3.33−3.21) | .369 | No |
| LCC + LCC ID | 2.91 | 3.08 (4.09−2.38) | 2.80 | 2.85 (3.38−2.40) | .206 | No |
| RMLO + RMLO ID | 2.87 | 2.98 (4.18−2.21) | 2.88 | 2.88 (3.37−2.27) | .880 | No |
| LMLO + RMLO ID | 2.93 | 3.00 (2.93−4.05) | 2.72 | 2.77 (2.80−2.35) | .072 | No |
| Projection | MGD. G1 (mGy) | MGD. G2 (mGy) | P value | Sig. | ||
|---|---|---|---|---|---|---|
| Median | Average (Max-min) | Median | Average (Max-min) | |||
| RCC | 1.36 | 1.45 (1.79−1.03) | 2.95 | 2.97 (4.00−2.01) | .00001 | Yes |
| LCC | 1.75 | 1.60 (2.10−1.10) | 2.91 | 3.08 (4.09−2.38) | .00001 | Yes |
| RMLO | 1.65 | 1.62 (2.15−1.20) | 2.87 | 2.98 (4.18−2.21) | .00001 | Yes |
| LMLO | 1.62 | 1.60 (2.06−1.26) | 2.93 | 3.00 (2.93−4.05) | .00003 | Yes |
| Projection | MGD. G3 (mGy) | MGD. G4 (mGy) | P value | Sig. | ||
|---|---|---|---|---|---|---|
| Median | Average (Max-min) | Median | Average (Max-min) | |||
| RCC + RCC ID | 1.76 | 1.85 (3.43−0.84) | 2.94 | 2.89 (3.33−3.21) | .0000000002 | Yes |
| LCC + LCC ID | 1.78 | 1.91 (5.25−0.93) | 2.80 | 2.85 (3.38−2.40) | .0000000004 | Yes |
| RMLO + RMLO ID | 1.85 | 1.98 (4.00−0.96) | 2.88 | 2.88 (3.37−2.27) | .000000003 | Yes |
| LMLO + RMLO ID | 1.86 | 2.03 (6.07−1.12) | 2.72 | 2.77 (2.80−2.35) | .00000002 | Yes |
G1, G2, G3, G4: Groups 1, 2, 3, 4, respectively; LCC: left craniocaudal; LCC ID: left craniocaudal with implant displacement; LMLO: left mediolateral oblique; LMLO ID: left mediolateral oblique with implant displacement; max: maximum; min: minimum; RCC: right craniocaudal; RCC ID: right craniocaudal with implant displacement; RMLO: right mediolateral oblique; RMLO ID: right mediolateral oblique with implant displacement; sig: significance.
A significant increase (P < .05) was observed in the median dose of group 2 compared to group 1, with 2.17, 1.66, 1.74 and 1.81 times more for RCC, LCC, RMLO and LMLO, respectively. The same was true for group 4 compared to group 3, where the statistically significant increase (P < .05) was 1.67, 1.57, 1.56 and 1.46 times more for RCC, LCC, RMLO and LMLO, respectively.
Thyroid gland and lens dose: with the five study groupsThe dose measured at the lens for group 3 was slightly higher than for group 1; the same was true of group 4 compared to group 2, with no statistically significant difference (P > .05). A statistically significant increase in the dose measured in the lens (P < .05) was recorded in group 5 compared to groups 1 and 3. The median dose in the lens in groups 2 and 4 was higher than the value recorded for group 5, with the difference being statistically significant (P < .05). The median doses to the lens were higher in groups 4 and 2 than in groups 3 and 1, respectively, with the difference being statistically significant (P < .05).
The median radiation doses to the thyroid gland were found to be slightly lower in groups 3 and 4 compared to groups 1 and 2, respectively, with no statistically significant differences observed (P > .05). The median dose for group 5 was slightly higher than in groups 1 and 3, but this was not statistically significant (P > .05). The median dose to the thyroid gland was higher in group 2 than in group 5, which in turn was higher than in group 4, but this was not statistically significant (P > .05). The median dose to the thyroid gland was higher in group 2 than in group 1, without statistical significance (P > .05), and higher in group 4 than in group 3, which was statistically significant (P < .05).
DiscussionExposure to radiation for medical purposes is the largest source of radiation for the general population.19 There are many studies published in the scientific literature that present data estimated with dummies and acquired during patient mammography procedures.4,20–22 In our study, we evaluated the radiation dose to the breast, the thyroid gland and the lens using various modalities of mammography, adding the fairly common variable of implants, in addition to situations that arise in daily practice that are not easy to simulate, such as thickness, density and number of projections.
It is known that the radiation dose and scatter radiation during a mammogram increase with breast thickness (Table 1). Despite the existence of breasts up to 10 cm thick, the mean radiation dose of the majority remained below the limits permitted per projection (3 mGy). In the projections that included implants, the parameters controlled with the kVp and mAs manual technique kept the MGD below the value permitted per projection. The exception was in group 3, in which although the average MGD was below 3 mGy, we found some maximum values above the limit, due to the combination of thick and dense breasts. The particular case of a patient with ACR D breast density, together with a breast thickness of 8.7 cm, in whom high MGD values of up to 6.07 mGy were obtained in one of the projections, this being the highest value in her group, exhibiting a thickness of more than 7 cm with ACR D breast density, is worthy of special mention. Similar findings are presented by Baek et al. in a series of patients with a breast thickness of 8.2 cm and MGD of 1.49 mGy and 1.96 mGy in moderately dense breasts and dense breasts, respectively, and with higher maximum values.23
The average breast thickness in groups 1 and 3 was 5.6 cm (max. 10 cm and min. 2.4 cm). Similar results were found by Houben et al., with an average of 5.88 cm.24 For Badr et al., in a group of 104 patients, the average breast thickness was 5.6 cm,25 while for Chetlen et al., the average thickness reported in their publication was 6.2 cm.
In groups 2 and 4, breast thickness was 3.95 cm in the projections without implants and 7.4 cm in the projections with implants, which represents a 1.9-fold increase on average and an average greater thickness of 3.7 cm. In the study by Smathers et al., the average of the projections including implants was 7.7 cm, while in the images without implants it was 3.5 cm, with the implants adding more than 4 cm of thickness.26 Patients with implants have thicker breasts and require a greater number of projections.
For the patients in group 3, significantly higher MGD (P < .05) were recorded than in the group 1 patients; only in the LCC projection was the difference not significant (P > .05). In group 3, the MGD was 1.81 mGy and the average breast thickness was 5.4 cm.
In a study carried out by Svahn et al. reviewing the mean absorbed dose reported in several clinical studies using 3D and 2D mammography, when tomosynthesis is performed in “combo” there is a significantly greater radiation dose to the breast, 2.25 times greater than with bilateral digital mammography. If tomosynthesis is accompanied by the synthetic 2D image, the radiation dose is almost the same as that of 2D mammography.27 James et al. reported a mean glandular dose of 1.3 mGy for 2D mammography and 1.6 mGy for 3D, for a breast thickness of 4.7 cm and 5.7 cm, respectively.22
When comparing groups 2 and 4, we observed that there were no statistically significant differences between them (P > .05). Therefore, in patients with implants, the use of 3D mammography did not lead to a significant increase in the dose compared to 2D mammography.
We then compared the MGD between groups with a different number of projections and the same modality of mammography: group 1 vs group 2; and group 3 vs group 4 (Table 3). A statistically significant increase (P < .05) in MGD was observed in group 2 compared to group 1, and in group 4 compared to group 3.
It is important to note that in the four groups, the median and average MGD remained below the values permitted per projection (3 mGy), as defined by the Food and Drug Administration. However, Table 1 shows cases with an increase in MGD in group 3 patients with dense and thick breasts, and in groups 2 and 4 in which the MGD value of the projections with and without implants was added.
In the study by Smathers et al., the MGD was evaluated in patients with implants, in analogue mammograms, in images with implant inclusion and rejection, as well as the effect of the number of projections. In the cases they studied, they found that a four-view mammogram had a MGD of 3.4 mGy and an eight-view mammogram had a MGD of 9.4 mGy, which was higher than in our study.
It is important to know that the value reflected in each mammogram image can be taken into account to monitor the dose received by the patient. This is being adopted by some countries to control the dose received during radiological studies.
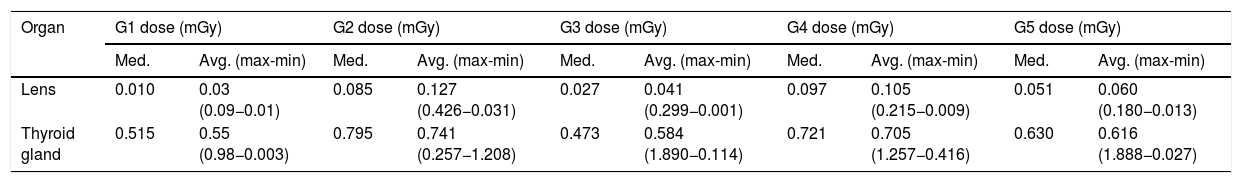
Table 4 shows that the radiation dose to the thyroid gland ranged from 0.55 mGy for group 1, to 0.584 mGy for group 3, and 0.616 mGy for group 5. The groups with the highest doses of radiation to the thyroid gland were group 4 (0.705 mGy) and group 2 (0.741 mGy).
Dose values recorded in the lens and thyroid gland in each group studied.
| Organ | G1 dose (mGy) | G2 dose (mGy) | G3 dose (mGy) | G4 dose (mGy) | G5 dose (mGy) | |||||
|---|---|---|---|---|---|---|---|---|---|---|
| Med. | Avg. (max-min) | Med. | Avg. (max-min) | Med. | Avg. (max-min) | Med. | Avg. (max-min) | Med. | Avg. (max-min) | |
| Lens | 0.010 | 0.03 (0.09−0.01) | 0.085 | 0.127 (0.426−0.031) | 0.027 | 0.041 (0.299−0.001) | 0.097 | 0.105 (0.215−0.009) | 0.051 | 0.060 (0.180−0.013) |
| Thyroid gland | 0.515 | 0.55 (0.98−0.003) | 0.795 | 0.741 (0.257−1.208) | 0.473 | 0.584 (1.890−0.114) | 0.721 | 0.705 (1.257−0.416) | 0.630 | 0.616 (1.888−0.027) |
Avg.: average; G1, G2, G3, G4: groups 1, 2, 3, 4; max: maximum; med: median; mGy: milligrays; min: minimum.
In a 2016 publication, Chetlen et al. reported a dose of 0.24 mGy (0.05−0.82 mGy) in the skin of the right lobe of the thyroid and 0.25 mGy (0.06−0.73 mGy) in the left lobe in patients with four-view bilateral mammography; these mean values are lower than ours.
In an article warning of the risk of radiation-induced thyroid cancer in patients undergoing mammography, Sechopoulos and Hendrick estimated, for a four-view digital mammogram with a MGD of 3.7 mGy and assuming a maximum dose to the thyroid gland of 0.045%, a maximum dose to the thyroid gland of 0.0033 mGy during a digital mammogram.5 These values are very low compared to ours. A study published by Whelan et al. in 91 patients with analogue mammography yielded similar values to ours, reporting a dose to the thyroid of 0.39 ± 0.22 mGy. They found that the dose was higher in the MLO views than in the CC views and estimated the dose to the thyroid gland to be 10% of the dose to the skin.21
In our caseload, as already mentioned, increases in the median dose to the thyroid in excess of 10% versus the groups without implants were recorded in groups 2 and 4. In a previous study conducted by Carrizales Silva et al.,28 in which the authors evaluated the radiation dose entering the lens and thyroid gland in women who had undergone a four-view 2D digital mammogram, they found that the estimated KERMA for lens and thyroid gland was 33.33% and 50% lower, respectively, than the reference breast MGD value of 3 mGy.15,29
In our study, the average radiation doses to the thyroid gland were below the maximum values permitted by national and international organisations. Moreover, the thyroid gland is an organ susceptible to developing cancer after exposure to X-rays in young subjects, which is not the age at which mammography screening is recommended.30
Regarding the dose to the lens, our values were lower than for the thyroid gland. The radiation dose levels were 0.03 mGy in group 1 and 0.127 mGy in group 2, the latter value being even lower than in group 5 (0.06 mGy). Regarding the dose to the “nasal bridge” reported by Chetlen et al., out of a total of 207 patients, a measurable radiation dose was only obtained in 51, with an average of 0.025 mGy (<0.0335 mGy–0.121 mGy), similar values to our group 1.
There are not many publications that study the scatter radiation dose to the lens from a mammogram. A higher radiation dose to the lens is observed if the eye is in the field of study during a head axial tomography or in occupationally exposed personnel during an interventional procedure.18
The dose limit for eye lenses has been decreasing in recent years.31 For 2011, “The commission reviewed and issued new recommendations and estimated that the absorbed dose threshold is 0.5 Gy; and recommends that for occupational exposure in planned exposure situations, the equivalent dose limit for the lens of the eye should be 20 mSv in a year, averaged over defined periods of five years, with exposure not exceeding 50 mSv in any single year.”32
The contribution of mammography to the scatter radiation dose to the lens during the performance of the different modalities of mammography in our study is well below the annual reference dose recommended by the International Commission on Radiological Protection (32).
The patients in group 5 received a higher dose to the lens than the patients in group 3, and these in turn received a higher dose than the patients in group 1. The increased dose was related to the mammography modality used. Furthermore, we observed that the median dose in groups 2 and 4 remained above that recorded for group 5, meaning that the greater number of projections had a significant radiation effect.
Table 4 shows that in all groups, the median dose to the thyroid gland was higher than the median dose to the lens; 51.5, 9.35, 17.52, 7.43 and 12.35 times higher for groups 1, 2, 3, 4 and 5, respectively. These values can be explained by the anatomical structure of the thyroid gland and by the scatter radiation of the mammogram. They are not caused by radiation escaping from the X-ray tube shielding system, nor by the fact that these organs are involved in the radiation field.
An evaluation of the difference in the median doses to the lens reveals an increase of 8.5 times for group 2 versus group 1, and 3.59 times for group 4 versus group 3. With regard to the dose measured in the thyroid gland, an increase of 1.54 times was observed in group 2 versus group 1, and 1.52 times in group 4 versus group 3. Similarly, the median doses of radiation to the lens and the thyroid gland in group 5 were 5.1 and 1.52 times greater, respectively, when compared to those of group 1. The radiation dose for group 2 remains above those recorded for group 5; 1.67 times higher for the lens and 2.26 times higher for the thyroid gland, highlighting the impact of a greater number of projections.
One limitation of the study was that it was carried out with equipment from a single manufacturer. We did not take measurements with ionisation chambers to corroborate the MGD indicated by the mammographer, we used as a reference the regular maintenance verification that the equipment was functioning properly and the evaluation by a medical physicist. To compare the groups, we used the median due to the very heterogeneous number of patients in each group. Another limitation was not being able to recover MGD values for the patients in group 5.
We must emphasise that the experience of the radiology technician and frequent quality control of the equipment are essential to comply with the quality assurance parameters established in the different international standards16 and to achieve radiation doses that are as low as reasonably possible for medical diagnosis.
New studies are required to evaluate the reduction of the radiation dose in patients with implants and with the guarantee that the rate of breast cancer diagnosis will not be reduced, as was proposed by Smathers et al. in 2007.26
ConclusionThe median MGD and radiation dose received by the thyroid gland and lens is within the expected values. In a few exceptions, the MGD was above 3 mGy. In the groups without implants, the MGD in patients with tomosynthesis was significantly higher than in patients with 2D mammography, but the highest MGD was in the implant groups. Radiation to the thyroid gland and lens from a mammogram contributes very little to the equivalent annual dose. Tomosynthesis and 2D mammography with implants give rise to a higher dose to the lens than contrast-enhanced mammography and is higher than 3D and 2D mammography. Radiation to the thyroid gland in the 2D and 3D mammography implant groups was greater than contrast-enhanced mammography, 2D mammography and tomosynthesis.
Authorship- 1
Responsible for the integrity of the study: JPF.
- 2
Study conception: JPF.
- 3
Study design: JPF.
- 4
Data collection: JPF, AFM, SB, VR.
- 5
Data analysis and interpretation: JPF, VR, CS.
- 6
Statistical processing: Laura Aguirre.
- 7
Literature search: JPF.
- 8
Drafting of the manuscript: JPF, AG.
- 9
Critical review of the manuscript with intellectually relevant contributions: JPF, AG.
- 10
Approval of the final version: JPF, AG, CS.
The authors declare that they have no conflicts of interest.
Please cite this article as: Pérez Fuentes JA, Roldán Sánchez VS, Gordillo Ledesma AK, Mena AF, Brito S, Soteldo C. Dosis glandular promedio en glándula mamaria y dosis de radiación en glándula tiroides y cristalino en mujeres con y sin implantes mamarios durante diferentes modalidades mamográficas. Radiología. 2022;64:11–19.

