


Perfusion MRI makes it possible to evaluate the cerebral microvasculature through changes in signal due to a tracer passing through blood vessels. The most commonly used technique is based on the magnetic susceptibility of gadolinium in T2*-weighted sequences, and the most commonly evaluated parameters are cerebral blood volume, cerebral blood flow, and mean transit time. Diverse technical aspects, like the sequence used, and the dose and speed of contrast material injection, must be taken into account in perfusion MRI studies. It is also essential to consider possible sources of error like contrast material leaks due to changes in the permeability of the blood–brain barrier. The most widely used clinical applications of perfusion MRI include the determination of the degree of aggressiveness of gliomas, the differentiation of some histological types of tumors or pseudotumors, and the evaluation of the penumbral area in acute ischemia.
Las técnicas de perfusión por RM (PRM) permiten la valoración de la microvasculatura cerebral mediante los cambios de señal debidos al paso intravascular de un trazador. La técnica más empleada se basa en la susceptibilidad magnética del gadolinio en secuencias T2* y los parámetros más comúnmente valorados son: el volumen sanguíneo cerebral, el flujo sanguíneo cerebral y el tiempo de tránsito medio. En los estudios de PRM deben considerarse diversos aspectos técnicos como la secuencia empleada, la dosis o la velocidad de inyección del contraste. También debe valorarse la existencia de fuentes de error como las debidas a la fuga de contraste por alteración en la permeabilidad de la barrera hematoencefálica. Las aplicaciones clínicas más extendidas de la PRM incluyen la determinación del grado de agresividad de gliomas, la diferenciación de algunos tipos histológicos tumorales o de lesiones pseudotumorales y la valoración del área de penumbra en la isquemia aguda.
Strictly, cerebral perfusion is defined as the steady-state delivery of nutrients and oxygen via blood per unit volume or mass and is typically measured in milliliters per 100g of tissue per minute.1 However, in perfusion MR (PMR) imaging, the term has broadened1 to include multiple tissue microcirculatory parameters, such as cerebral blood volume (CBV), cerebral blood flow (CBF), mean transit time (MTT), time to peak (TTP), and maximum time (Tmax).
Technical considerationsModalities of perfusion MR imaging. T2*-weighted dynamic magnetic susceptibility imagingThe three main techniques used to perform PMR imaging are T2*-weighted dynamic magnetic susceptibility, T1-weighted dynamic perfusion, and arterial spin labeling.2 All three techniques are based on the signal changes that accompany the passage of a tracer through the cerebrovascular system.1 This tracer can be endogenous (water) or exogenous (gadolinium chelates).
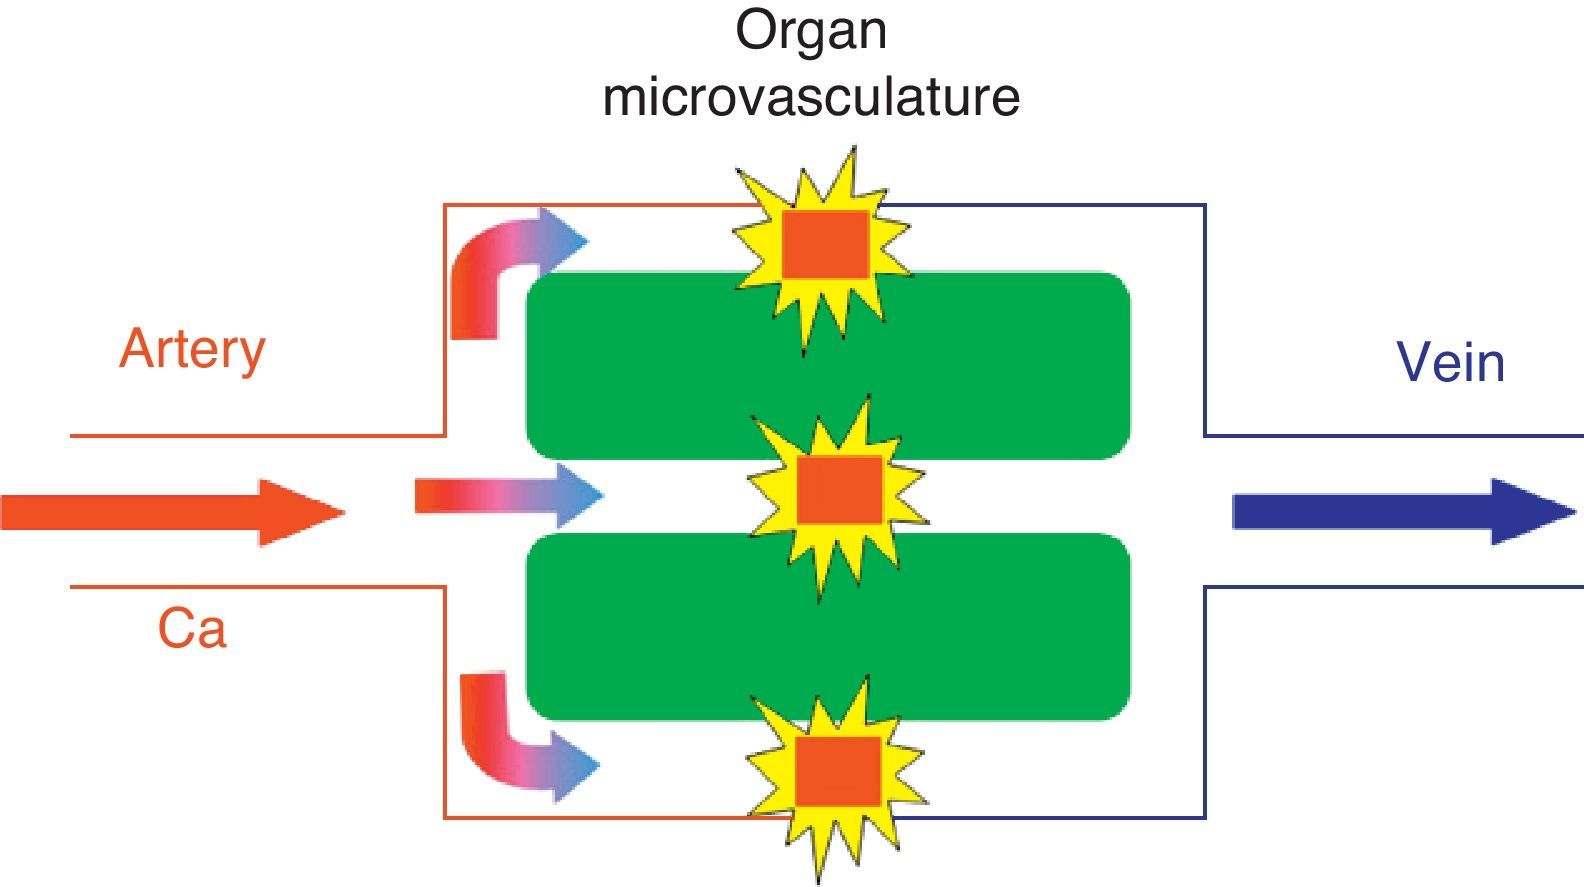
The most commonly used technique is T2*-weighted dynamic magnetic susceptibility, which relies on the paramagnetic property of gadolinium contrast agents when they pass through the cerebrovascular system leading to a T2 signal drop, and mainly T2*, due to the differences in local magnetic susceptibility (Fig. 1).1,3
 reaches the cerebral parenchyma at a concentration described by the arterial inflow function Ca(t) and diffuses through the microvasculature. The paramagnetic agent in the vessels produces local magnetic fields in the surrounding tissue that results in dephasing of water molecules and signal loss on T2*-weighted sequences. This model assumes that no contrast agent leakage occurs.")
In the kinetic model for T2* magnetic susceptibility imaging, the tracer (gadolinium-based contrast) reaches the cerebral parenchyma at a concentration described by the arterial inflow function Ca(t) and diffuses through the microvasculature. The paramagnetic agent in the vessels produces local magnetic fields in the surrounding tissue that results in dephasing of water molecules and signal loss on T2*-weighted sequences. This model assumes that no contrast agent leakage occurs.
Intravenous gadolinium chelate is a nondiffusible tracer from the vascular bed to the cerebral parenchyma.1 This confinement to the vascular space leads to the dominant effect of magnetic susceptibility. Therefore, the paramagnetic agent acts as a series of magnetic cylinders that influence the surrounding tissue altering the local magnetic fields.4 If the magnetic field is perfectly homogeneous, all water molecules precess at the same frequency; nonetheless, when the paramagnetic gadolinium agent alters the magnetic field, water molecules of the surrounding tissue precess at different frequencies.4
Research has shown a linear relationship between contrast agent concentration and T2 signal rate change.3 Thus, contrast agent concentration is proportional to the changes in the relaxation rate [ΔR2*], according to the equation ΔR2* (t)={−ln[S(t)/S0]}/TE}, where S(t) is the signal intensity in a given t time, S0 is the precontrast signal intensity, TE is echo time, and ΔR2* represents the changes in relaxation rate, which is assumed to be proportional to tissue contrast agent concentration,1 provided that there is no contrast agent recirculation or leakage.4 Therefore, a tissue contrast concentration–time curve can be derived from the shortening of T2* during the passage of the bolus of gadolinium, allowing estimates of the different parameters.
Sequences used in T2*-weighted dynamic magnetic susceptibility imagingThe sequences should have an appropriate temporal resolution, so that images of a dynamic series are acquired at approximately one-second intervals.1 Longer intervals provide less accurate measurements of the signal intensity–time curve. For this reason, most studies use echo planar imaging (EPI), capable of generating approximately 10 MR images every second, making it ideal for rapid dynamic imaging.1
The use of gradient echo (GE) or spin echo (SE) sequences for acquisition of perfusion data will depend on many factors such as the signal-to-noise ratio, contrast agent dose or size of the vessels to be evaluated.5 GE sequences provide a better signal-to-noise ratio, higher signal changes as a function of contrast agent concentration, and a linear behavior at large concentrations.5 These sequences provide information from all sizes of vessels, but they are more sensitive to macrovessels. Therefore, signal changes increase as vessel size increase, until they reach a plateau and remain independent of vessel size for sizes >3–4μm.6
On the other hand, SE sequences are particularly sensitive for the evaluation of small vessels, at capillary level, with the signal changes peaking for vessels of 1–2μm.6 Some studies have suggested that GE sequences are superior to SE sequences in the evaluation of brain tumors using perfusion MR imaging.6,7 Sugahara et al.6 showed that for high-grade gliomas the maximum relative CBV (rCBV) ratios obtained with GE-EPI were higher that those acquired with SE-EPI. In this respect, most published studies used T2*-weighted GE imaging for the determination of the preoperative grade of brain tumors.8–15
Another consideration is the type of contrast agent used. Because of their properties, the currently available gadolinium-based contrast agents are especially suited for perfusion MR studies. Compared with conventional 0.5mol/L formulations, 1.0mol/L gadobutrol (Gd-BT-DO3A; Gadovist® Bayer-Schering AG, Berlin, Germany) has a two times higher concentration of gadolinium, allowing the administration of the same amount of gadolinium with a lower volume of bolus. This facilitates more appropriate bolus geometry, with sharper bolus peak and an increased first-pass gadolinium concentration in blood.16 Gadobenate dimeglumine (Gd-BOPTA; MultiHance®; Bracco Imaging SpA, Milan, Italy) is another contrast agent especially useful for PMR imaging. This agent has a two-fold higher T1 and T2 relaxivity values in blood due to a weak and transient interaction of Gd-BOPTA with serum proteins.17 Standard doses of gadobenate dimeglumine and gadobutrol provide similar signal reduction (approximately 30%), but substantially higher than the signal drop obtained with conventional contrast agents.17 Both gadobenate dimeglumine and gadobutrol allow for the acquisition of high-quality perfusion maps for CBV and CBF quantification, without significant differences between them.17
Although some studies have used doses ≥0.3mmol/kg of gadobutrol for PMR imaging,16 Essig et al.17 demonstrated that 0.2mmol/kg doses of both agents produce better image quality but with no clinical benefit over the use of 0.1mmol/kg doses.
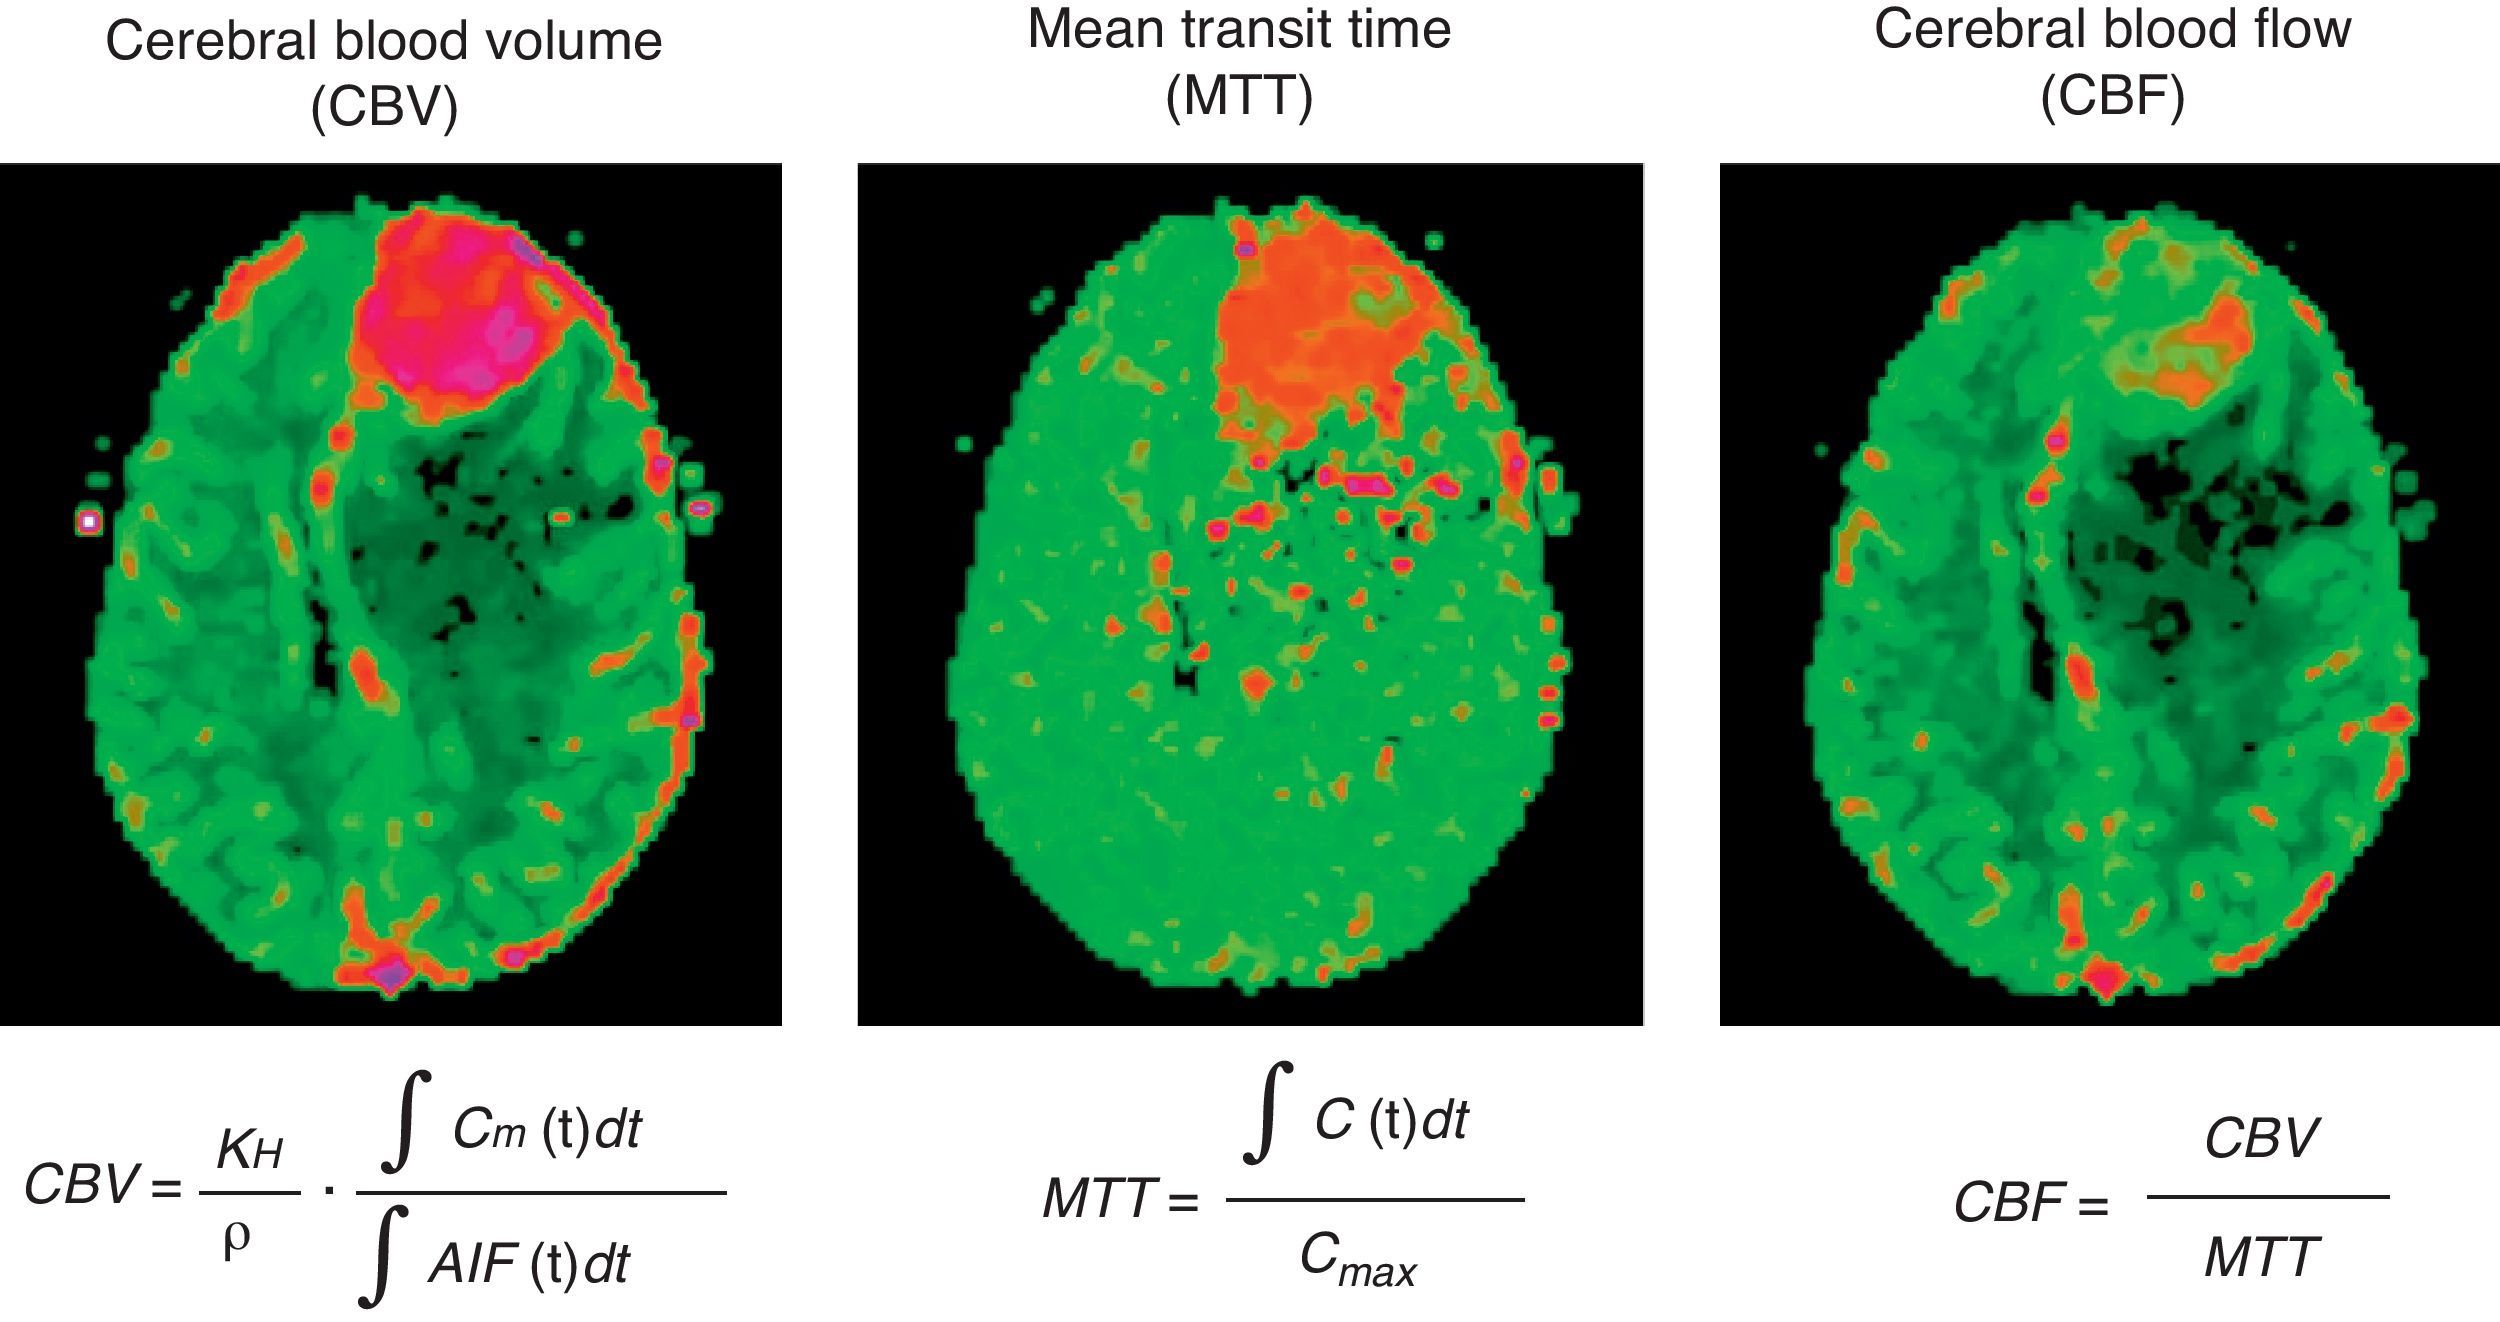
Parameters estimated using perfusion magnetic resonance: CBV, CBF, MTT, TTP and TmaxCBV is defined as the total volume of blood traversing a given region of brain, measured in milliliters of blood per 100 grams of brain tissue (ml/100g).2 CBF is defined as the volume of blood traversing a given region of brain per unit time, measured in milliliters of blood per 100 grams of brain tissue per minute (ml/100g/min).2 MTT is the average time that blood takes to pass from arterial inflow to venous outflow, measured in seconds.2 The parameters correlate according to the equation MTT=CBV/CBF (Fig. 2).
, mean transit time (MTT), cerebral blood flow (CBF) from the convolution of the arterial input function (AIF). Values for each parameter are absolute and color scale is adjusted to these results (higher values in red and lower values in green). (For interpretation of the references to color in this figure legend, the reader is referred to the web version of the article.)")
Example of acquisition of parametric color maps of cerebral blood volume (CBV), mean transit time (MTT), cerebral blood flow (CBF) from the convolution of the arterial input function (AIF). Values for each parameter are absolute and color scale is adjusted to these results (higher values in red and lower values in green). (For interpretation of the references to color in this figure legend, the reader is referred to the web version of the article.)
Calculation of CBF and MTT requires knowledge of the arterial input function (AIF) (Fig. 3). This function represents the concentration of contrast agent in the arterial inflow that supplies a given tissue, as a function of time.4 Hence, knowing the AIF, a convolution algorithm is used to create CBF and MTT cerebral maps.2 As for CBV, the estimates can be simplified using the rCBV value, obtained by calculating the area under the concentration–time curve computed on a voxel-by-voxel basis from the intensity–time curve.2,5 Since rCBV is a “relative” measurement, the AIF is not used in its calculation.2,4,5 Nonetheless, quantitation of rCBV is less precise because some of the factors that vary between patients (e.g., the underlying vascular architecture), physiologic factors (e.g., cardiac output) or aspects related to the acquisition of MR images (e.g., contrast injection conditions) are obviated.5
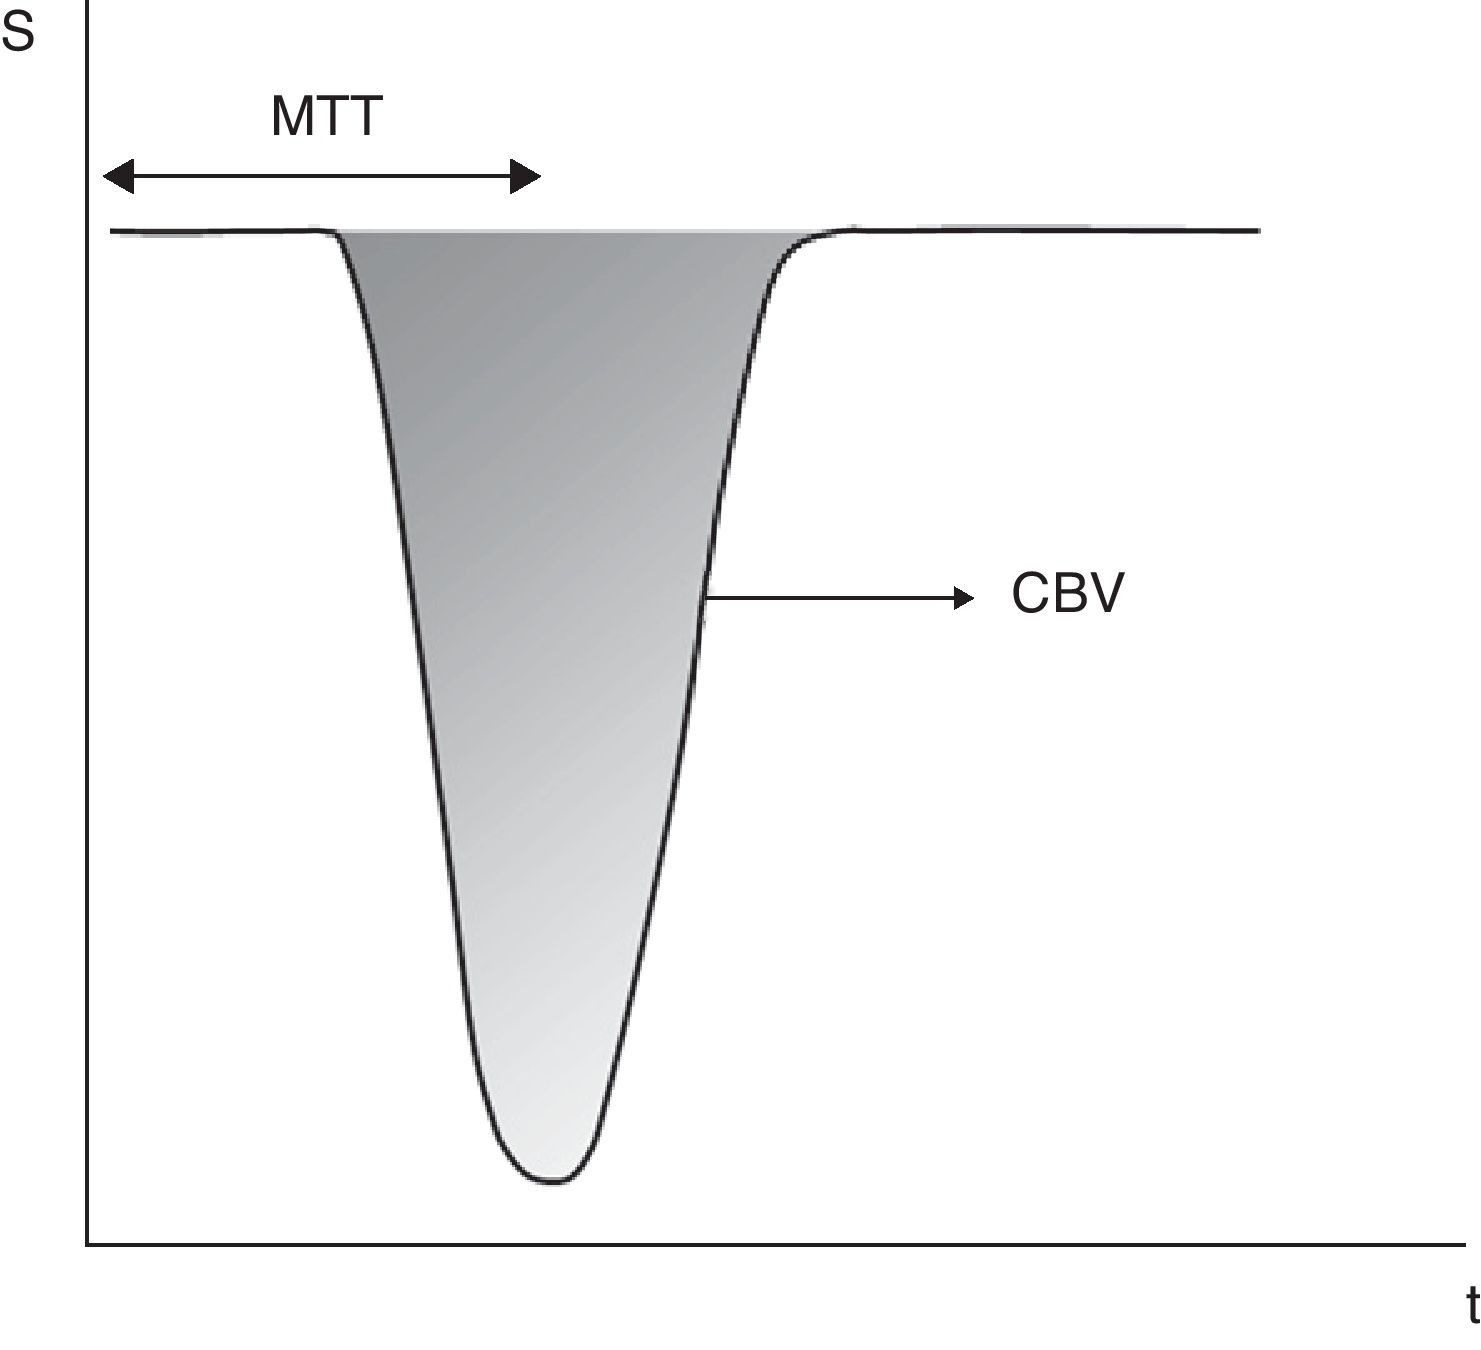
–time (t) curve in dynamic T2*-weighted images. The area under the curve represents the cerebral blood flow (CBV). Mean transit time (MTT) is the time elapsed from the injection of the tracer to the time the half-width of the curve is reached. Cerebral blood flow (CBF) is calculated dividing CBV by MTT. Using this method, the calculation of the arterial input function is not required, but the obtained values are relative to a reference area.")
Calculation of perfusion parameters from the signal drop (S)–time (t) curve in dynamic T2*-weighted images. The area under the curve represents the cerebral blood flow (CBV). Mean transit time (MTT) is the time elapsed from the injection of the tracer to the time the half-width of the curve is reached. Cerebral blood flow (CBF) is calculated dividing CBV by MTT. Using this method, the calculation of the arterial input function is not required, but the obtained values are relative to a reference area.
In order to simplify comparison between patients, rCBV values are normalized to the contralateral tissue,2,8 usually the white matter of the uninvolved contralateral region.3,6,8,13,18–23 Other authors use as standard reference a contralateral homologous region.1,24 The use of gray matter as standard reference is unusual.15
Although CBV maps are good indicators of hypervascular regions, values calculated on a pixel-by-pixel basis have a poor signal-to-noise ratio. It is therefore preferable to calculate CBV values from region of interests (ROI) within the regions with maximum CBV value.1
TTP is the time between the tracer injection and the maximum signal change. TTP can be derived from the signal–time curve with magnetic susceptibility imaging without knowledge of the AIF.25Tmax is an estimation of TTP after a deconvolution with the AIF.26
Pitfalls and artifactsEven using an optimal PMR imaging protocol, there might be potential confusing factors in the interpretation of perfusion maps. An important source of errors is a low cardiac output or a low contrast injection rate.5 In these cases, the insufficient contrast agent concentration does not induce the signal change required to produce the appropriate perfusion maps.
When assessing contrast injection rate, it should be considered that rates <3ml/s lead to underestimation of CBV, while rates >5ml/s show no benefits for CBV determination.27 Most published articles use injection rates between 3 and 5ml/s,6,8,11,12,14,23,24,28–32 with 6ml/s being limit of the injection rate.9,20,33
Another potential artifact arises as a result of blood–brain barrier (BBB) breakdown. T2*-weighted PMR imaging assumes that contrast agent remains intravascular, but once this assumption is not valid, the linear relationship is not assumed between contrast agent concentration and signal drop.5
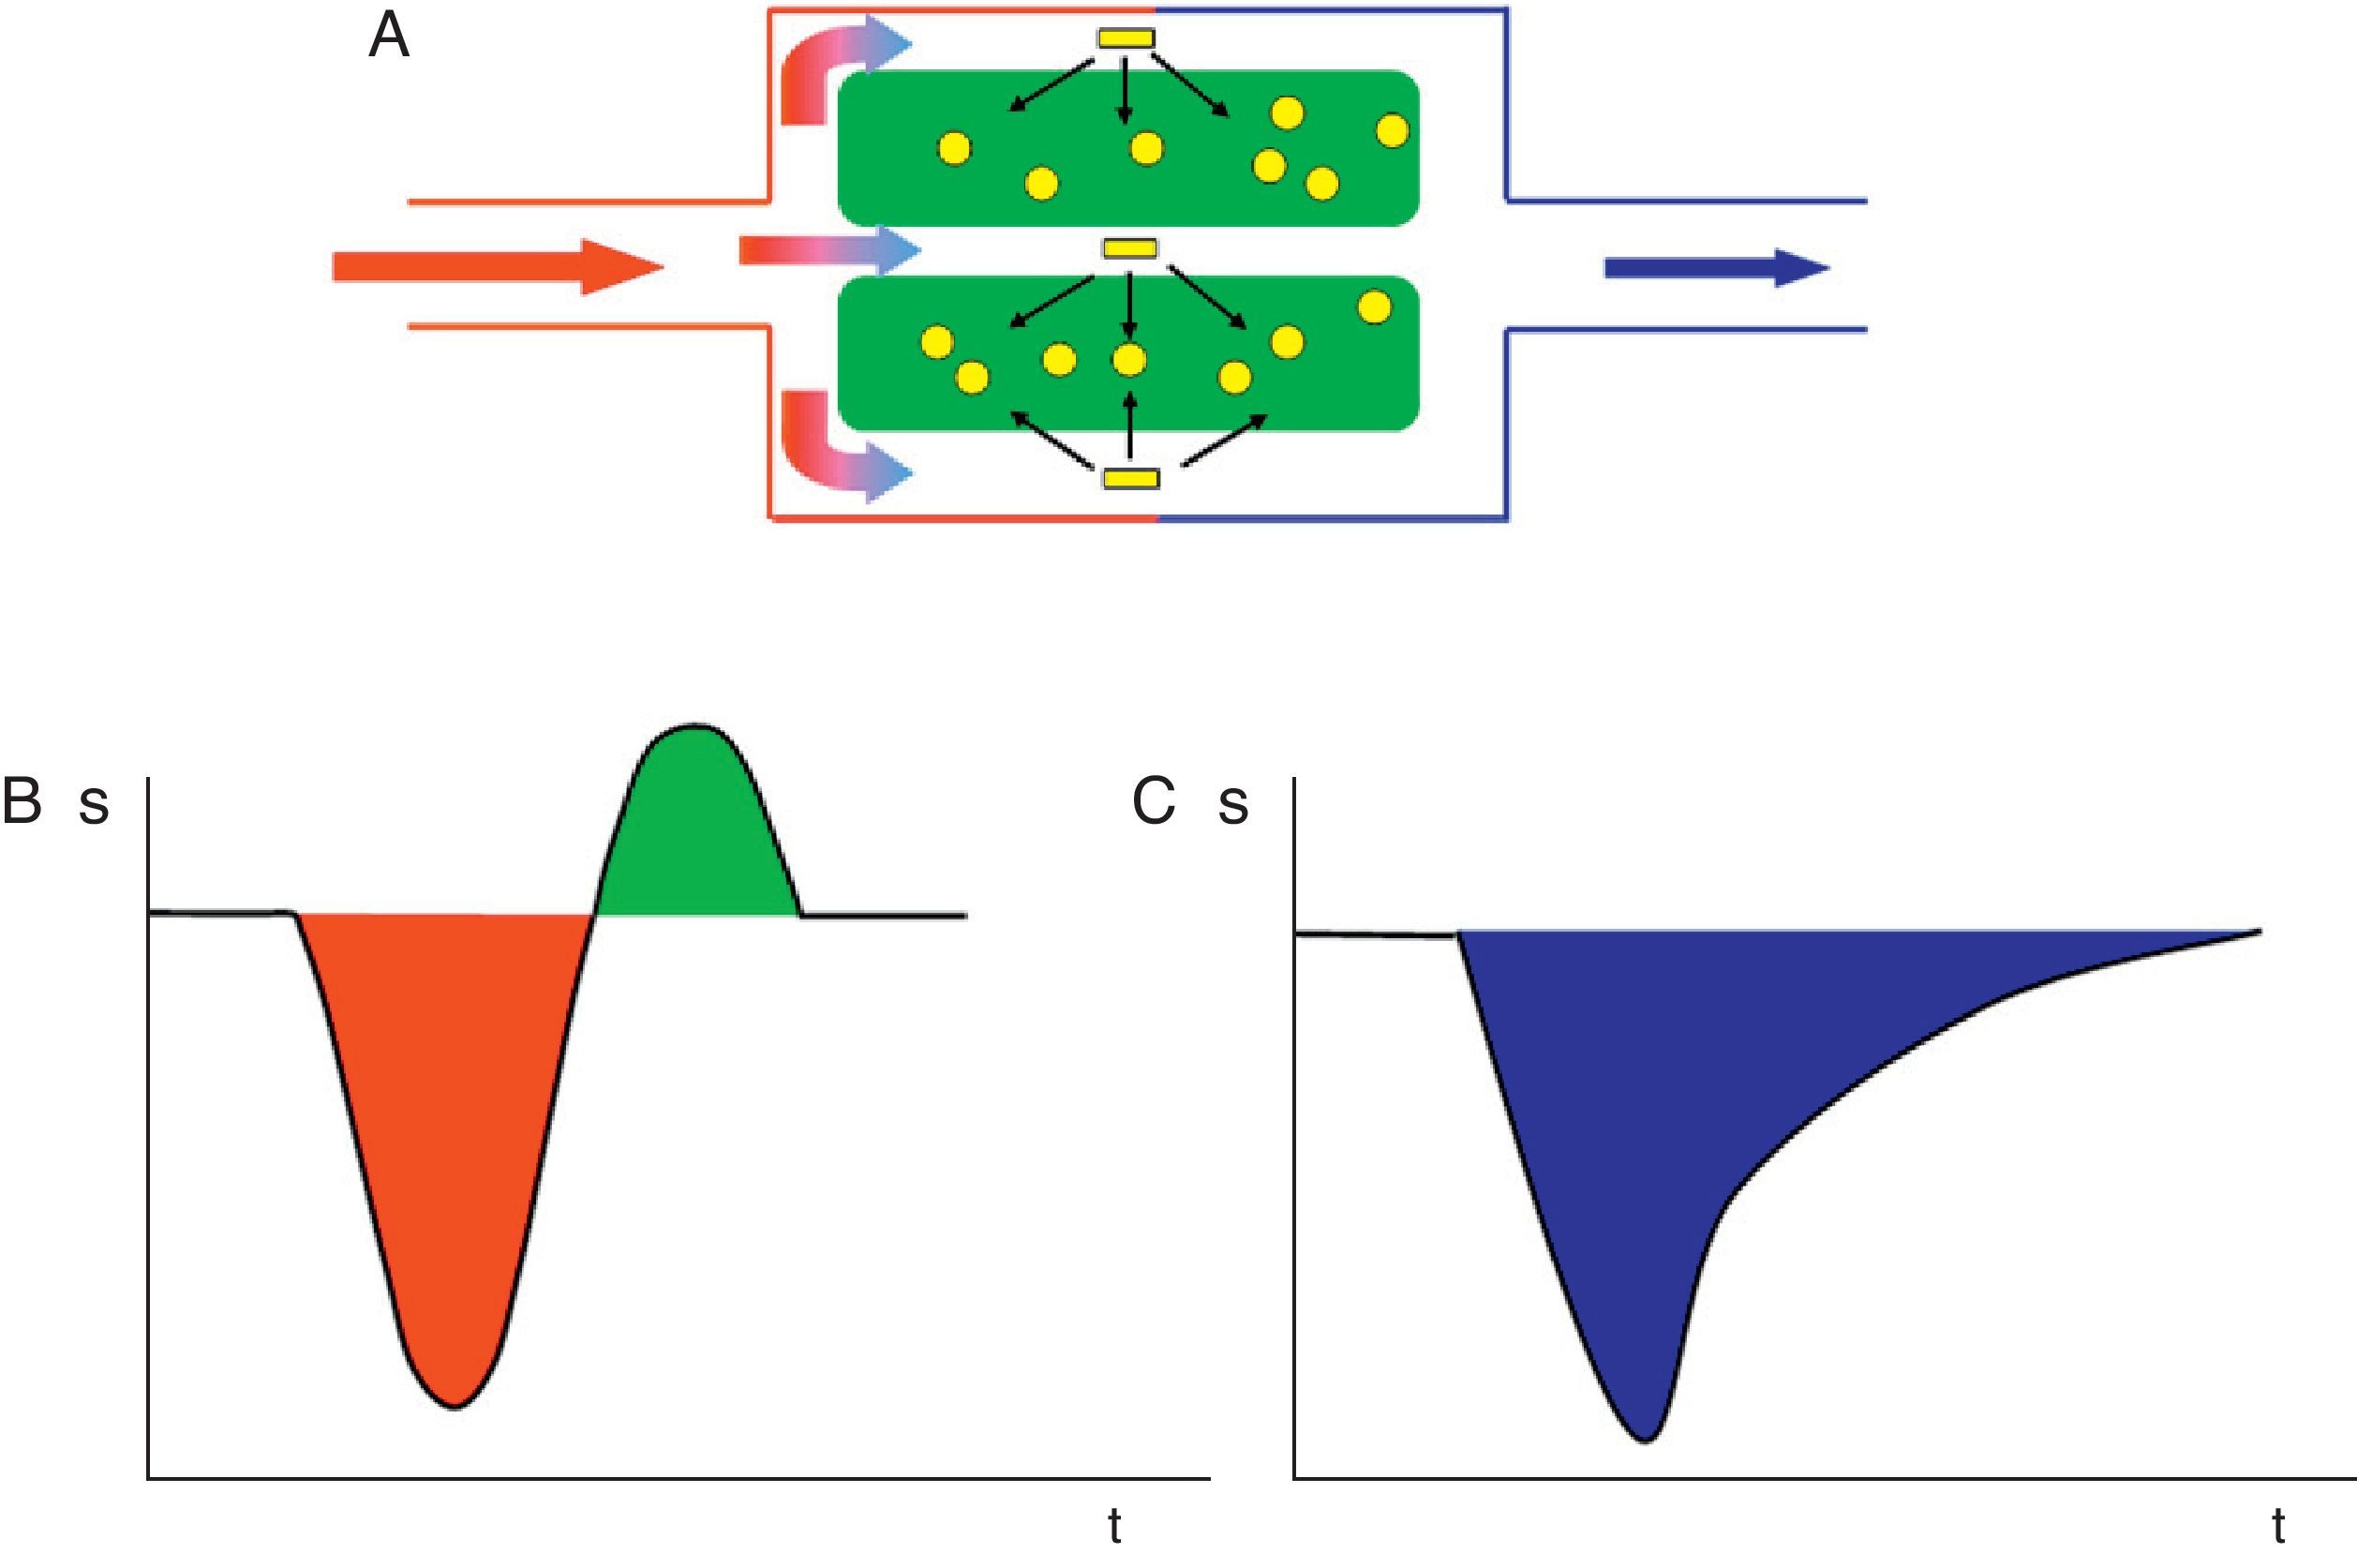
In addition, in cases of increased BBB permeability, the leakage effect appears on both T1 and T2 or T2* as a source of error for perfusion parameter calculations34 (Fig. 4). T1 leakage effect is due to the fact that gadolinium-based contrast agents have T1 effect in addition to the T2* effect. This unwanted T1 effect is caused by extravasated contrast material and is identified as a rise in signal intensity above baseline after the initial drop33 (Fig. 5). The area above the baseline is interpreted by the algorithm as negative blood volume, which is subtracted from the area below the baseline caused by the T2* signal,2 resulting in underestimation of CBV.2,5,33
 Conditions with increased blood–brain barrier permeability lead to contrast passage from microvasculature to interstitium. (B) This may lead to T1 leakage effect that translates into a rise in signal intensity (S) after a signal drop. (C) There might also be T2 leakage effect that results in an additional signal drop, subsequent to the one caused by the arrival of the bolus of contrast to the cerebral parenchyma, resulting in an overestimation of cerebral blood volume.")
(A) Conditions with increased blood–brain barrier permeability lead to contrast passage from microvasculature to interstitium. (B) This may lead to T1 leakage effect that translates into a rise in signal intensity (S) after a signal drop. (C) There might also be T2 leakage effect that results in an additional signal drop, subsequent to the one caused by the arrival of the bolus of contrast to the cerebral parenchyma, resulting in an overestimation of cerebral blood volume.
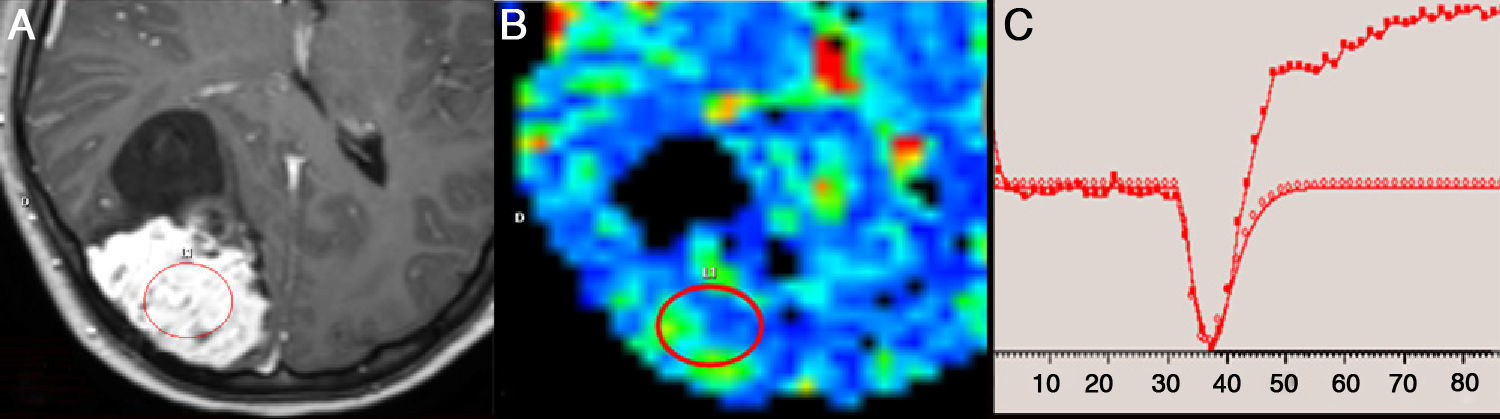
 imaging study due to magnetic susceptibility of the contrast agent. (A) Axial gadolinium-enhanced T1-weighted MR image shows a right parietal meningioma with hyperintense solid component. (B) Moderate increase of cerebral blood volume observed in the parametric color map. (C) Perfusion curve shows a rise in signal intensity above baseline after the initial drop, caused by T1 effect secondary to extravasation of gadolinium into the interstitium. (For interpretation of the references to color in this figure legend, the reader is referred to the web version of the article.)")
An example of T1 leakage effect in perfusion magnetic resonance (MR) imaging study due to magnetic susceptibility of the contrast agent. (A) Axial gadolinium-enhanced T1-weighted MR image shows a right parietal meningioma with hyperintense solid component. (B) Moderate increase of cerebral blood volume observed in the parametric color map. (C) Perfusion curve shows a rise in signal intensity above baseline after the initial drop, caused by T1 effect secondary to extravasation of gadolinium into the interstitium. (For interpretation of the references to color in this figure legend, the reader is referred to the web version of the article.)
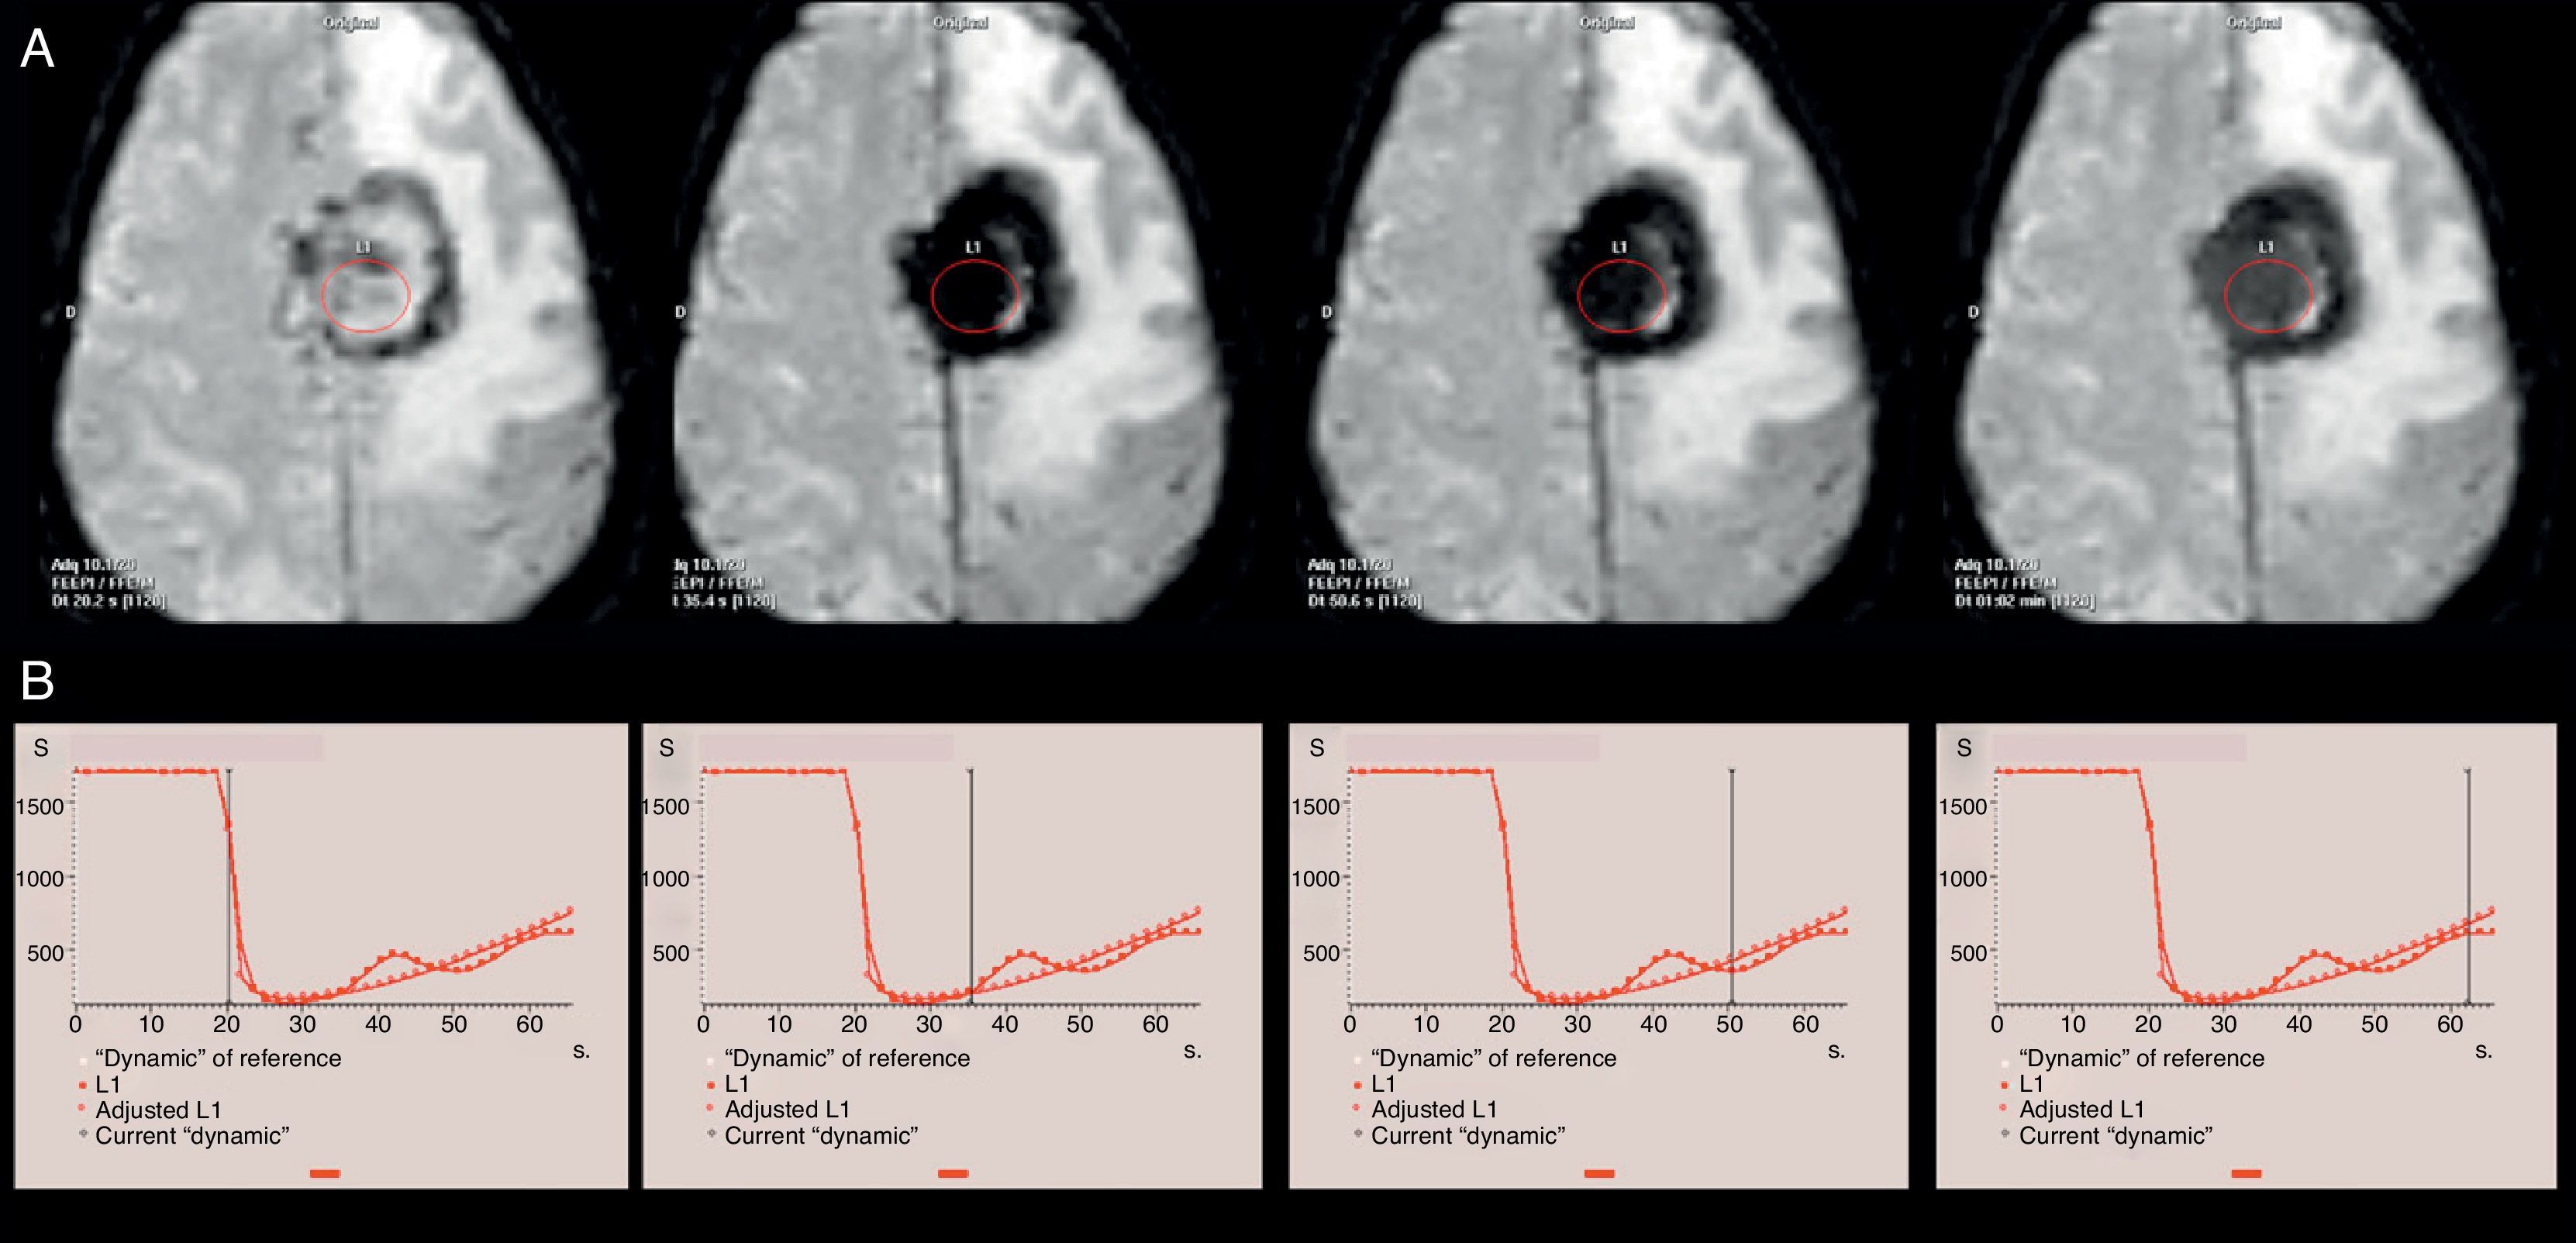
In case of T2 leakage, there will be an additional signal drop, subsequent to the one caused by the arrival of the bolus of contrast to the cerebral parenchyma (Fig. 6), resulting in an overestimation of CBV.34
 imaging study due to magnetic susceptibility of the contrast agent in a patient diagnosed with left frontal parasagittal meningioma. (A) Axial EPI T2*-weighted perfusion images represent the same axial plane in consecutive dynamic images. (B) Perfusion curves with the indicator of the corresponding dynamic image. Due to the T2 effect, a continuation of the signal drop is identified in the neoplasm after the first pass of contrast agent through the cerebral microvasculature. On EPI T2*-weighted images, this effect translates into a marked tumor hypointensity on all dynamic images obtained after contrast agent arrival.")
An example of T2 leakage effect in perfusion magnetic resonance (MR) imaging study due to magnetic susceptibility of the contrast agent in a patient diagnosed with left frontal parasagittal meningioma. (A) Axial EPI T2*-weighted perfusion images represent the same axial plane in consecutive dynamic images. (B) Perfusion curves with the indicator of the corresponding dynamic image. Due to the T2 effect, a continuation of the signal drop is identified in the neoplasm after the first pass of contrast agent through the cerebral microvasculature. On EPI T2*-weighted images, this effect translates into a marked tumor hypointensity on all dynamic images obtained after contrast agent arrival.
Techniques of gamma-variate fitting only minimize this unwanted T1 or T2 effect.33 Several methods have therefore been proposed to minimize these sources of errors.34 One approach, which would avoid T1 leakage effect, is to use dysprosium-based contrast agents, which have stronger T2* effect but negligible T1 effect.2,35 Nonetheless, this type of contrast is not easily available.
The use of contrast with double concentration, such as 1.0mol/L gadobutrol, allows lower injection volume compared to standard 0.5mol/L concentrations. This will in turn reduce the volume of extravasated contrast material secondary to altered BBB permeability.
Another approach to minimize this source of errors is to increase the repetition time (RT), which reduces T1 effects. However, such approach leads to increased scan times and lower temporal resolution if parameters such as the number of dynamic series or the number of sections in each series are maintained.2 The use of a small flip angle also reduces T1 effect, but it also reduces the signal-to-noise ratio of the PMR Image 34. Another approach is to preinject a small dose of gadolinium (0.25–0.05mmol/kg) 5–10min before the intravenous administration of the bolus to presaturate the interstitium and elevate the baseline before the dynamic acquisition.2,5 Although this method is very useful to reduce T1 leakage effects,34 it may be impractical in real clinical practice.2 An interesting alternative is the acquisition of dynamic T1 susceptibility MR images prior to T2* susceptibility MR imaging. In this way, T1 effect can be minimized and, at the same time, an estimation of BBB permeability can be obtained (with dynamic T1 imaging) as well as of the rest of perfusion parameters calculated using dynamic T2* Images.36
Other alternative is to correct the T1 effect using different mathematical models or postprocessing methods.2,5,33–35
One of the problems with the quantification of perfusion parameters is the lack of standardized acquisition and postprocessing of data.34 This section includes the use of different deconvolution algorithms used with conventional software programs provided by various manufacturers,37 which hinders the comparison of intra- and intersubject data.
Moreover, an essential aspect in the calculation of absolute values for CBF is the determination of a vascular structure appropriate for the evaluation of AIF. In order to prevent partial volume effects, the most appropriate is a large cerebral vessel oriented parallel to the main magnetic field.5 Stenotic or occluded vessels should be avoided.
Parametric color maps, usually used for visual analysis and ROI placement, are not very accurate, increasing the sampling error inherent to this type of analysis.38 In addition, their assessment depends on factors such as window level and window width or the color scale used.
Lastly, magnetic susceptibility PMR imaging requires gadolinium administration, with the associated risk of nephrogenic systemic fibrosis in patients with impaired renal function. This complication seems to be less predictable with cyclic chelates than with linear chelates because the latter have less kinetic stability, and release of free gadolinium from the chelate is thus more likely.39
Clinical applications of perfusion magnetic resonance imagingTumor application. General characteristicsThe basic principle of PMR in oncologic imaging is that as a tumor grows its metabolic demands increase due to rapid cell growth and increased cell turnover.2 Angiogenic activity is stimulated by hypoxia and hypoglycemia through cytokine production.40 As a result, these tumors show a higher proportion of immature vessels and, therefore, an abnormally increased permeability.36 This neoangiogenesis can be quantified by PMR imaging.
Nonetheless, increased tumor vascularization does not necessarily indicate malignancy, the main exception being extraaxial tumors (choroid plexus papillomas, neurinomas or meningiomas).1,2,36,41 Hemangioblastoma is an example of benign intraaxial lesion with increased vascularity and increased CBV values,41 despite being classed as World Health Organization (WHO) grade I lesions. This is due to the histological features of hemangioblastomas that include the presence of numerous capillaries.42,43
It is worth noting that areas with increased perfusion do not necessarily correlate with contrast enhanced areas on T1-weighted Images 1, 3, and 8. Enhancement areas on T1-weighted sequences are indicative of altered BBB permeability.
Glioma gradingGrading of brain tumors has great significance because, in most cases, high-grade tumors (WHO grade III and IV and metastases) are usually treated with adjuvant chemo- or radiotherapy after surgery, whereas in low-grade tumors (grade I and II) the use of adjuvant therapy after resection is controversial.44,45 Tumor grade is also associated with disease outcome because survival time is significantly lower in high-grade tumors.46–49
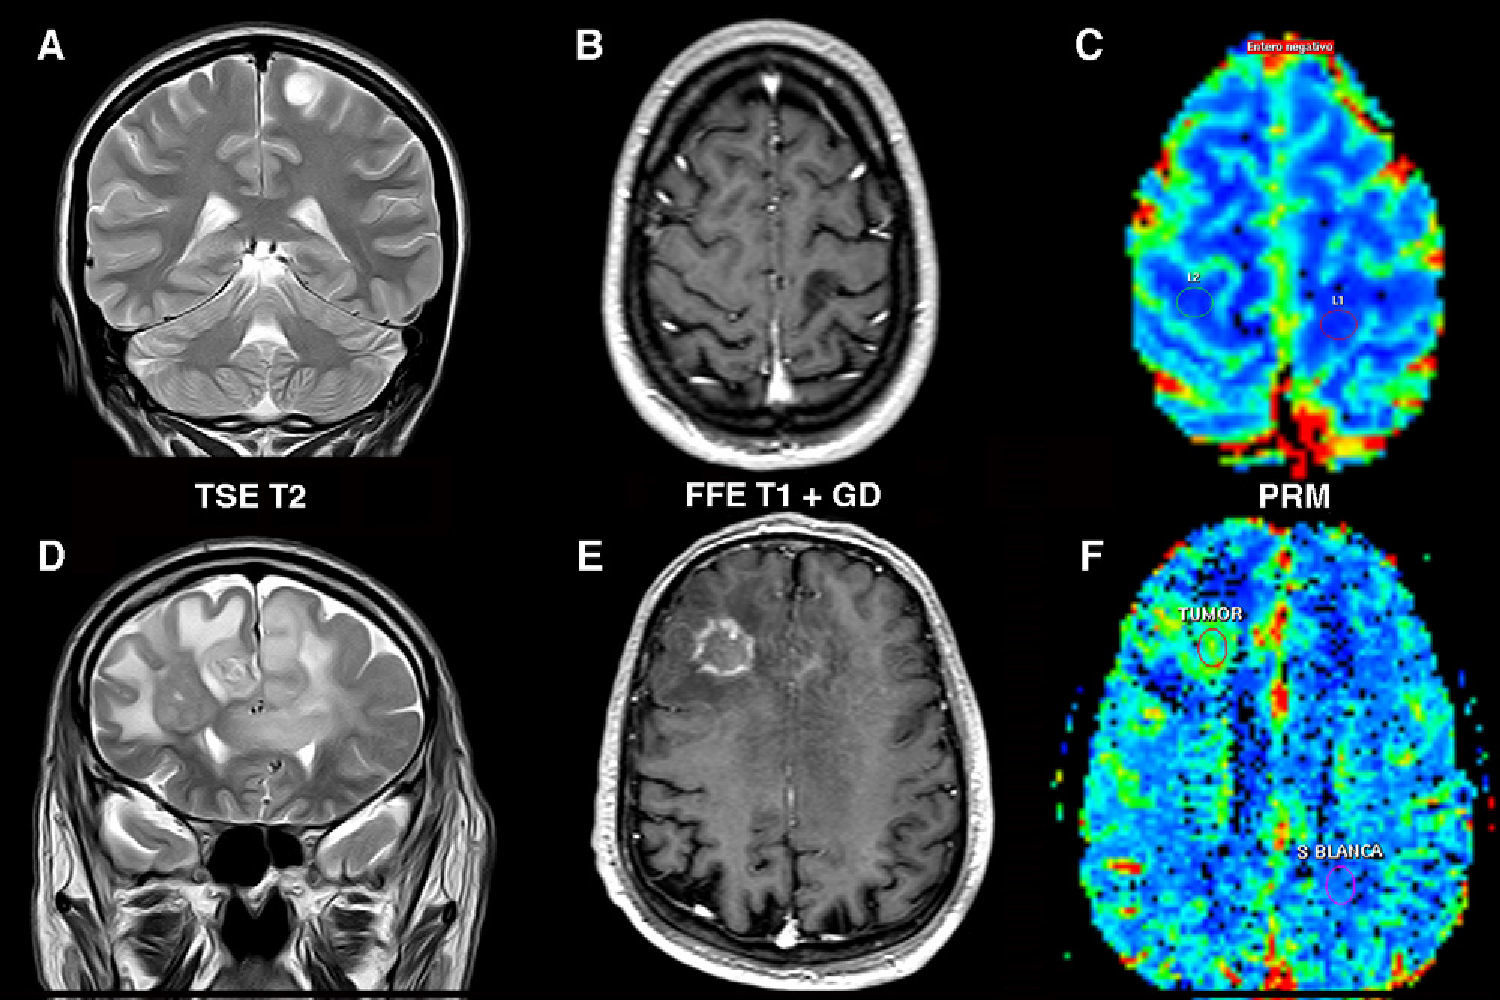
Most published articles on tumor grade determination refer to gliomas. CBV values are significantly higher in high-grade tumors (Fig. 7). For rCBV cutoff values between 1.16 and 3.9, the sensitivity and specificity for tumor grading were 100–72.5% and 96.8–55%, respectively.9,11,18,23,24,28,31,50,51
 in left postcentral gyrus. (A) Tumor appears hyperintense on the T2-weighted sequence with no edema or necrosis. (B) There is no enhancement on the T1-weighted sequence after gadolinium administration. (C) Parametric color map shows cerebral blood volume values similar to those of the contralateral white matter. Bilateral high-grade astrocytoma (D–F) in the frontal lobe with transcallosal involvement. (D) Coronal T2-weighted image shows signs of highly aggressive tumor (edema, necrosis and heterogeneity). (E) T1-weighted sequence shows areas of ring enhancement after contrast administration. (F) Volumetric map shows a rise in cerebral blood volume within the area of enhancement. (For interpretation of the references to color in this figure legend, the reader is referred to the web version of the article.)")
Determination of the degree of aggressiveness of gliomas. Low-grade astrocytoma (A–C) in left postcentral gyrus. (A) Tumor appears hyperintense on the T2-weighted sequence with no edema or necrosis. (B) There is no enhancement on the T1-weighted sequence after gadolinium administration. (C) Parametric color map shows cerebral blood volume values similar to those of the contralateral white matter. Bilateral high-grade astrocytoma (D–F) in the frontal lobe with transcallosal involvement. (D) Coronal T2-weighted image shows signs of highly aggressive tumor (edema, necrosis and heterogeneity). (E) T1-weighted sequence shows areas of ring enhancement after contrast administration. (F) Volumetric map shows a rise in cerebral blood volume within the area of enhancement. (For interpretation of the references to color in this figure legend, the reader is referred to the web version of the article.)
Oligodendrogliomas represent a special case because they have high CBV values regardless their degree of aggressiveness, so that a portion of low-grade oligodendrogliomas show increased CBV values, higher than low-grade diffuse astrocytomas.10,28,44,52 This is due to the dense network of capillaries found in oligodendrogliomas, even in low-grade ones.44,53
Differentiation of tumor histological typeCerebral perfusion findings may provide useful information for the differentiation of certain histological types of tumors.
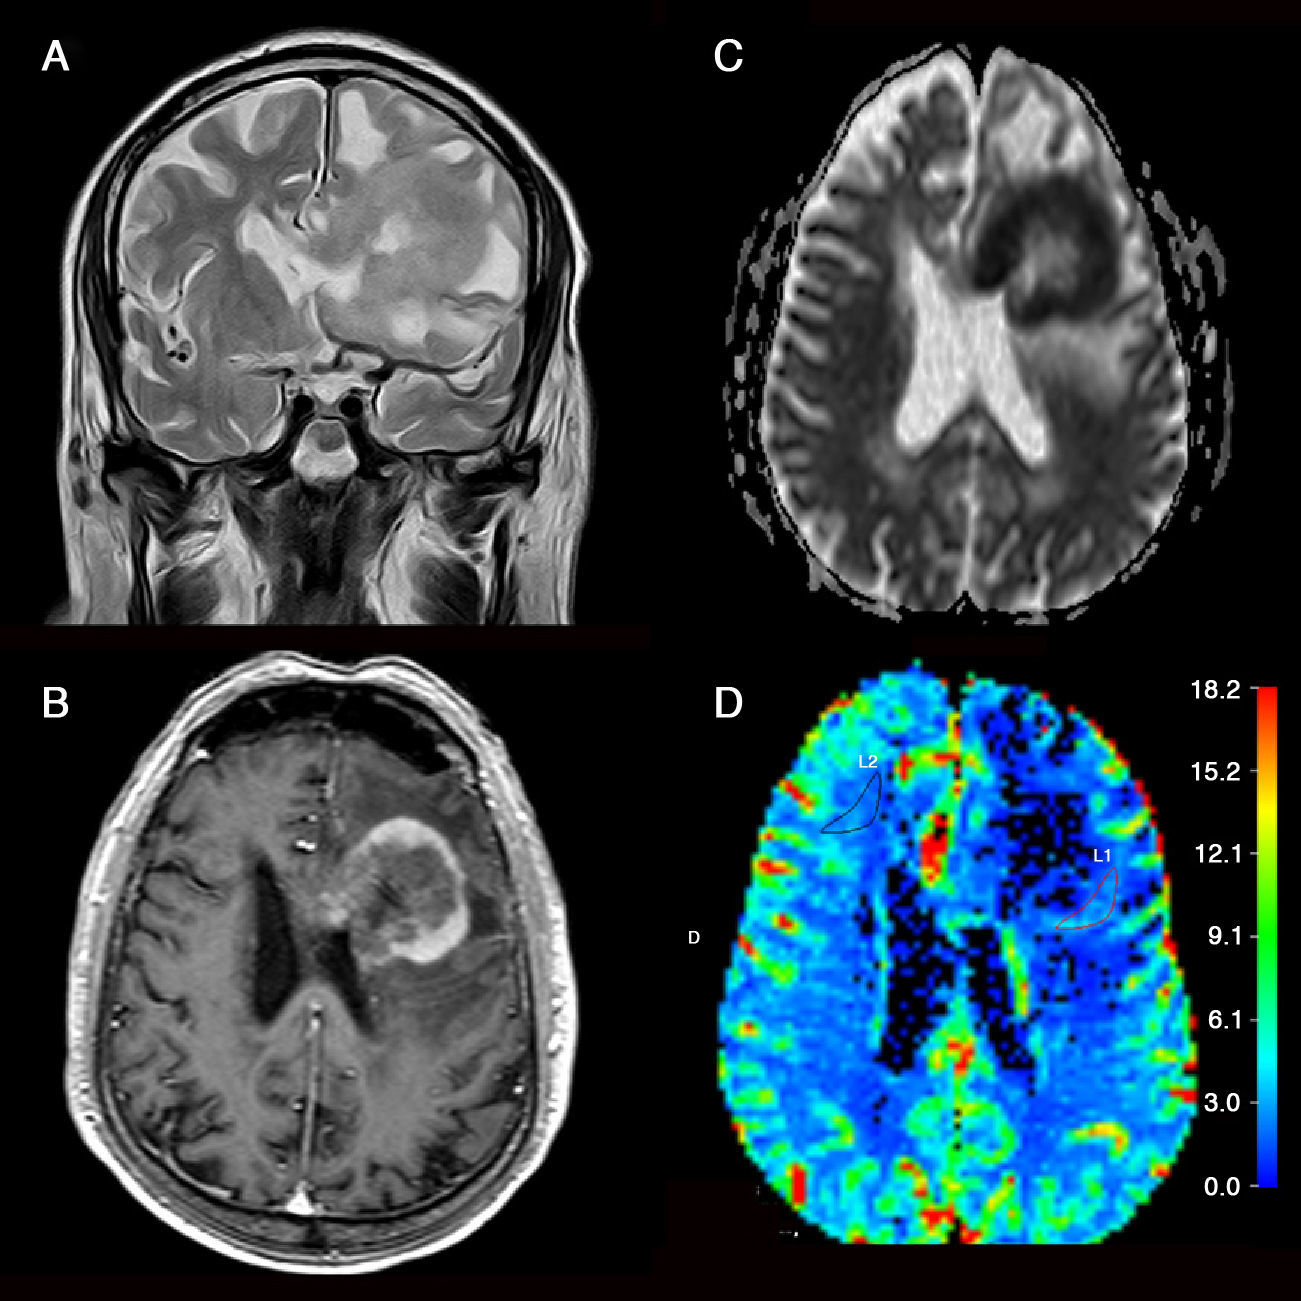
Lymphomas show relatively low values of CBV despite their histological aggressiveness, which may be helpful to differentiate them from other neoplasms21,41,54–56 (Fig. 8). This is explained by the angiocentric infiltration pattern of lymphomas, where tumor cells are arranged in concentric perivascular layers, without neovascularization being a prominent finding.42 Nonetheless, more than 23.1–25% of patients show relatively high rCBV values.54,56
 T2-weighted image shows a left periventricular mass with intermediate signal, a central necrotic area and associated edema. There is involvement of the corpus callosum. (B) After gadolinium injection there is peripheral enhancement on T1-weighted sequences. (C) Significantly decreased apparent diffusion coefficients, characteristic of this type of tumors. (D) On color maps, cerebral blood volume values are similar or slightly higher to those of the contralateral white matter. (For interpretation of the references to color in this figure legend, the reader is referred to the web version of the article.)")
Brain lymphoma. (A) T2-weighted image shows a left periventricular mass with intermediate signal, a central necrotic area and associated edema. There is involvement of the corpus callosum. (B) After gadolinium injection there is peripheral enhancement on T1-weighted sequences. (C) Significantly decreased apparent diffusion coefficients, characteristic of this type of tumors. (D) On color maps, cerebral blood volume values are similar or slightly higher to those of the contralateral white matter. (For interpretation of the references to color in this figure legend, the reader is referred to the web version of the article.)
Perfusion MR imaging has also been used in the differentiation between cerebral metastases and high-grade glial tumors. Some authors found no differences in CBV values in the solid portion of the tumor.11,57,58 This is because metastatic tumors spread via hematogenous dissemination through the central nervous system and stimulate neovascularization. These neovessels are similar to those of malignant gliomas, showing cell gap junctions, fenestrations of membranes, and open endothelial junctions.59 In contrast, Bulakbasi et al.9 found higher rCBV values for metastases than for high-grade gliomas, but with no clear cutoff value for their differentiation. Kremer et al.55 demonstrated significant differences only between gliomas and metastases from kidney or melanoma, possibly due to the extensive vasculature of these lesions. However, due to the small number of cases, no conclusions could be drawn.
In addition, statistically significant differences in CBV values were found in peritumoral edema because these values are significantly increased in gliomas in comparison with metastases.60 In metastatic brain tumors, the associated vasogenic edema consists of water leakage from capillaries but no tumor cells are present outside the tumor mass. Migration of this fluid from the vascular system results in destruction of the microvasculature and decreased cerebral blood flow. In gliomas, however, tumor cells are present in peritumoral edema and vascularity is therefore relatively preserved in this area.60
Differentiation with non neoplastic lesions: Tumefactive demyelinating lesionsPMR imaging can provide essential information for the differentiation of lesions that can mimic intracraneal tumors on conventional MR imaging.
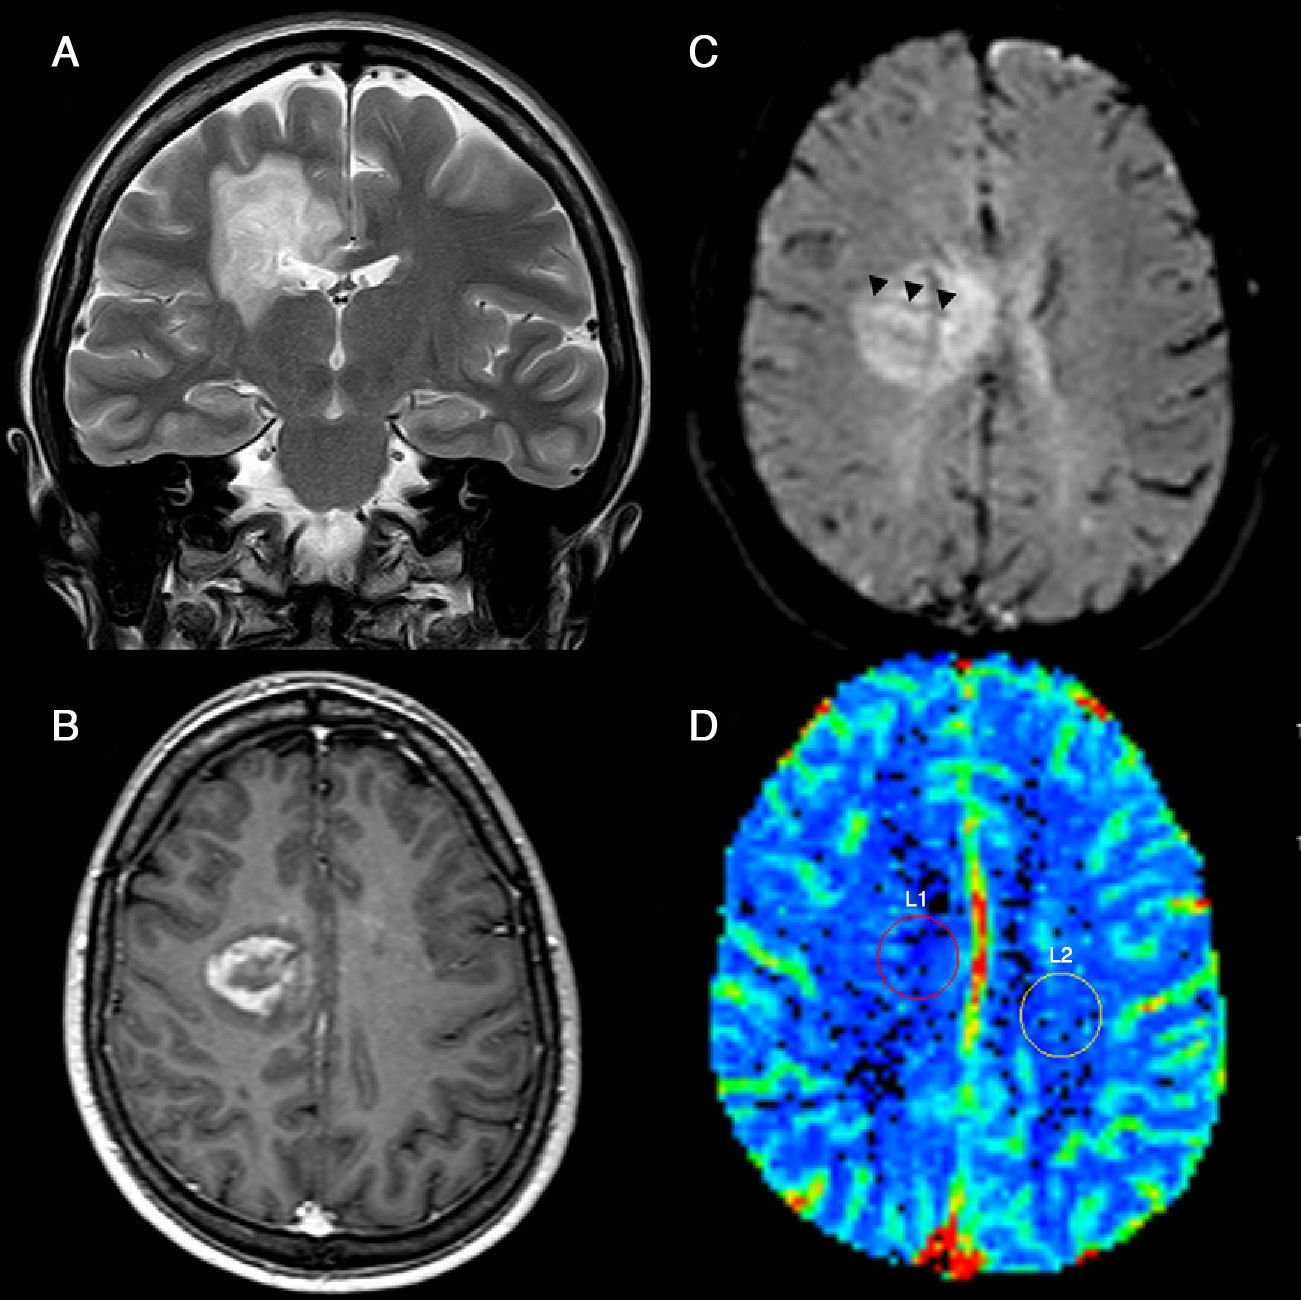
Tumefactive demyelinating lesions (TDL) and aggressive neoplasms can both show mass effect, areas of contrast enhancement and necrosis/cysts.61 Nonetheless, Cha et al.61 have demonstrated significantly lower rCBV values for TDLs than for high-grade gliomas or even lymphomas. All cases in that series had rCBV values <2. These results can be justified by the absence of marked angiogenesis in histological specimens.62 In addition, these authors have observed distinguishing vascular structures in TDLs on dynamic T2*-weighted images, presumably veins traversing the lesions on their way toward the margin of both lateral ventricles (Fig. 9).
 T2-weighted images show hyperintense periventricular lesion with associated edema that extends into the corpus callosum. (B) IV contrast-enhanced T1-weighted sequence shows incomplete peripheral enhancement at the medial margin of the lesion. (C) Dynamic EPI T2-weighted image obtained during first pass of contrast agent through the cerebral microvasculature shows linear structures (arrowheads) traversing the lesion on its way toward the margin of the lateral ventricle that presumably corresponds to subependymal veins. (D) Parametric color map demonstrates that cerebral blood volume in the lesion is similar to that found in the left centrum semiovale. (For interpretation of the references to color in this figure legend, the reader is referred to the web version of the article.)")
tumefactive demyelinating lesions. (A) T2-weighted images show hyperintense periventricular lesion with associated edema that extends into the corpus callosum. (B) IV contrast-enhanced T1-weighted sequence shows incomplete peripheral enhancement at the medial margin of the lesion. (C) Dynamic EPI T2-weighted image obtained during first pass of contrast agent through the cerebral microvasculature shows linear structures (arrowheads) traversing the lesion on its way toward the margin of the lateral ventricle that presumably corresponds to subependymal veins. (D) Parametric color map demonstrates that cerebral blood volume in the lesion is similar to that found in the left centrum semiovale. (For interpretation of the references to color in this figure legend, the reader is referred to the web version of the article.)
Recent advances in mechanical procedures and thrombolytic therapy for the treatment of acute cerebral stroke have allowed us to achieve good outcomes (modified Rankin scale ≤2) in 25–45% of treated patients, with cerebral hemorrhage occurring in 6–11% of patients.26 Although the probability of a good outcome may be greater without treatment, the majority of patients remain disabled despite treatment. The results of several trials63–66 that aim to extend the 4.5-h window for thrombolytic therapy from the onset of symptoms have been published.67 In case of thrombectomy, there is no strict time window, but the decision is made on an individual basis and based on the evaluation of the potentially salvageable tissue.68
These facts indicate the need for selecting by imaging techniques those patients that can benefit from early acute stroke therapy, increasing the yield of good clinical outcome and reducing the risk of symptomatic hemorrhage irrespective of the time elapsed since the onset of the ischemic episode. To this end, the concept of ischemic penumbra has been defined as the functionally impaired but potentially viable tissue usually surrounding the area of early stroke.69 In humans, the duration of penumbra is still unclear, but PET imaging has demonstrated a duration >24–48h.69 Nonetheless, the penumbra area drastically decreases with time so that 6h after the stroke there is less than 20% of penumbra.70
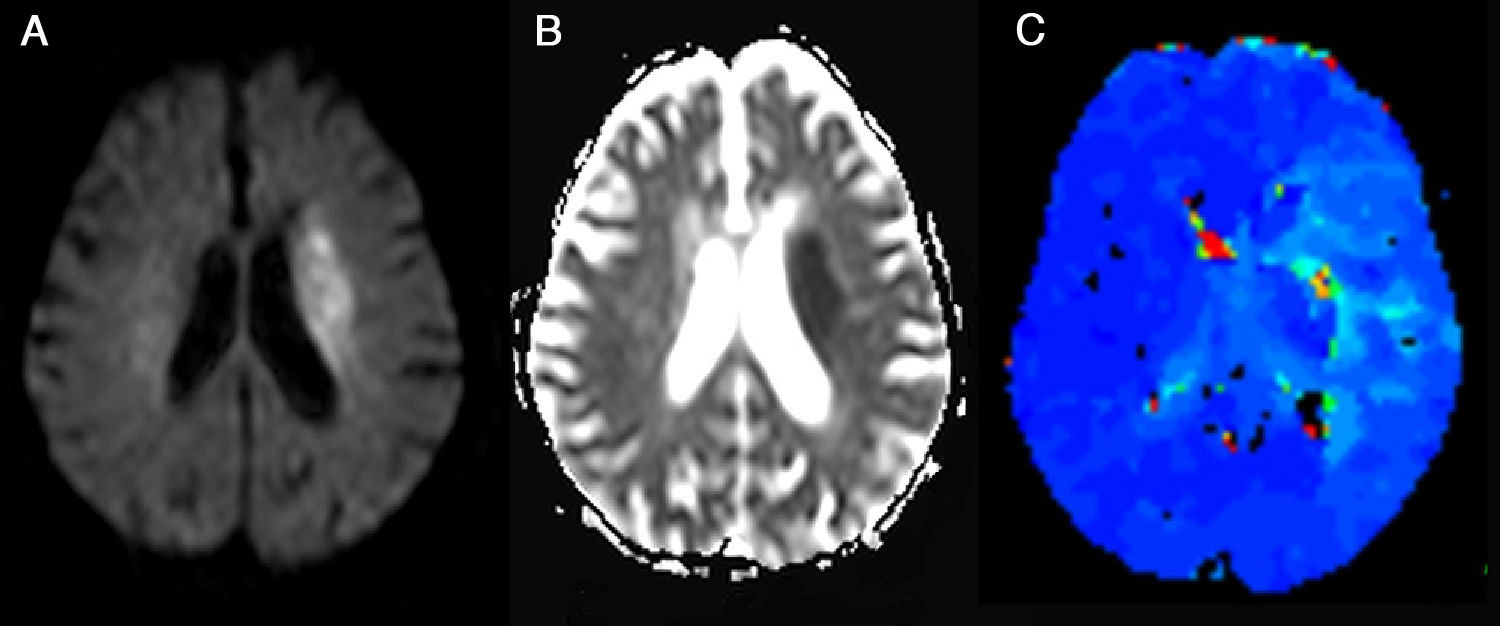
The most widely accepted form for identification of ischemic penumbra is the calculation of the difference between the volume in the area of decreased apparent diffusion coefficient (ADC) determined by diffusion MR (DMR) imaging—that represents the core of the infarct—and the volume in the hypoperfusion area, usually larger, assessed by PMR imaging.69 This difference in volume is known as perfusion–diffusion mismatch (Fig. 10). Nonetheless, Parsons et al.71 consider that response to thrombolytic therapy and progression to stroke relies more on the volumes individually assessed by PMR and DMR imaging than on the degree of perfusion–diffusion mismatch.
 It is identified as a hyperintense area on diffusion-weighted imaging that corresponds with an area of decreased apparent diffusion coefficients (B) located in left corona radiata and that theoretically represents the area of cytotoxic edema and irreversible infarct. (C) A hypoperfused region is identified on the parametric color map with increased mean transit time in the left hemisphere extending beyond the area of restricted diffusion (Image provided by Dr. Sebastià Remollo Friedemann from Hospital Universitario Doctor Josep Trueta, Gerona). (For interpretation of the references to color in this figure legend, the reader is referred to the web version of the article.)")
Ischemic penumbra. (A) It is identified as a hyperintense area on diffusion-weighted imaging that corresponds with an area of decreased apparent diffusion coefficients (B) located in left corona radiata and that theoretically represents the area of cytotoxic edema and irreversible infarct. (C) A hypoperfused region is identified on the parametric color map with increased mean transit time in the left hemisphere extending beyond the area of restricted diffusion (Image provided by Dr. Sebastià Remollo Friedemann from Hospital Universitario Doctor Josep Trueta, Gerona). (For interpretation of the references to color in this figure legend, the reader is referred to the web version of the article.)
DMR imaging abnormalities usually represent the area of cytotoxic edema and irreversible infarct.26 In some cases, however, DMR imaging abnormalities may be reversible.26,68
On the other hand, PMR imaging abnormalities of acute cerebral infarct tend to overestimate the penumbra zone because they include both ischemic areas and areas of benign oligemia that are not at risk of progression to ischemic lesion.26
Nonetheless, the parameter and corresponding threshold to differentiate infarcted and penumbral tissue from oligemia has not been established yet.68 The most frequently used parameters in the literature are TTP, MTT or Tmax.26,72 For the analysis of these parameters visual assessment can be used64,65,73 as well as quantitative thresholds of 4–6s for TTP or MTT72 or a Tmax delay ≥2s63,66 for the determination of the penumbra area. Nonetheless, some authors consider that the Tmax≥2s threshold used in most clinical trials overestimates the volume of penumbral tissue and, for this reason, they establish higher cutoff values (Tmax≥6–8s)74 to differentiate irreversible infarction from penumbra, or values ≥4s to differentiate penumbral from oligemic area.75
The results of several clinical trials that evaluated the use of thrombolytic therapy more than 3h after stroke onset suggest that the presence of diffusion–perfusion mismatch is better predictor of favorable therapeutic response than the duration of symptoms.63,65,66,73 In those references, the term mismatch is defined as a PMR imaging lesion ≥120% of the DMR imaging lesion volume.63–66,73
ConclusionPMR imaging techniques provide functional and additional information on cerebral vasculature that complements conventional MR imaging. CBV can help to determine the grade of gliomas and to differentiate them from other neoplasms such as lymphomas or metastases. CBV can also be useful in the diagnosis of TDLs. In addition, PMR imaging allows identification of penumbra areas, potentially salvageable, as mismatch areas in patients with acute ischemic stroke.
Nonetheless, several technical aspects should be considered when performing and interpreting PMR imaging studies, such as the perfusion modality and sequence used, as well as the type of contrast or injection rate. The limitations inherent to this type of studies should also be considered, including the presence of magnetic susceptibility artifacts, relative quantification of CBV instead of absolute quantification in most cases, or problems arising from contrast leakage secondary to altered BBB permeability.
An understanding of the indications and limitations of PMR imaging techniques will allow them to be routinely incorporated into MR imaging protocols.
Authorship- 1.
Responsible for the integrity of the study: JAGV.
- 2.
Conception of the study: JAGV.
- 3.
Design of the study: JAGV, PFG, JMMP, MD.
- 4.
Acquisition of data: N/A.
- 5.
Analysis and interpretation of data: N/A.
- 6.
Statistical treatment: N/A.
- 7.
Bibliographic search: JAGV.
- 8.
Drafting of the manuscript: JAGV.
- 9.
Critical review with intellectually relevant contributions: PFG, JMMP, MD.
- 10.
Approval of the final version: JAGV, PFG, JMMP, MD.
The authors declare not having any conflict of interest.
Please cite this article as: Guzmán-de-Villoria JA, et al. Estudio de la perfusión cerebral mediante técnicas de susceptibilidad magnética: técnica y aplicaciones. Radiología. 2012;54(3):208–20.

