


In patients with systemic lupus erythematosus (SLE) and fever, the causes are infection and/or activity. We assessed the diagnostic accuracy of C-reactive protein (CRP) and erythrocyte sedimentation rate (ESR) to discern these causes.
MethodsWe reviewed medical records of patients with SLE and fever hospitalized from 2010 to 2019. Based on two categories of cause of fever (infection with-or-without activity versus activity alone), we computed ROC curves, areas under the curve (AUC) and best cut-off values for ESR, parameter ESR, CRP and ESR/CRP ratio. In addition, we calculated sensitivity, specificity, and predictive values.
ResultsWe included 40 cases (34 women) with an average age of 35.5 years. The main cause of fever was the coexistence of infection and activity (17/40; 43%), followed by fever only due to activity (14/40; 35%). The most frequent infection was pneumonia (10/40; 25%) and the most common activity was renal (21/40; 53%). To diagnose “fever due to infection with-or-without activity”, compared to “fever only due to activity”, CRP had an AUC: 0.86 (95% CI: 0.75–0.97) with 5.4 mg/dl as the best cut-off value (Se: 76.9%; Sp: 85.7%; PPV: 90.9; NPV: 66.6%). To diagnose “fever due to activity only”, compared to “fever due to infection with or without activity”, the ESR/CRP ratio had an AUC: 0.83 (95% CI: 0.68–0.98) with 21.42 as the best cut-off value (Se: 78.6%; Sp: 84.6%; PPV: 73.3%; NPV: 88.0%).
ConclusionCRP and ESR/CRP ratio, which are routine tests in these cases, are potentially useful in discerning causes of fever in SLE patients. These findings should be confirmed in future studies.
En pacientes con lupus eritematoso sistémico (LES) y fiebre, las causas son infección o actividad. Se determinaron las propiedades de la proteína C reactiva (PCR) y de la velocidad de sedimentación globular (VSG) para discernir estas causas.
Material y métodosSe revisaron las historias clínicas de los pacientes con LES y fiebre hospitalizados durante el period 2010–2019. Con base en 2 categorías de causa de fiebre (infección c/s actividad versus actividad sola), se determinaron curvas ROC, áreas bajo la curva (ABC) y el mejor punto de corte para VSG, VSG parámetro, PCR y razón VSG/PCR. Además, se calculó la sensibilidad, la especificidad y los valores predictivos.
ResultadosSe incluyeron 40 casos (34 mujeres) con 35,5 años en promedio. La principal causa de fiebre fue la coexistencia de infección y actividad (17/40; 43%), seguida de fiebre solo por actividad (14/40; 35%). La infección más frecuente fue neumonía (10/40; 25%) y la actividad más común fue renal (21/40; 53%). Para diagnosticar «fiebre por infección con o sin actividad», comparado con «fiebre solo por actividad», la PCR tuvo un ABC: 0,86 (IC 95%: 0,75–0,97) con 5,4 mg/dl como mejor punto de corte (S: 76,9%; E: 85,7%; VPP: 90,9; VPN: 66,6%). Para diagnosticar «fiebre solo por actividad», comparado con «fiebre por infección c/s actividad», la razón VSG/PCR tuvo ABC: 0,83 (IC 95%: 0,68–0,98), con 21,42 como mejor corte (S: 78,6%; E: 84,6%; VPP: 73,3%; VPN: 88,0%).
ConclusiónLa PCR y la razón VSG/PCR, que son pruebas de rutina en estos casos, son potencialmente útiles para discernir causas de fiebre en pacientes con LES. Estos hallazgos deben confirmarse en futuros estudios.
Systemic lupus erythematosus (SLE) is an autoimmune disease with multiorgan involvement and a chronic course.1 In Peru, it is estimated that there were approximately 50 cases per 100,000 inhabitants in 2009.2 Its pathophysiology is characterized by cell death and the expression of genetic material that stimulates B lymphocytes and dendritic cells, which leads to the formation of autoantibodies, cytokines, and the eventual loss of self-tolerance,3 with interleukin 6 (IL-6) complementing tissue damage.4 Along with IL-6, interleukin 1β (IL-1β) and tumor necrosis factor (TNF) are present, which stimulate hepatic production of C-reactive protein (CRP).5 Furthermore, during the inflammatory process, there is an increase in plasma proteins (immunoglobulins, fibrinogen, and alpha globulin), which increases the erythrosedimentation rate (ESR).6 Both CRP and ESR are acute-phase reactants (APR) present in this and other diseases, also including infectious processes.
During fever due to lupus activity, there is a greater increase in ESR than in CRP, and during fever due to infection, the increase in CRP is greater than that of ESR,7 which is explained by the direct suppression of CRP by interferon-alpha,8 due to decreased CRP production by hepatocytes,9 anti-CRP antibodies,10 and PCR polymorphisms related to SLE.11 Some studies have used the CRP and ESR values to differentiate infectious from inflammatory processes in patients with SLE. In a study carried out in the Netherlands in 1990, it was reported that CRP greater than 6 mg/dl during SLE activity without associated serositis was indicative of infection in all cases (2-year follow-up of 71 patients with SLE).12 Another study conducted in Los Angeles, California in 2011 demonstrated that a CRP greater than 6 mg/dl was also indicative of infection, with a specificity of 84% and sensitivity of 55%,13 while, in a study carried out in Michigan in 2018, ESR/CRP ratio less than or equal to 2 was associated with infection, and greater than or equal to 15 with activity.14 Regarding activity, in 2018 it was reported in Germany that an ESR parameter (ESRp) greater than or equal to 2 has a specificity of 85% to detect disease activity,15 using the formula ESR/(age/2) for men and VSG/([age + 10]/2) for women.
So far, no documented evidence or a study with a methodological design aimed at assessing the use of PCR and ESR to differentiate infection versus activity in patients with SLE and fever have been found in Peru. It is relevant to study this in the Peruvian population, due to the existing genetic polymorphisms that can be translated into manifestations of the APR different from what was previously reported in other latitudes. These new results would complement the available international evidence and would make it possible to offer a diagnostic tool consistent with the Peruvian population to better guide treatment. Therefore, this diagnostic accuracy study is proposed in hospitalized patients with SLE and fever, to determine the usefulness of PCR and ESR to discriminate infection versus SLE activity.
MethodsContext and generalities of the studyFor this diagnostic accuracy investigation, the medical records of patients hospitalized during 2010–2019 in the Rheumatology Service of the Edgardo Rebagliati Martins National Hospital (HNERM) in Lima, Peru were reviewed. The HNERM is one of the most complex hospitals within the Social Security health system in Peru (EsSalud) and is located in the Jesus María district in Metropolitan Lima. It is a campus for medical and surgical specialization and subspecialization programs, including internal medicine, rheumatology, and infectious diseases. This research was not funded by industry. This article was written based on the STARD 2015 guidelines.16
Data generation and extraction processesData extraction was performed retrospectively; that is, it was planned and executed after the final diagnoses with available laboratory results in the medical records. As a rule, the patient with SLE and fever is hospitalized and undergoes a protocol of clinical, laboratory, and imaging assessments, after which the definitive diagnosis of the cause of the fever is issued as a verdict, considered as “activity”, “infection”, or “both.” In this hospital, the reference standard is the global assessment of the patient based on the review of the clinical evolution and the judgment of each of the diagnostic tests that occurred within the first 10 days of work-up and hospitalization. This is carried out by the treating medical team around day 10. However, it should be noted that, in the first days, the emphasis is on infection detection, avoiding underdiagnosis or omission of antibiotic treatment.
Sample and eligibility criteriaDuring our retrospective chronological chart review, cases were included sequentially as they were identified and based on data availability for the study period. A priori sample calculation was not performed. Hospitalized cases with a diagnosis of SLE according to the Systemic Lupus International Collaborating Clinics Classification Criteria,17 with axillary temperature >37.5 °C or oral temperature >38 °C18 were included. Subjects whose CRP or ESR results were not available or did not correspond to the 3 days close to the febrile peak, unclear diagnosis of infection, disease activity (or both), concurrent diagnosis of neoplasia, and subjects under 14 years of age were excluded.
Study variablesThe cause of fever (due to infection, activity, or both) was the main variable obtained according to what was recorded in the clinical chart after completing the local work-up to rule out infection (up to 10 days after the fever peak). Initially, it included 3 subgroups: a) “fever due to infection”, b) “fever due to activity”, and c) “fever due to infection and activity”. Subsequently, for the analysis of diagnostic accuracy, they were regrouped into 2 categories: I) fever with infection (includes group a: “fever due to infection”, and c: “fever due to infection and activity”); and II) fever without infection (corresponds to the group b: “fever due to activity”). This recategorization was guided by the following criteria: need for a dichotomized event for the implemented analyses, prioritization of detection of infection, reduced sample size, and minimization of the imbalance between “cases” and “non-cases” in diagnostic accuracy assessments.
Other study variables were age, sex, CRP (mg/dl), ESR (mm/h), ESRp (mm/h) (according to the formulas ESR/[age/2] for men and ESR/[age + 10)/2] for women), ESR/CRP ratio (division of ESR by CRP), C3 complement fraction (C3-mg/dl), C4 complement fraction (C4-mg/dl), leukocytes (cells/ml), neutrophils (cells/ml), lymphocytes (cells/ml), type of infection, and organ affected by SLE activity.
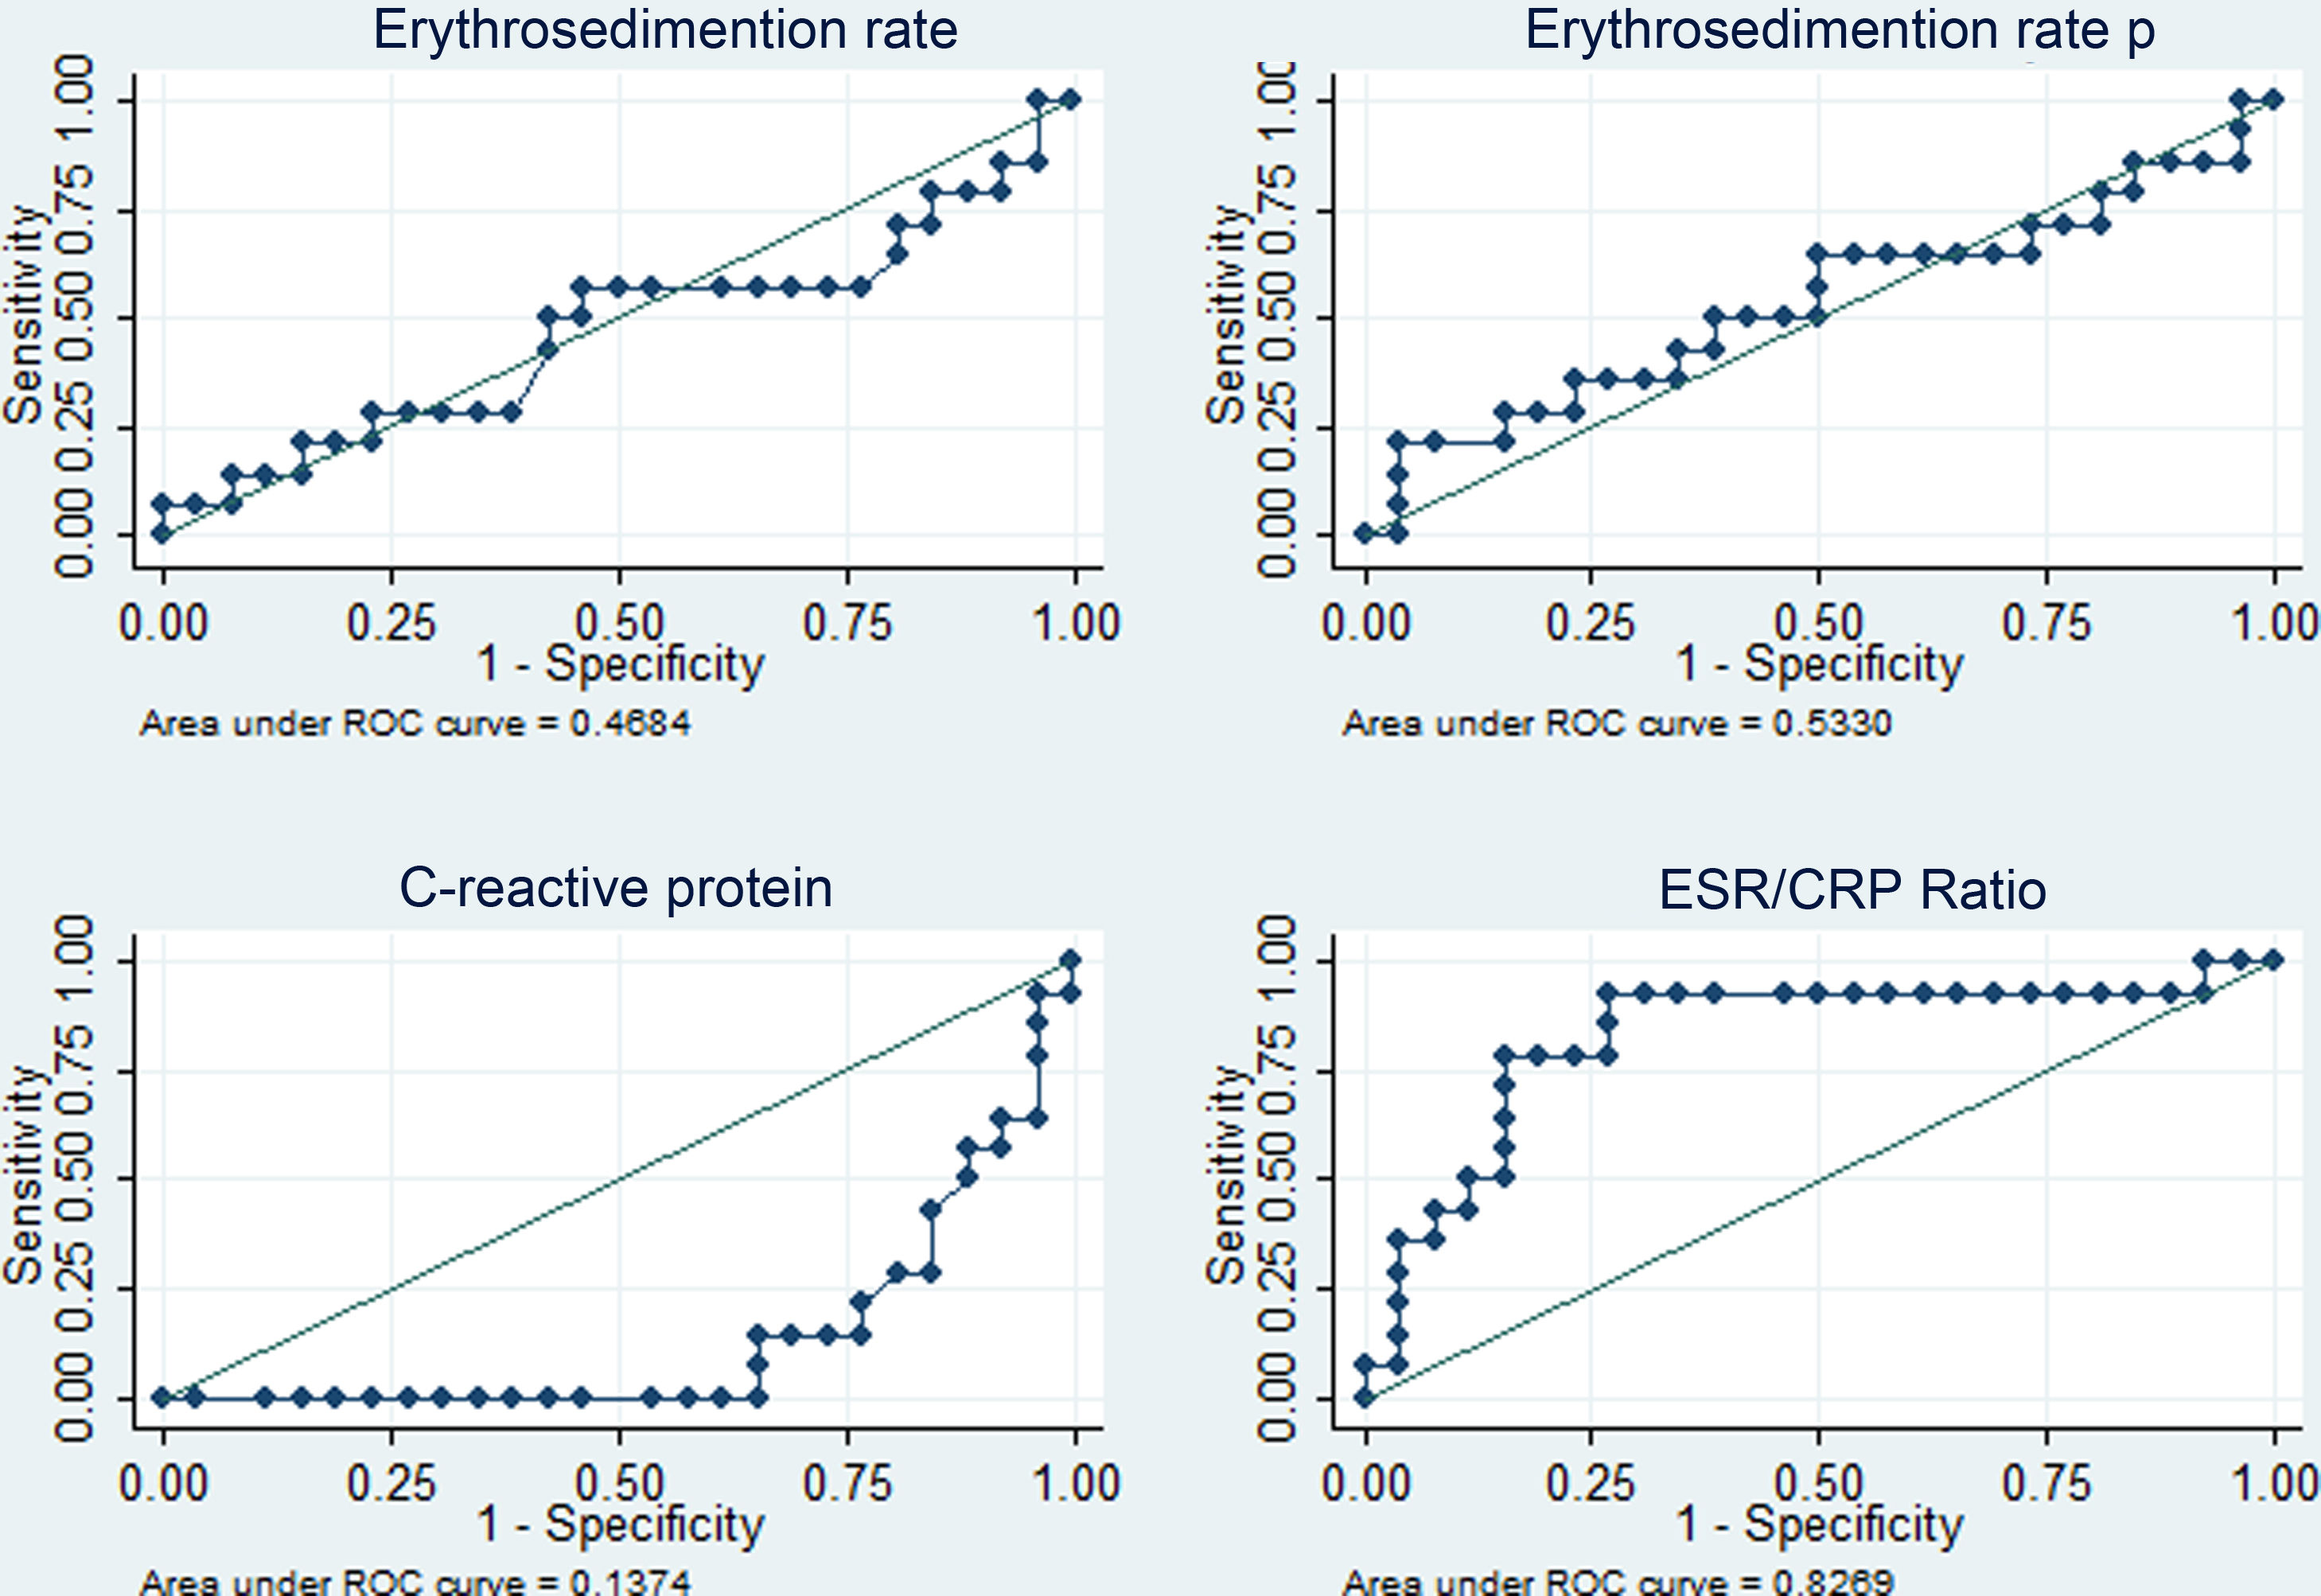
Statistical analysisMedians with interquartile ranges, as well as means with standard deviations, were calculated to describe numerical variables, absolute values, and relative percentages for categorical variables. All variables were compared between the 3 initial subgroups according to the cause of fever, using the Wilcoxon rank and Fisher’s exact tests. The same analytical procedure was repeated to compare the 2 final categories of fever causes. CRP, ESR, ESRp levels, and ESR/CRP ratio are presented as box and whisker plots for each subgroup and fever cause category. For these same 4 variables, their corresponding ROC curve was presented concerning the fever variable dichotomized. This fever variable had two versions, according to the way their categories were coded under the binary system (0 and 1 for each category). For each of the 8 resulting ROC curves (4 APRs for 2 versions of the fever variable), its area under the curve was calculated, with its respective 95% confidence interval, and in cases where it was justifiable, it was determined, in an exploratory manner, the best cut-off point, based on the method of minimizing the geometric distance (Euclidean index) between the ROC curve and the upper left corner of the total ROC space.19 Sensitivity, specificity, predictive values, and percentage of correct classification were also calculated and presented for these determined best cut-off points. Missing data on specific variables were not considered for their respective analyses. All analyses were carried out in Stata® version 15.1 for Windows.
Ethical considerationsThe study protocol, its procedures, and instruments were reviewed and approved by the HNERM Ethics Committee, as stated in letter number 276-GRPR-ESSALUD-2020. During the review of the medical records, no identifying or personal information was extracted; the authors limited themselves to verifying the eligibility criteria and obtaining clinical data relevant to the study. This research complies with current regulations and guidelines on research ethics in health sciences.
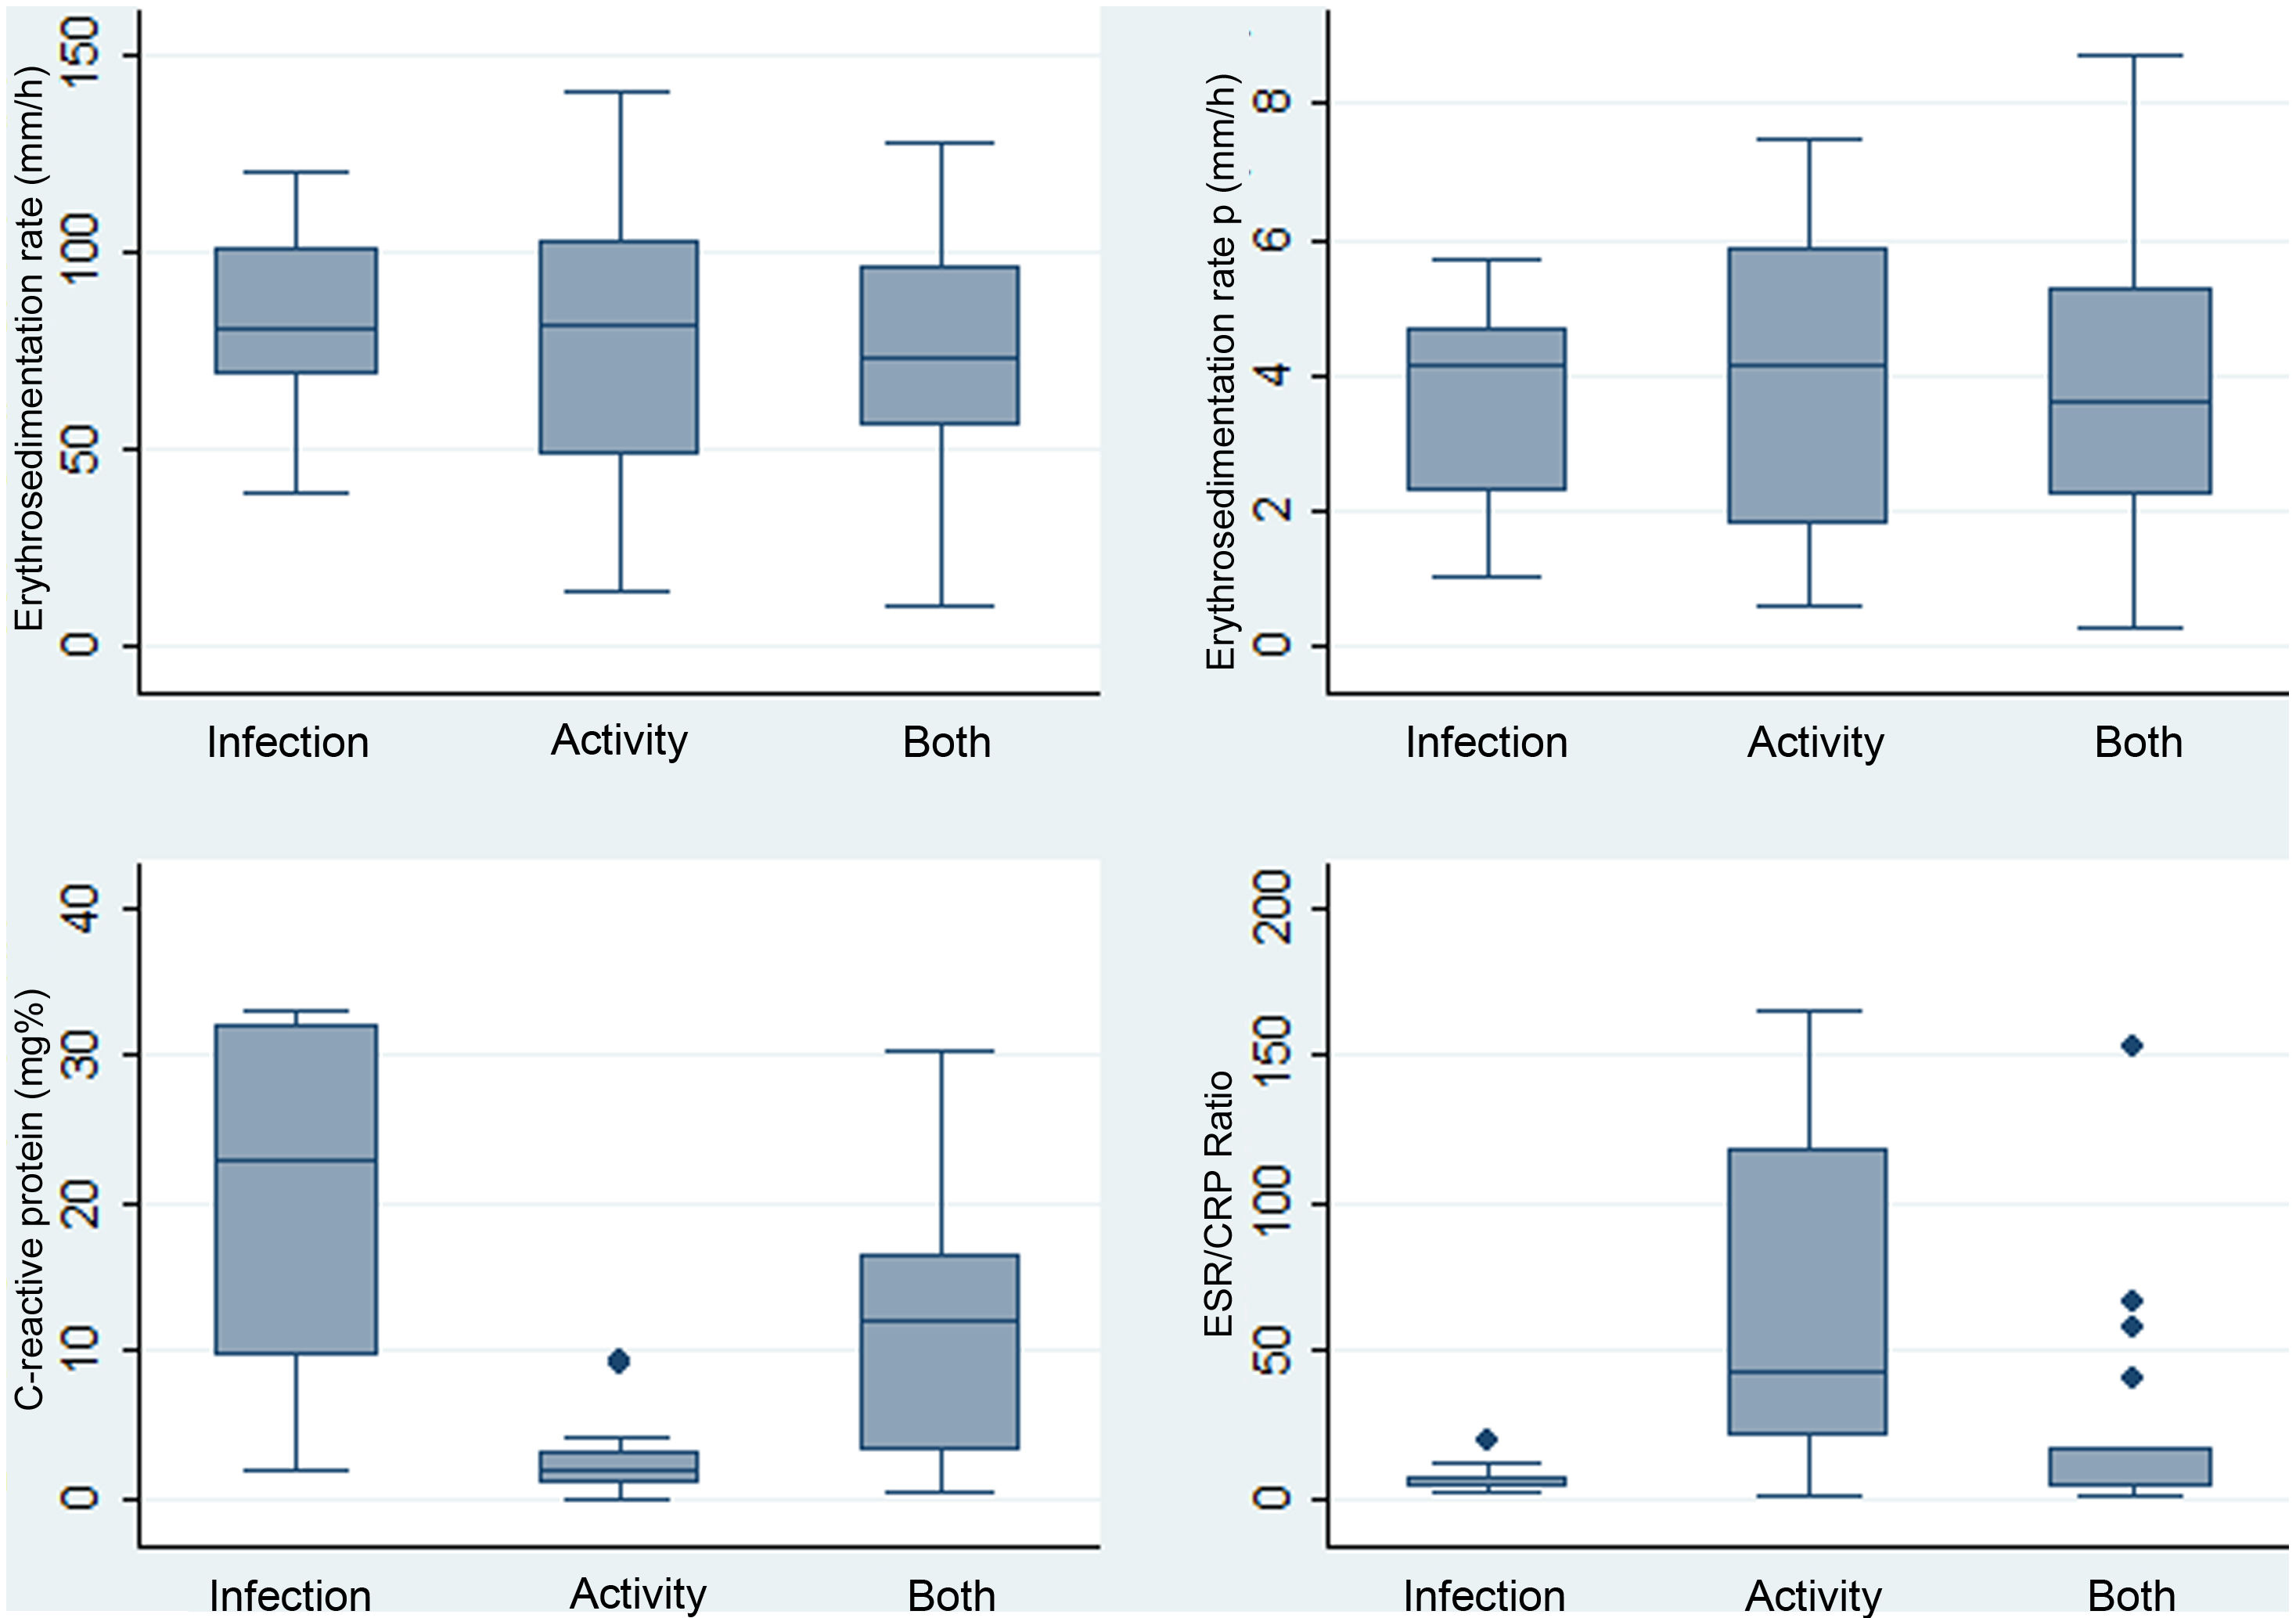
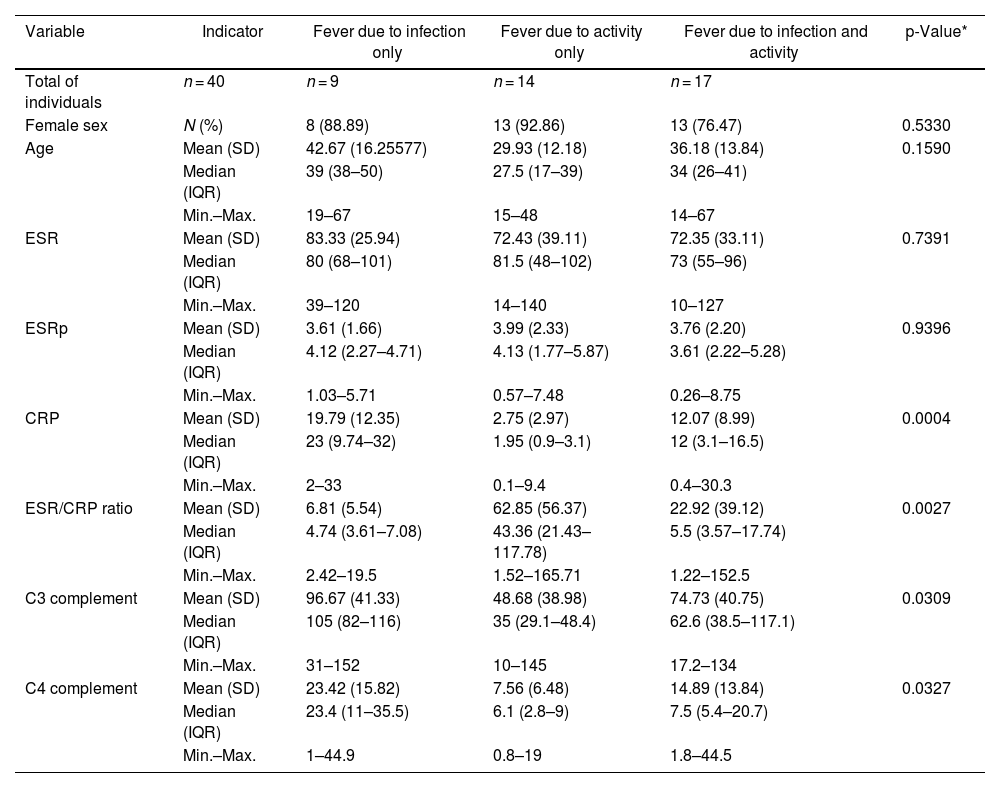
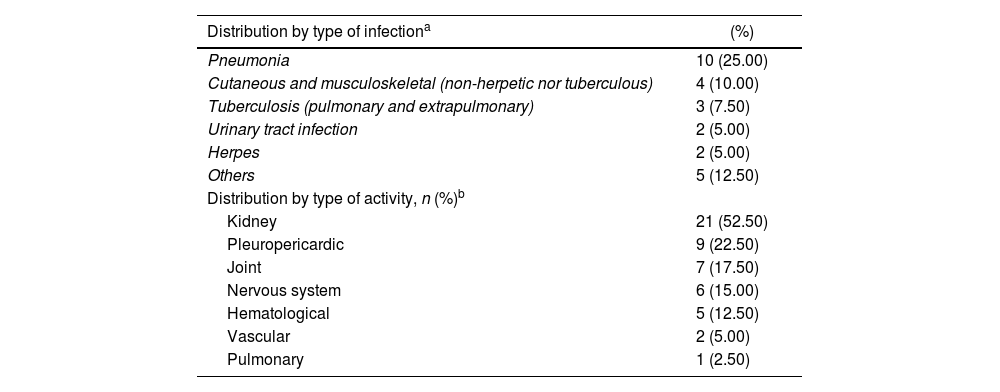
ResultsDescription of the study population and causes of fever47 cases were identified whose medical records were recovered. Of these, 40 were included (34 women). The reasons for exclusion include the following: non-available CRP (n = 1), non-available ESR (n = 2), neoplasm (n = 1), unclear diagnosis of infection (n = 2), and age under 14 years (n = 2). The mean age was 35.5 years with a standard deviation (SD) of 14.3. Table 1 depicts the compared features of the 3 original subgroups according to the cause of fever. The highest CRP levels were found in the infection group, while the highest ESR/CRP ratio levels were found in the activity group. Box and whisker plots of the 4 APRs compared among these causes of fever are presented in Fig. 1. Among the 40 cases, 22.5% (9/40) were secondary to infection, 35% (14/40) were due to activity, and the remaining [42.5% (17/40)] were the consequence of infection and activity. The most common activity was renal [52.5% (21/40)], while the most prevalent infection was pneumonia [25.0% (10/40)]. All specific causes of fever (58 diagnoses in 40 patients) are shown in Table 2.
Distribution of paraclinical values in 40 patients with SLE and fever due to infection (n = 9), activity (n = 14), or both (n = 17) in a Social Security hospital in Lima, Peru, 2010–2019.
| Variable | Indicator | Fever due to infection only | Fever due to activity only | Fever due to infection and activity | p-Value* |
|---|---|---|---|---|---|
| Total of individuals | n = 40 | n = 9 | n = 14 | n = 17 | |
| Female sex | N (%) | 8 (88.89) | 13 (92.86) | 13 (76.47) | 0.5330 |
| Age | Mean (SD) | 42.67 (16.25577) | 29.93 (12.18) | 36.18 (13.84) | 0.1590 |
| Median (IQR) | 39 (38–50) | 27.5 (17–39) | 34 (26–41) | ||
| Min.–Max. | 19–67 | 15–48 | 14–67 | ||
| ESR | Mean (SD) | 83.33 (25.94) | 72.43 (39.11) | 72.35 (33.11) | 0.7391 |
| Median (IQR) | 80 (68–101) | 81.5 (48–102) | 73 (55–96) | ||
| Min.–Max. | 39–120 | 14–140 | 10–127 | ||
| ESRp | Mean (SD) | 3.61 (1.66) | 3.99 (2.33) | 3.76 (2.20) | 0.9396 |
| Median (IQR) | 4.12 (2.27–4.71) | 4.13 (1.77–5.87) | 3.61 (2.22–5.28) | ||
| Min.–Max. | 1.03–5.71 | 0.57–7.48 | 0.26–8.75 | ||
| CRP | Mean (SD) | 19.79 (12.35) | 2.75 (2.97) | 12.07 (8.99) | 0.0004 |
| Median (IQR) | 23 (9.74–32) | 1.95 (0.9–3.1) | 12 (3.1–16.5) | ||
| Min.–Max. | 2–33 | 0.1–9.4 | 0.4–30.3 | ||
| ESR/CRP ratio | Mean (SD) | 6.81 (5.54) | 62.85 (56.37) | 22.92 (39.12) | 0.0027 |
| Median (IQR) | 4.74 (3.61–7.08) | 43.36 (21.43–117.78) | 5.5 (3.57–17.74) | ||
| Min.–Max. | 2.42–19.5 | 1.52–165.71 | 1.22–152.5 | ||
| C3 complement | Mean (SD) | 96.67 (41.33) | 48.68 (38.98) | 74.73 (40.75) | 0.0309 |
| Median (IQR) | 105 (82–116) | 35 (29.1–48.4) | 62.6 (38.5–117.1) | ||
| Min.–Max. | 31–152 | 10–145 | 17.2–134 | ||
| C4 complement | Mean (SD) | 23.42 (15.82) | 7.56 (6.48) | 14.89 (13.84) | 0.0327 |
| Median (IQR) | 23.4 (11–35.5) | 6.1 (2.8–9) | 7.5 (5.4–20.7) | ||
| Min.–Max. | 1–44.9 | 0.8–19 | 1.8–44.5 |
SD: standard deviation; IQR: interquartile range; SLE: systemic lupus erythematosus; CRP: C-reactive protein; ESR: erythrosedimentation rate; ESRp: erythrosedimentation rate parameter.
Source: self-made.
, activity (n = 14), or both (n = 17) in a Social Security hospital in Lima, Peru, 2010–2019.")
Specific etiologies (n = 58) in 40 patients with SLE and fever due to infection (n = 9), activity (n = 14), or both (n = 17) in a Social Security hospital in Lima, Peru, 2010–2019.
| Distribution by type of infectiona | (%) |
|---|---|
| Pneumonia | 10 (25.00) |
| Cutaneous and musculoskeletal (non-herpetic nor tuberculous) | 4 (10.00) |
| Tuberculosis (pulmonary and extrapulmonary) | 3 (7.50) |
| Urinary tract infection | 2 (5.00) |
| Herpes | 2 (5.00) |
| Others | 5 (12.50) |
| Distribution by type of activity, n (%)b | |
| Kidney | 21 (52.50) |
| Pleuropericardic | 9 (22.50) |
| Joint | 7 (17.50) |
| Nervous system | 6 (15.00) |
| Hematological | 5 (12.50) |
| Vascular | 2 (5.00) |
| Pulmonary | 1 (2.50) |
SLE: systemic lupus erythematosus.
a,bThe sum of percentages of each activity exceeds 100%, due to the simultaneous presence of different types of activity and/or infection in the same patient. There were 58 diagnoses in 40 patients.
Source: self-made.
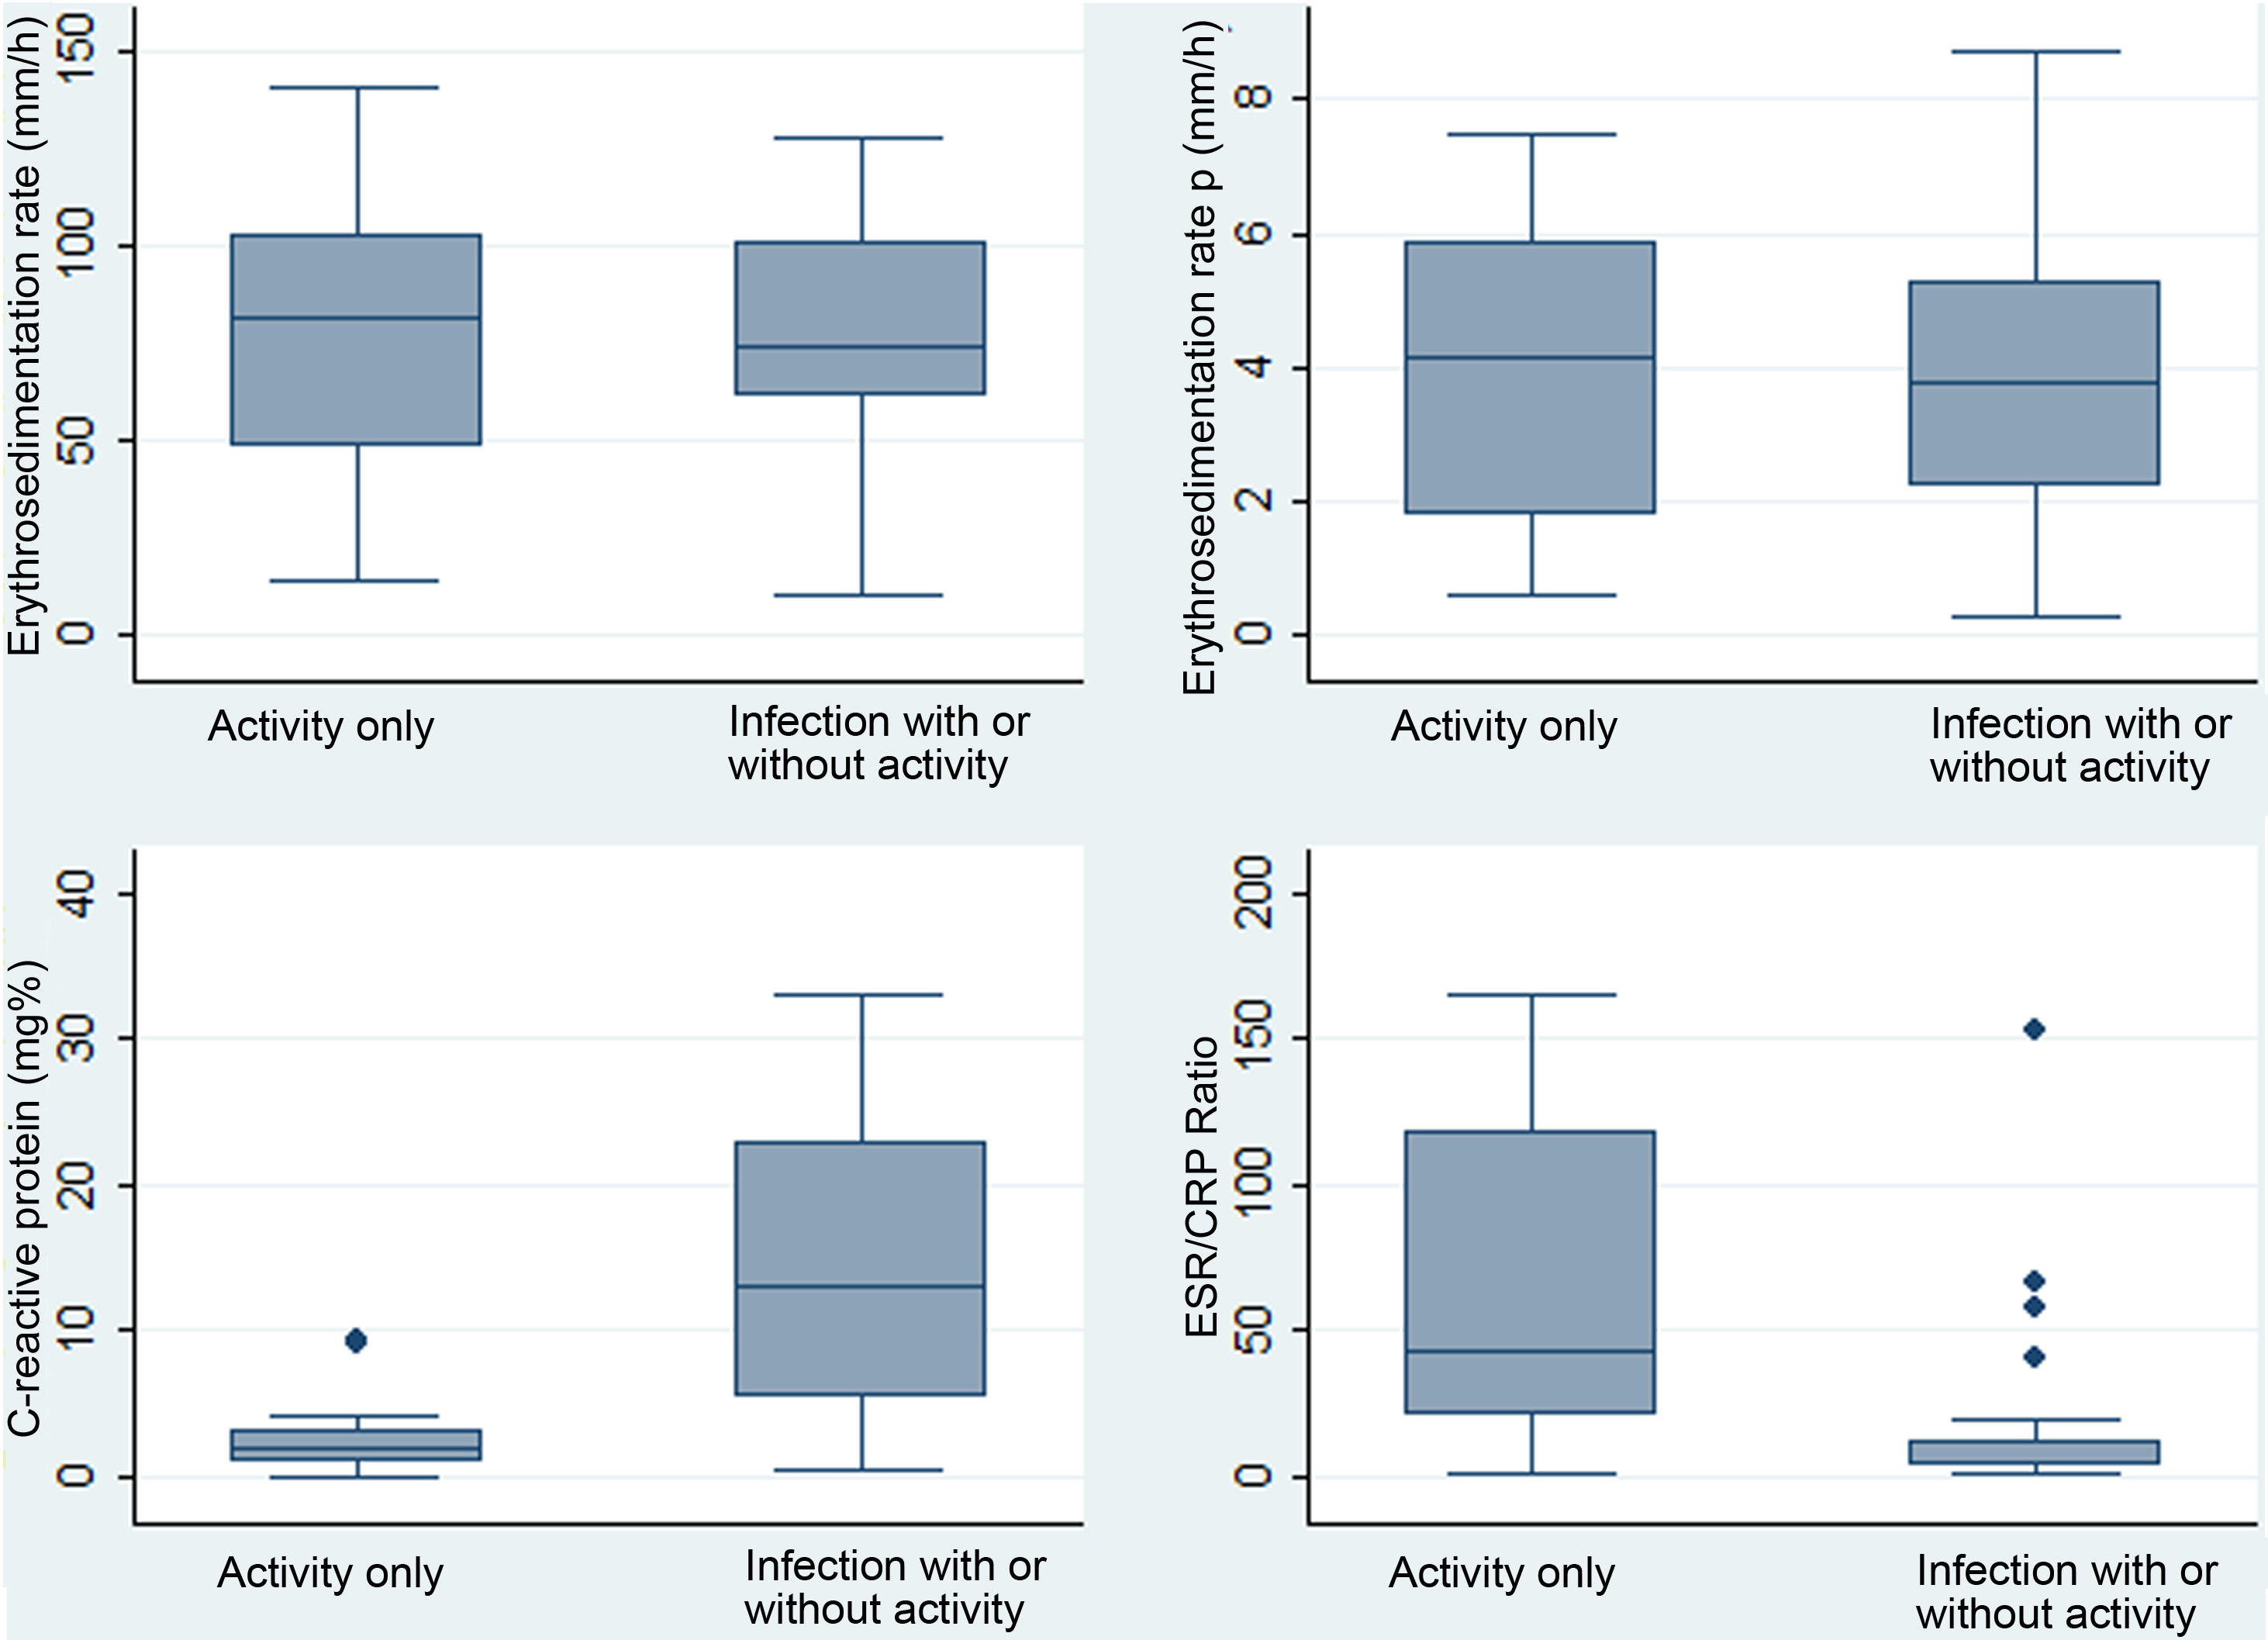
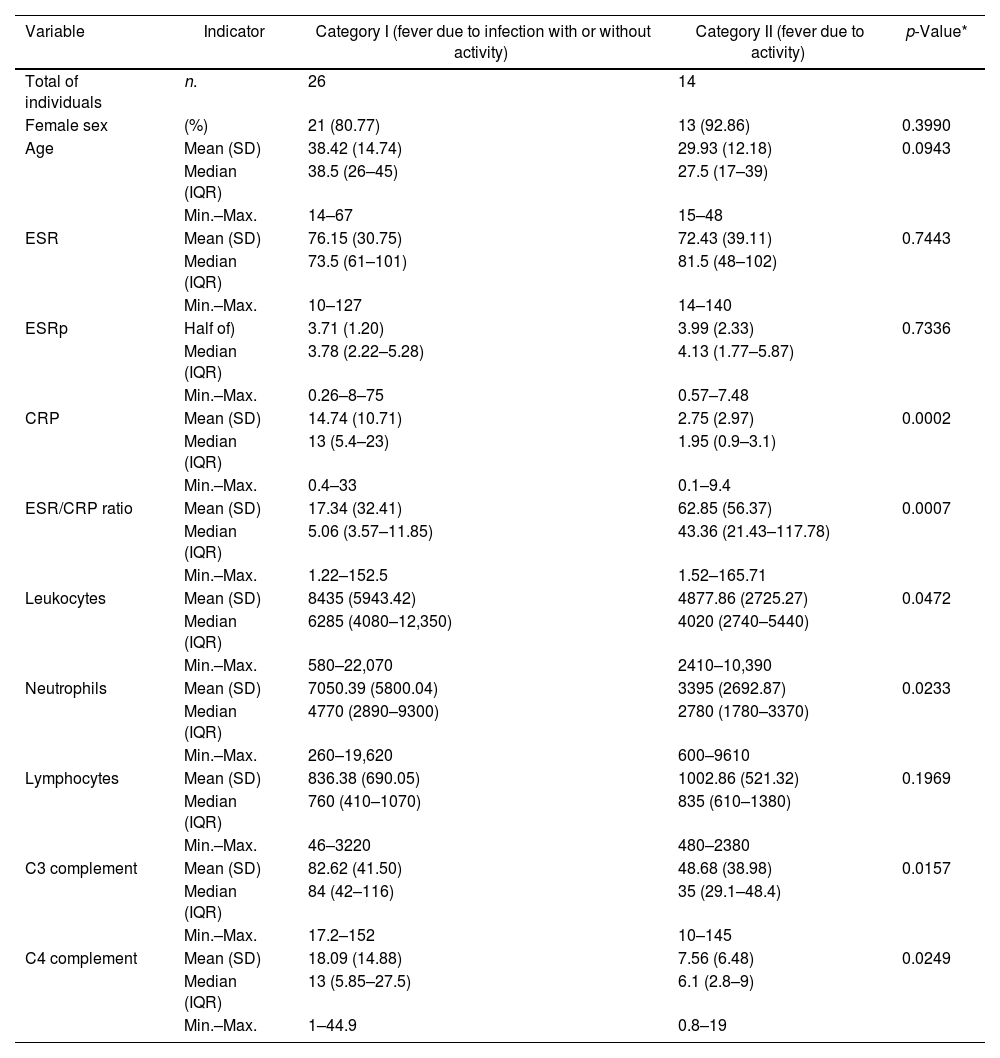
For the following comparative and diagnostic accuracy analyses, the fever variable was analyzed based on 2 previously described categories: I) fever with infection (includes group a: “fever due to infection”, and c: “fever due to infection and activity”), and II) fever without any infection (corresponds to group b: “fever due to activity”). The compared characteristics of these 2 categories are described in Table 3. The highest levels of CRP corresponded to the group of fever due to infection with/without activity, and the highest levels of ESR/CRP ratio corresponded to the group of fever due to activity. Box and whisker plots of the 4 APRs compared between these same 2 categories are presented in Fig. 2.
Distribution of paraclinical values in 40 patients with SLE and fever due to infection with or without activity (n = 26) or only due to activity (n = 14) in a Social Security hospital in Lima, Peru, 2010–2019.
| Variable | Indicator | Category I (fever due to infection with or without activity) | Category II (fever due to activity) | p-Value* |
|---|---|---|---|---|
| Total of individuals | n. | 26 | 14 | |
| Female sex | (%) | 21 (80.77) | 13 (92.86) | 0.3990 |
| Age | Mean (SD) | 38.42 (14.74) | 29.93 (12.18) | 0.0943 |
| Median (IQR) | 38.5 (26–45) | 27.5 (17–39) | ||
| Min.–Max. | 14–67 | 15–48 | ||
| ESR | Mean (SD) | 76.15 (30.75) | 72.43 (39.11) | 0.7443 |
| Median (IQR) | 73.5 (61–101) | 81.5 (48–102) | ||
| Min.–Max. | 10–127 | 14–140 | ||
| ESRp | Half of) | 3.71 (1.20) | 3.99 (2.33) | 0.7336 |
| Median (IQR) | 3.78 (2.22–5.28) | 4.13 (1.77–5.87) | ||
| Min.–Max. | 0.26–8–75 | 0.57–7.48 | ||
| CRP | Mean (SD) | 14.74 (10.71) | 2.75 (2.97) | 0.0002 |
| Median (IQR) | 13 (5.4–23) | 1.95 (0.9–3.1) | ||
| Min.–Max. | 0.4–33 | 0.1–9.4 | ||
| ESR/CRP ratio | Mean (SD) | 17.34 (32.41) | 62.85 (56.37) | 0.0007 |
| Median (IQR) | 5.06 (3.57–11.85) | 43.36 (21.43–117.78) | ||
| Min.–Max. | 1.22–152.5 | 1.52–165.71 | ||
| Leukocytes | Mean (SD) | 8435 (5943.42) | 4877.86 (2725.27) | 0.0472 |
| Median (IQR) | 6285 (4080–12,350) | 4020 (2740–5440) | ||
| Min.–Max. | 580–22,070 | 2410–10,390 | ||
| Neutrophils | Mean (SD) | 7050.39 (5800.04) | 3395 (2692.87) | 0.0233 |
| Median (IQR) | 4770 (2890–9300) | 2780 (1780–3370) | ||
| Min.–Max. | 260–19,620 | 600–9610 | ||
| Lymphocytes | Mean (SD) | 836.38 (690.05) | 1002.86 (521.32) | 0.1969 |
| Median (IQR) | 760 (410–1070) | 835 (610–1380) | ||
| Min.–Max. | 46–3220 | 480–2380 | ||
| C3 complement | Mean (SD) | 82.62 (41.50) | 48.68 (38.98) | 0.0157 |
| Median (IQR) | 84 (42–116) | 35 (29.1–48.4) | ||
| Min.–Max. | 17.2–152 | 10–145 | ||
| C4 complement | Mean (SD) | 18.09 (14.88) | 7.56 (6.48) | 0.0249 |
| Median (IQR) | 13 (5.85–27.5) | 6.1 (2.8–9) | ||
| Min.–Max. | 1–44.9 | 0.8–19 |
SD: standard deviation; IQR: interquartile range; SLE: systemic lupus erythematosus; CRP: C-reactive protein; ESR: erythrosedimentation rate; ESRp: erythrosedimentation rate parameter.
Source: self-made.
 or due to infection with/without activity (n = 26) in a Social Security hospital in Lima, Peru, 2010–2019.")
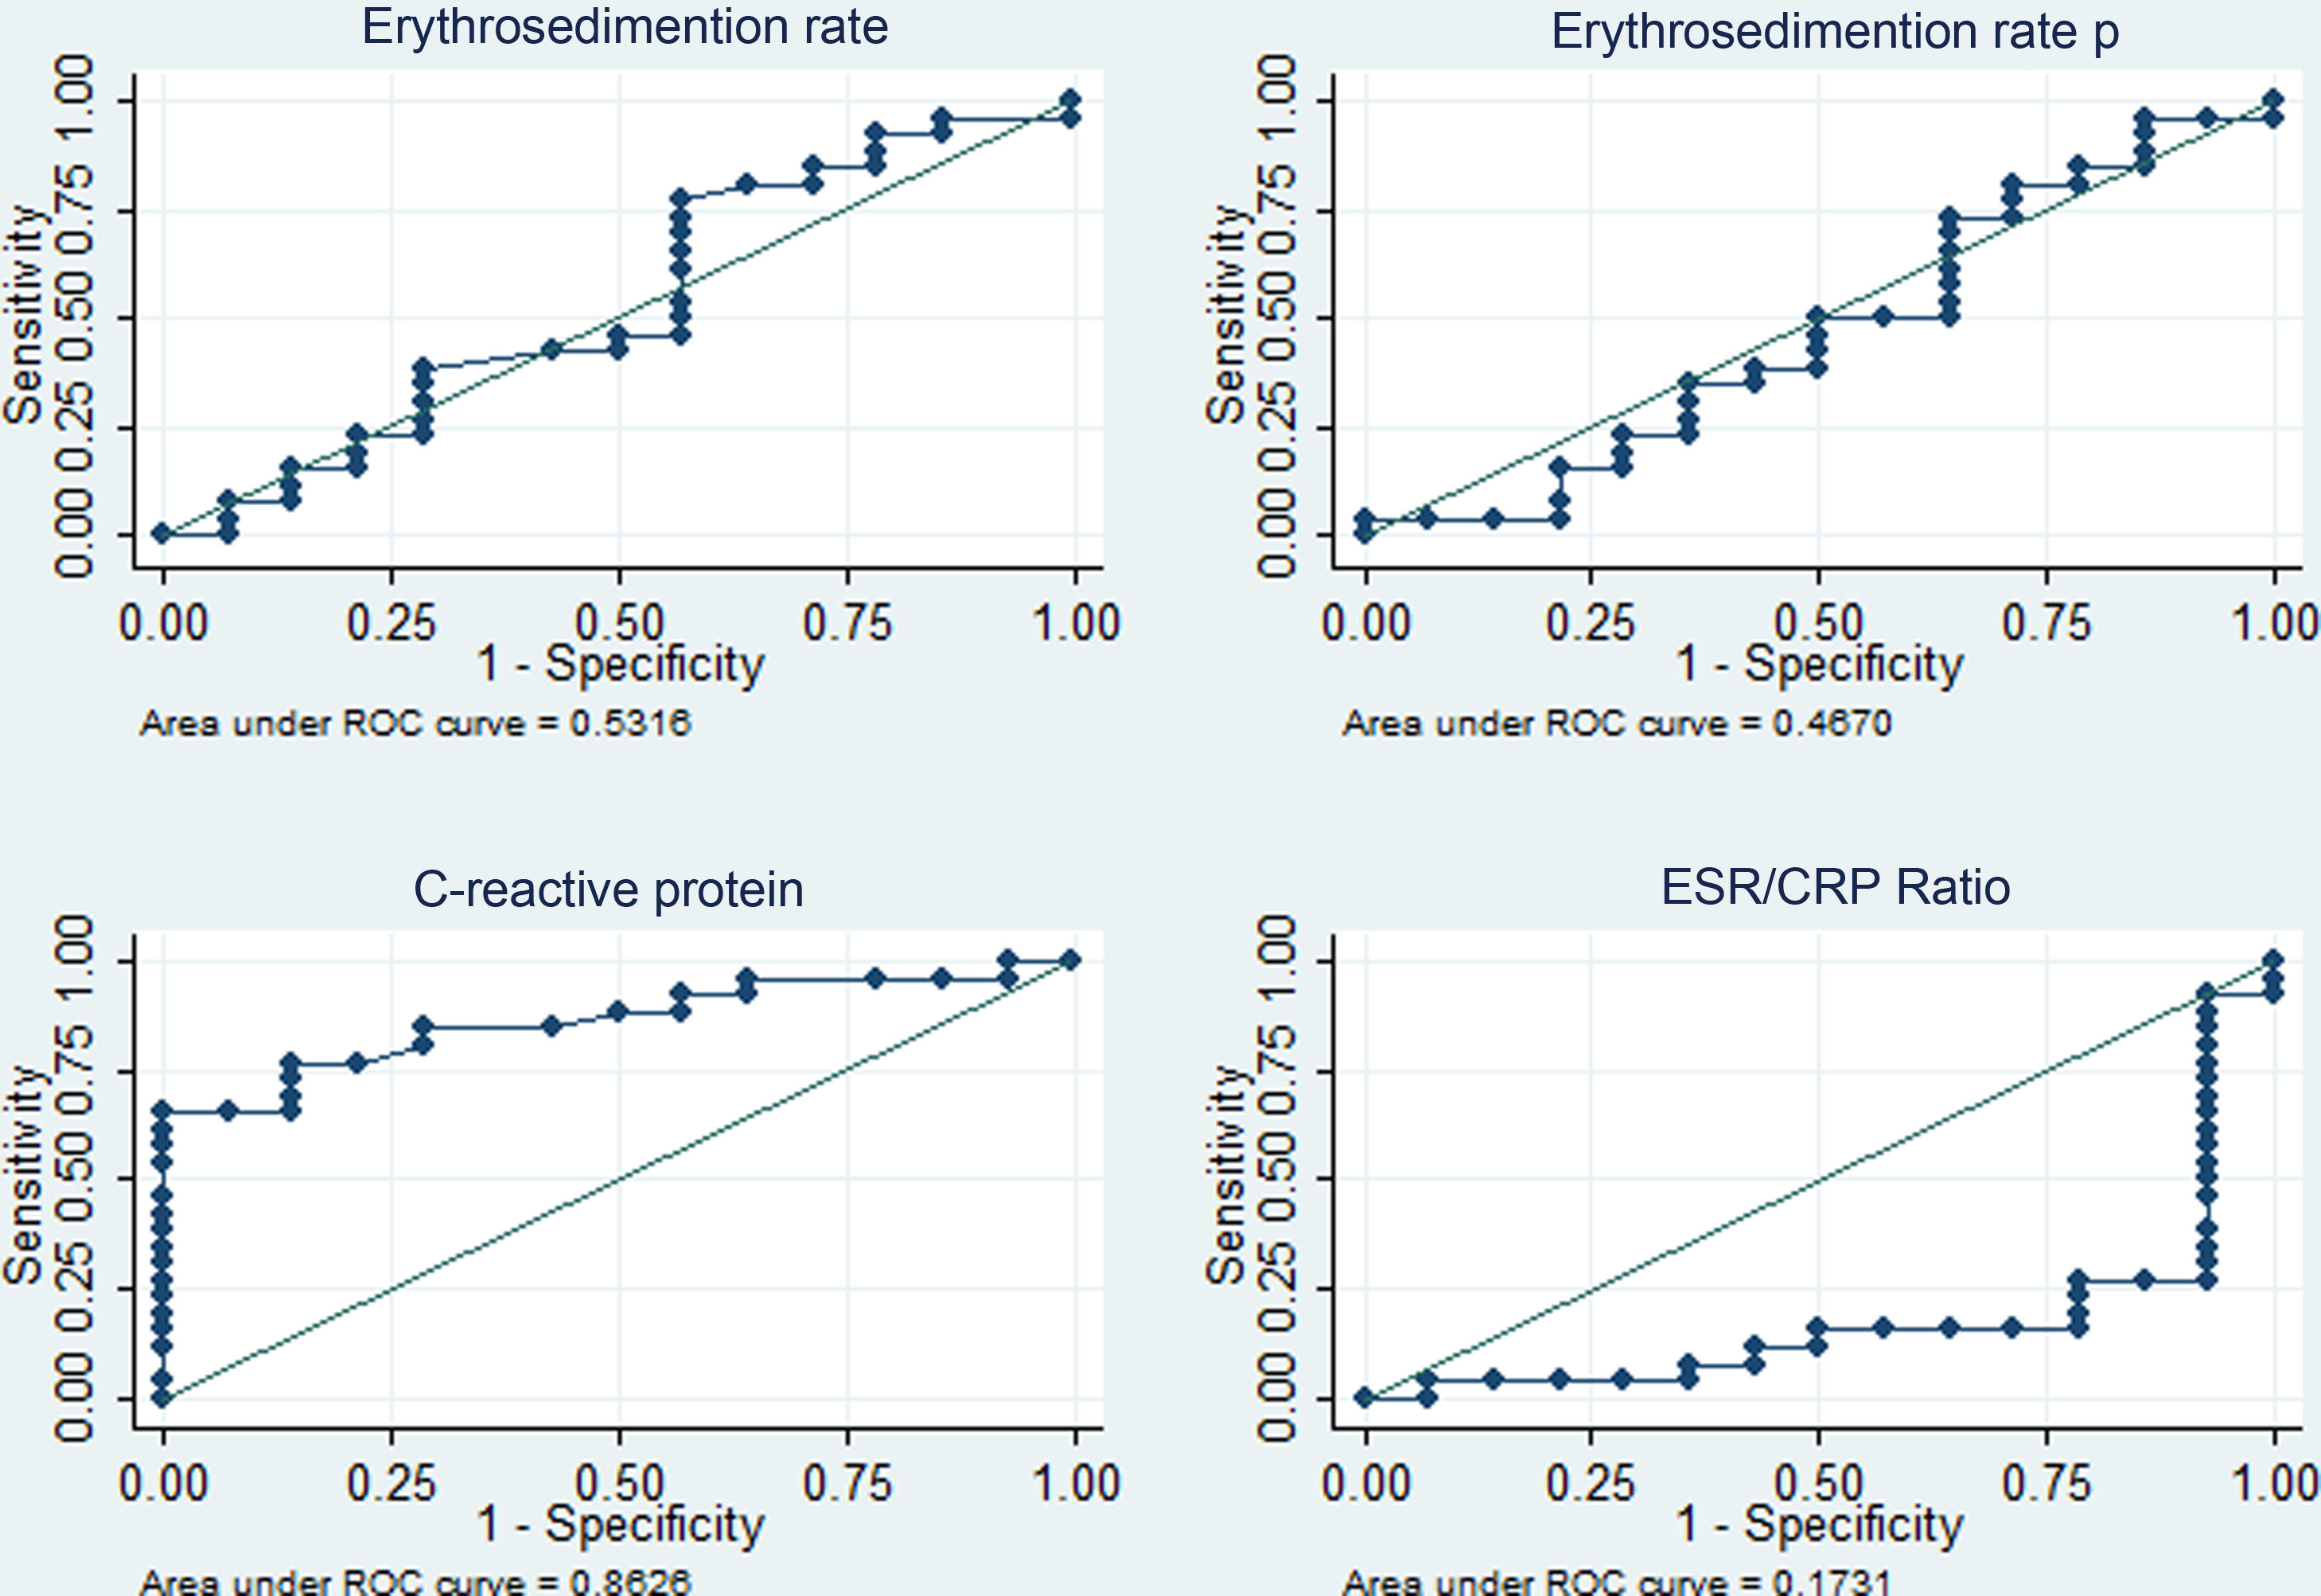
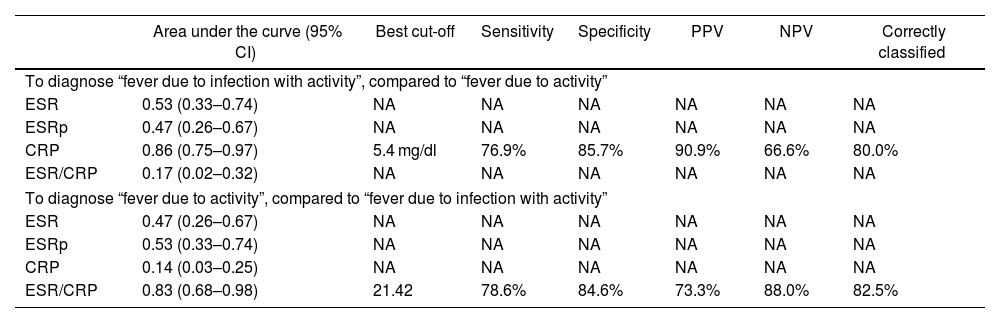
The diagnostic performance of the four APRs is shown in Table 4. The areas under the curve above 80% stand out for CRP (diagnosis of fever due to infection with or without activity) and for the ESR/CRP ratio (diagnosis of fever due to activity) and similar percentages of correct classification for the best cut-off points identified (5.4 mg/dl in PCR and 21.42 in the ESR/CRP ratio). The corresponding ROC curves are depicted in Figs. 3 and 4.
Performance of acute-phase reactants to differentiate fever due to activity (n = 14) versus fever due to infection plus activity (n = 26) in 40 patients with SLE in a hospital in Social Security in Lima, Peru, 2010–2019.
| Area under the curve (95% CI) | Best cut-off | Sensitivity | Specificity | PPV | NPV | Correctly classified | |
|---|---|---|---|---|---|---|---|
| To diagnose “fever due to infection with activity”, compared to “fever due to activity” | |||||||
| ESR | 0.53 (0.33–0.74) | NA | NA | NA | NA | NA | NA |
| ESRp | 0.47 (0.26–0.67) | NA | NA | NA | NA | NA | NA |
| CRP | 0.86 (0.75–0.97) | 5.4 mg/dl | 76.9% | 85.7% | 90.9% | 66.6% | 80.0% |
| ESR/CRP | 0.17 (0.02–0.32) | NA | NA | NA | NA | NA | NA |
| To diagnose “fever due to activity”, compared to “fever due to infection with activity” | |||||||
| ESR | 0.47 (0.26–0.67) | NA | NA | NA | NA | NA | NA |
| ESRp | 0.53 (0.33–0.74) | NA | NA | NA | NA | NA | NA |
| CRP | 0.14 (0.03–0.25) | NA | NA | NA | NA | NA | NA |
| ESR/CRP | 0.83 (0.68–0.98) | 21.42 | 78.6% | 84.6% | 73.3% | 88.0% | 82.5% |
95% CI: 95% confidence interval; SLE: systemic lupus erythematosus; NA: does not apply; CRP: C-reactive protein; ESR: erythrosedimentation rate; PPV: positive predictive value; NPV: negative predictive value; ESRp: erythrocyte sedimentation rate parameter.
Source: self-made.


Four acute phase reactants (ESR, ESRp, CRP, and ESR/CRP ratio) were studied to determine their diagnostic accuracy properties and differentiate infectious from inflammatory processes in patients with SLE and fever. As far as is known, this is the first study of this type in the Peruvian context.
The percentage of the female population (85%) was like that reported in previous meta-analyses (86.57%),20 which shows that the Peruvian population is similar to others. This current study revealed that the highest CRP belonged to the group of fever due to infection, with a mean of 19.79 mg/dl (SD: 12.35), a finding compatible with previous reports carried out in different populations: Michigan in 2018,14 California in 2011,13 and South Korea in 2012,21 which also demonstrated an increase in CRP in SLE with infection. This is explained because external pathogens stimulate the increase in IL-6, which augments the hepatic production of CRP.5 The highest ESR/CRP ratio belonged to the fever group due to activity, a finding compatible with a study carried out in Germany in 2017.15 In the present study, the adopted hypothesis was that anti-CRP antibodies are produced during SLE activity (which inhibit it), as inflammatory plasma proteins rise, ESR increases.8–11 C3 and C4 fractions were significantly lower in the activity fever group, a widely known finding.
The most common lupus activity was renal (52.5%), followed by pleuropericardic affection (22.5%), which differs from the reported in the literature, in which cutaneous (69.8%) and joint involvement (58.4%) predominate.22 The most common infection was pneumonia (25%), followed by cutaneous and musculoskeletal (10%), as opposed to urinary infection, which predominated in similar studies.23 This difference could be explained because only hospitalized patients were included, which excludes any minor activity or infection (that does not involve target organs). Nearly all subjects corresponded to the group of fever due to infection and activity (42.5%), a finding that is supported by the hypothesis of a pivotal mechanism proposed by A. Doria (Italy, 2008), according to which infection is a cause of SLE activity and also a complication of the disease.24 On the one hand, infection triggers immunity through molecular mimicry, as in the case of the Epstein–Barr virus,25 production of superantigens, and alteration of apoptosis, among others.26,27 Nonetheless, the low expression of the complement receptor in erythrocytes, B cells, and neutrophils, as well as the deficiency of mannose-binding lecithin and the use of immunosuppressants, confer susceptibility to different types of infections,24 including common, chronic, and opportunistic.28
In this study, concerning the comparative analysis with the dichotomized cause of fever, it was found that CRP ≥ 5.4 mg/dl has an area under the curve of 0.86 (specificity of 85.7% and sensitivity of 76.9%) to identify infectious processes with or without activity as a cause of fever, while the ESR/CRP ratio ≥21.42 has an area under the curve of 0.83 (specificity of 84.6% and sensitivity of 78.6%) to identify SLE activity. Regarding CPR, our result had better performance than that reported in California (2011) with a value for infection >6 mg/dl (area under the curve of 0.75, sensitivity of 55%, and specificity of 84%).13 In this study, they admitted ESR and CPR results within the same week and did not limit the sample to only febrile patients. Presumably, the inclusion of individuals exclusively with fever, CRP, and ESR results within 3 days of infection optimized the result of the current study. A lower CRP cut-off point for infection was obtained than that reported in Germany (2017) —CRP 7.2 mg/dl15—, in the Netherlands (1990) —CRP 6 mg/dl12—, and in Michigan (2014) —CRP 11.2 mg/dl14—, and a higher ESR/CRP ratio than in Michigan (≥15 for SLE activity).14
The lower PCR cut-off point could be explained because patients with coexisting infection and activity were included in the category of patients “with infection.” This supports the theory of CRP inhibition in the case of activity and its relationship with the pathogenesis of the disease.29 Additionally, no patient with serositis in the case mix of this study belonged to the “fever-only activity” group, which probably reduced the coverall CRP value in them.30 Furthermore, the analysis used the fever variable dichotomized to prioritize the detection of infection with or without activity, since this implies a therapeutic change that includes antibiotics and guides the immediate need for the use of immunosuppressants.
On the other hand, the performance of ESR and ESRp was poor (area under the curve of 0.53 and 0.47, respectively) to identify the infectious process. Regarding ESR, there is no consensus in the literature on its usefulness. In Germany, in 2017, no significant variation of ESR was found with infection, activity, or both in SLE15; in Israel, an increase in ESR was found during activity31; in Maryland (2013), an association was observed between the increase in both ESR (≥25 mm/h) and Systemic Lupus Erythematosus Disease Activity Index (Sledai)32; and finally, in South Korea, an increase in ESR associated with infection versus activity was found (41.26 versus 25.21 mm/h).21 With reference to ESRp, in Germany, it was shown that ESRp > 1.1 had a sensitivity of 68.2% and a specificity of 62.5% to identify SLE activity 15. It has been shown that ESR has very scattered and inconsistent results; this is because it is an acute-phase reactant that varies according to age,33 race,34 plasma proteins,35 and anemia, among others.36 The number of subjects included prevented matching the variable with the aforementioned confounding factors.
The search for new tools for diagnostic discrimination entails many challenges and exhibits several gaps. For example, due to both the biological heterogeneity of the manifestations of the causes of fever in these patients, and the fact that no classification system is 100% perfect, there are always cases of patients with SLE who do not raise CRP while infected, along with those who raise it without having infections. This is manifested in that none of the assessed indicators (sensitivity, specificity, and predictive values) reach 100% and represent part of the difficulties in discriminating infection from activity. In another example, in a 2017 systematic review, despite encouraging results for anti-double-stranded DNA, anti-C1q antibodies, and B cell stimulator, it was not possible to obtain consistent conclusions to define which is the best of them.37 Furthermore, its availability is limited in our context. With respect to C3 and C4 complement fractions, with suggestive findings in the present study, some authors point out that their usefulness as a biomarker of activity is inconsistent,38 which makes it necessary to look for other alternatives such as the ESR/CRP ratio.
The present study has limitations and strengths. Among the main limitations, the sample size is initially recognized, as well as using data from medical records. The latter do not significantly bias the results and, on the contrary, are linked to the extensive period studied (10 years), involving a medical team with extensive experience in one of the main reference hospitals in Peru, which are strengths of the study. With respect to the population studied (divided into cases with fever due to some infectious process with or without activity and cases with fever due to activity), this only included hospitalized patients, which inevitably means that the cases exhibit a more severe infection or activity, with a greater inflammatory response and, consequently, potentially polarizing CRP and ESR values for infection and activity, respectively. The non-existence of subjects with serositis in the activity fever group could also accentuate this polarization and difference between the two groups; this constitutes a limitation. However, it is the condition of hospitalized patients that allows timely measurement of CRP and ESR, which in turn becomes a strength. Finally, an increased value of the study is the finding of certain discrimination markers that deserve further exploration in future clinical research, such as the C3 and C4 complement fractions.
In conclusion, with the findings presented, a new diagnostic aid is offered in the Peruvian context for patients with SLE and fever admitted for study and management. An active search for hidden infection is suggested in any patient with SLE and fever, especially with a PCR ≥ 5.4 mg/dl. Likewise, it is suggested to assess the timely management of immunosuppressants if the ESR/CRP ratio ≥21.4.
Data availabilityThe databases generated or analyzed during this research are available through the corresponding author, upon reasonable and justified request.
FinancingThis research was financed by the researchers through their resources or the support of the institutions to which they are linked. These institutions did not influence the design of the study, data collection, analysis, data interpretation, writing of the article, or the decision to submit it for publication.
Conflict of interestsThe authors declare the absence of any conflict of interest.
The authors wish to express their gratitude to HNERM, which, through its representatives and authorities, provided access, facilities, and authorization for the execution of this research. They also thank the University of Huánuco for academic and administrative support. Finally, they thank Dr. José Chávez Corrales for the contributions initially provided.
