


The aim of this study is to determine whether there is a significant difference between types of diversification and performance values comparing Turkey and Italy. Diversification strategy and organizational performance relationship seem to differ across the developed and developing countries under stable conditions. The research aimed to identify the effect of institutional diversification on organizational performance was carried out on the businesses in Turkey and Italy. The data of 418 business groups in Italy and 128 business groups in Turkey were analyzed. The data of 2007–2011 were used in the research. According to the results of the study, when organizational performance values are high for single businesses and unrelated diversification in Turkey, organizational performance is high for dominant businesses and related diversification in Italy. Accordingly, organizational performance is increased by environmental factors in Turkey and by internal factors in Italy.
Corporate diversification has remained an important strategy for many firms worldwide for the last half century. It may not be considered as just a trend; rather it is based on logical reasons. These reasons include increased profitability, reduction in risk, increased market share, increased debt capacity, higher growth, extension of business life cycle, and efficient utilization of human and financial resources. Many writers proved diversification to be a successful strategy in their studies but still a number of researches are having different views (Afza, Slahudin, & Nazir, 2008). Palich, Cardinal, and Miller (2000) suggested that there has been inconsistency in the findings of the diversification–performance research for more than 30 years and there is a lack of consensus. Some of empirical findings were either a positive relationship with economic performance (Pandaya & Rao, 1998; Piscitello, 2004; Singh, Mathur, Gleason, & Etebari, 2001), a negative relationship with economic performance (Gary, 2005; Lins & Servaes, 2002; Markides, 1995), a curvilinear relationship depending on the level of diversification (Kakani, 2000; Palich et al., 2000; Varadarajan & Ramanujam, 1987) or lack of a relationship (Grant, Jammine, & Thomas, 1988; Montgomery, 1985).
All of these mixed and inconclusive empirical research evidences have led to a need for researchers examining how diversification strategy affects firm performance in different institutional environments and market conditions. In accordance with this need, the primary motivation of this study is to examine the relationship between diversification strategy and organizational performance in developed and emerging economy contexts. Thus we analyze and compare how diversification affects organizational performance in Turkey as an emerging economy and in Italy a developed economy.
2Conceptual frameworkInvestigations into the relationship between diversification strategy and organizational performance represent one of the most actively investigated areas in the fields of strategy and finance (Chakrabarti, Singh, & Mahmood, 2007; Hoskisson & Hitt, 1990; Kakani, 2000; Khanna & Palepu, 2000; Miller, 2004; Montgomery, 1994; Rumelt, 1974). However, despite the enormous interest in the field, the debate on whether corporate diversification creates or destroys value remains inconclusive with several studies offering differing results on the phenomena among different institutional context (Rejie, 2007) and market conditions.
The outcomes of firm diversification will vary across countries, because of the influence of the institutional environment within which diversification takes place. Khanna and Palepu (1997) suggested that the degree of market and institutional development is an important determinant of the efficacy of diversification. In general, the potential returns from diversification decrease with market and institutional development, so that diversification would not improve firm performance in perfect markets. So it is expected that firms in less institutionally developed economies will benefit more substantially from diversification than firms in more institutionally developed economies (Chakrabarti et al., 2007).
2.1Diversification–performance relationship in emerging economy contextSeveral studies propose that diversification strategy is more likely to be profitable in emerging economies (Guillen, 2000; Khanna & Palepu, 1997; Kock & Guillen, 2001). The underlying argument is that key aspects of institutional environments in emerging economies are the lack of well-established product markets, financial markets and labor markets, privatization policies, coupled with the lack of necessary laws and regulations and inconsistent enforcement of contracts (Anil, Yigit, & Canel, 2013; Yigit & Behram, 2013). More specifically, to cope effectively with this institutional environment companies may wish to pursue unrelated diversification strategy as an effective means of gaining self-generated institutional support. Consequently, the nature of the institutional environment and the resultant need for firms to employ an unrelated diversification strategy element in a poorly structured institutional environment constitute the institutional environment management explanation of the diversification and performance relationship (Li & Wong, 2003). In Turkey, recent privatization policies are an example of the situation. Acceleration on the privatization policies in Turkey creates an opportunity for businesses which want to invest in new areas. After all, a profitable public enterprise can be sold regardless of being related or unrelated to a company's current industry (Colpan & Hikino, 2008; Karaevli, 2008).
Khanna and Palepu (1997, 2000) argue that greater diversification may not harm performance in emerging economies because of insufficient market and institutional development. By diversifying, firms create internal markets that may be more effective than inefficient external markets. These firms enjoy scope and scale advantages from internalizing functions provided by external intermediaries or institutions in advanced economies. As intermediaries are often absent or inefficient in developing economies, internalization may be viable and profitable (Chakrabarti et al., 2007). Lins and Servaes (2002) also argued that in institutionally developing economies, the absence or inefficiency of external intermediate institutions results in firms developing these institutions internally, which helps firms to lower their costs. Thus, internalization in less developed institutional environments would bring about greater net marginal benefits (Purkayastha, Manolova, & Edelman, 2012).
2.2Diversification–performance relationship in developed economy contextRecent evidence indicates that corporate diversification has not enhanced the value of firms in the US, the UK, Germany and Japan (Berger & Ofek, 1995; Lang & Stulz, 1994; Lins & Servaes, 1999; Servaes, 1996). The evidence in these papers suggests that, for the average firm operating in developed capital markets, the costs of diversification outweigh the benefits (Lins & Servaes, 2002).
Efficient markets in developed economies detect and penalize diversification costs more than the less efficient markets of institutionally developing economies. This may be because the internal intermediate institutions of diversified firms in developed economies cannot match the efficiency levels of open market institutions. Diversified firms thus have higher costs, which results in lowering their performance (Purkayastha et al., 2012; Leaven & Levine, 2007; Villalonga, 2004).
According to the transaction cost theory based explanation, most developed economies have strong and well developed institutions with efficient product, labor and capital markets. Hence, the market structure would be a much more efficient mechanism for transactions. In this light, there are higher costs associated with diversified firm structure and therefore it is predicted that conglomerates would be poor performers in strong and mature market (Mishra & Akbar, 2007). Diversification has some limits for businesses. Collections of different businesses should restructure their organizations because management costs can be inadequate (Froelich & McLagan, 2008). Yet, transaction cost predicts that diversified group structure is a beneficial organization form in emerging economies (Mishra & Akbar, 2007).
Resource-based-view theorists argue that diversification in developed economies would be efficient if it were based on specific resources, rather than generic resources, so that synergistic benefits from economies of scope can be exploited (Purkayastha et al., 2012). Therefore, related diversification will be more successful than unrelated diversification (Froelich & McLagan, 2008). Purkayastha et al. (2012) argued that in developed economies, only firm-specific resources would lead to sustainable competitive advantage, and hence firms should concentrate on one industry or at best on a limited number of related industries.
2.3Risks and disadvantages of diversification strategyThe severe market imperfections also increase the potential agency costs associated with diversification and according to agency theory, diversification strategy influences financing decisions (Lim, Das, & Das, 2009). Higher asymmetric information might allow management and large stakeholders to more easily exploit the firm for their own purposes. Such opportunities for exploitation are likely exacerbated when the rule of law is weak, which makes contract enforcement difficult; when accounting standards are poor; and when shareholders have fewer rights. Such imperfections make it easier for diversified firms to engage in empire building (Cretu, 2012; Lins & Servaes, 2002).
One of the reasons for the failure of corporate diversification strategies stands out as the bureaucratic costs. It is possible to examine bureaucratic costs under two main headings. These are the number of businesses in portfolio and costs of coordination between businesses (Anil et al., 2013).
Number of businesses: Increases in the number of businesses in the company's portfolio may result in top executives’ loss of control almost because of not having all the data required for rationale decision-making (Hoskisson, Hitt, & Charles, 1991). In this case top managers cannot allocate resources as needed by each separate unit (Hill & Jones, 1998).
Coherence between businesses: Transfer of resources between the strategic business units requires an effective coordination system. Since the processes will be filled with bureaucratic procedures, increasing number of businesses in company's portfolio has an obstructive effect on determination, transfer and share of resources required by the units (Hill & Jones, 1998).
Routine activities and procedures in a growing majority of organizations appear as an element of cost, and the difficulty of changing these processes can result in deteriorated business performance (Hoskisson et al., 1991) and the effect of fundamental changes may lead to problems deeper and more complicated (Hill & Jones, 1998).
3Methodology of research3.1Aim and universe of the studyThe aim of this research is to determine whether there is a significant difference between types of diversification and performance values comparing Turkey and Italy. The research aimed to identify the effect of institutional diversification on organizational performance was carried out on the businesses in Turkey and Italy, so the data of the businesses operating in Turkey were obtained from “www.imkb.gov.tr” and “www.kap.gov.tr” and the data of businesses operating in Italy were obtained from Bloomberg data base. The data of 418 business groups in Italy and 128 business groups in Turkey were analyzed. The data of 2007–2011 were used in the research. SPSS 14 package was used to analyze the data.
3.2Variables and measurement methods of the researchThe independent variable of this research is the measures of diversification and organizational performance is used as dependent variable.
Diversification measure: in this research Rumelt's classification is used for measuring diversification. According to Rumelt's measure of diversification; Specialization Ratio – SR: the ratio of the strategic business unit or group with the highest revenue to total revenues of the company, Relationship Ratio (Related Ratio – RR): denotes to, analyzing the amount of revenues, the status of interrelatedness of the areas of the strategic business units that make up this amount; Rumelt's Measure of Diversification; Single Company (SR≥0.95), Dominant Company (0.95>SR≥0.70), Related Company (SR<0.70 and RR>0.70), Unrelated Company (SR<0.70 and RR<0.70). The distinction between the designated categories of related and unrelated strategic business units is made within the framework 4-digit and 2-digit SIC code. According to this distinction, the companies which are associated with a 4-digit, were considered related and 2-digit ones were considered unrelated. As stated earlier, in majority of prior studies (Busija, O’Neill, & Zeithaml, 1997; Chakrabarti et al., 2007; Markides & Williamson, 1994; Markides, 1995; Palepu, 1985; Rumelt, 1982) SIC code within Rumelt's classification is used for the related-unrelated discrimination.
Organizational performance: Analysis to measure organizational performance, financial measures utilized and reasons for using these measures are summarized below.
Researches in which performance is measured by ROA (return on assets): ROA is accepted as an important indicator to measure the effectiveness of management by the researchers that measure organizational performance by ROA value only. In addition, external shareholders and business managers who need the performance of the business organization express that ROA is a sufficient criterion to evaluate the performance of organization (Dubofsky & Varadarajan, 1987; Hill, Hitt, & Hoskisson, 1992; Kim, Hwang, & Burgers, 1993; Ravichandran, Liu, Han, & Hasan, 2009; Tihanyi, Johnson, Hoskisson, & Hitt, 2003). On the other hand, according to Rumelt, Christensen and Montgomery ROA is a standardized measure of performance (Dubofsky & Varadarajan, 1987). This rate shows to what extent the assets are used effectively in other words how much revenue can a company make over its assets.
Researches in which performance is measured by ROS (return on sales): The reason that researchers use the ROS value only or with other financial measures for organizational performance is that the ROS ratio is calculated after deducting taxes and other expenses. The ROS value is accepted as an important factor in measuring the efficiency of operational activities (Markides, 1995, 1996; Markides & Williamson, 1994; Palepu, 1985).
3.3The hypothesis of studyInstitutional gaps, an excess of environmental opportunities and lack of perfect competition conditions in Turkey are considered to make the performance of unrelated and single diversified businesses higher while resources and skills increase the performance of related diversification and dominant businesses in Italy. Therefore, the hypotheses of the study are as below:
H1: Single businesses’ organizational performance is higher in Turkey than in Italy.
H2: Dominant businesses’ organizational performance is higher in Italy than in Turkey.
H3: Related diversification's organizational performance is higher in Italy than in Turkey.
H4: Unrelated diversification's organizational performance is higher in Turkey than in Italy.
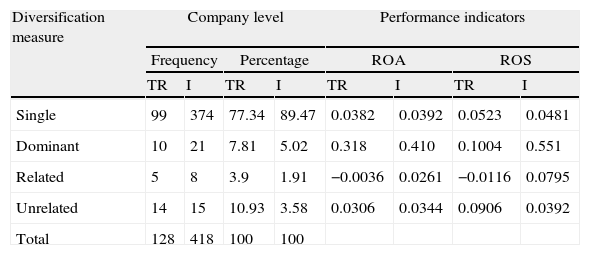
In Table 1, the frequencies according to the extent of diversification, operating frequency and indicators of the average performance in each measure of diversification of the enterprises within the research, are presented. As table illustrates, in the 2007–2011 period, 99 companies of the total 128 in Turkey are single businesses, 5 of the companies are related diversified. Based on the data, single businesses have the highest ratio of 77.34% among the groups. As table illustrates, in the 2007–2011 period, 374 companies of the total 418 in Italy are single businesses, 8 of the companies are related diversified. Based on the data, single businesses have the highest ratio of 89.47% among the groups.
Frequencies for diversification in 2007–2011 period, ROA, ROS values.
| Diversification measure | Company level | Performance indicators | ||||||
| Frequency | Percentage | ROA | ROS | |||||
| TR | I | TR | I | TR | I | TR | I | |
| Single | 99 | 374 | 77.34 | 89.47 | 0.0382 | 0.0392 | 0.0523 | 0.0481 |
| Dominant | 10 | 21 | 7.81 | 5.02 | 0.318 | 0.410 | 0.1004 | 0.551 |
| Related | 5 | 8 | 3.9 | 1.91 | −0.0036 | 0.0261 | −0.0116 | 0.0795 |
| Unrelated | 14 | 15 | 10.93 | 3.58 | 0.0306 | 0.0344 | 0.0906 | 0.0392 |
| Total | 128 | 418 | 100 | 100 | ||||
First, to decide on the statistical test, normal distribution analysis (one sample KS; and histograms) was applied. Non-parametric analysis was chosen because the results were not normal. Mann–Whitney U test was applied in order to see if there is a significant difference between organizational performance and each Rumelt's diversification measures. The tables are for comparing Turkey and Italy.
4.1Diversification strategy (single businesses) and organizational performance4.1.1Diversification strategy (single businesses) and return on assets (ROA) (Table 2)There is no significant difference in performance (ROA) between Turkey and Italy (p=0.05). Yet, it is seen that the performance values of single businesses in Turkey are higher than in Italy when the median values are examined.
2007–2011 period diversification strategy (single businesses) and return on assets (ROA).
| Country | N | Median | Mean | Std. deviation | Mann–Whitney U | 17918.000 |
| Turkey | 99 | 0.0358 | 0.0382 | 0.0668 | Wilcoxon W | 88043.000 |
| Italy | 374 | 0.0337 | 0.0392 | 0.0801 | Z | −0.492 |
| Total | 473 | – | – | – | Sig. (2-tailed) | 0.623 |
H1 was refused for ROA.
No significant difference in performance (ROS) was found between Turkey and Italy (p=0.05). Also, the performance values in Italy are higher than in Turkey according to the median values.
2007–2011 period diversification strategy (single businesses) and return on sales (ROS).
| Country | N | Median | Mean | Std. deviation | Mann–Whitney U | 17262.000 |
| Turkey | 99 | 0.0347 | 0.0523 | 0.1194 | Wilcoxon W | 22212.000 |
| Italy | 374 | 0.0578 | 0.0481 | 0.1445 | Z | −1.034 |
| Total | 473 | – | – | Sig. (2-tailed) | 0.301 |
H1 was refused for ROS.
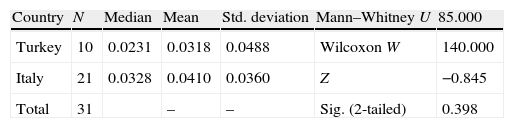
Turkey and Italy does not show any significant difference in organizational performance (p=0.05), but the average and median values show that the performance values of dominant businesses in Italy are higher than in Turkey.
2007–2011 period diversification strategy (dominant businesses) and return on assets (ROA).
| Country | N | Median | Mean | Std. deviation | Mann–Whitney U | 85.000 |
| Turkey | 10 | 0.0231 | 0.0318 | 0.0488 | Wilcoxon W | 140.000 |
| Italy | 21 | 0.0328 | 0.0410 | 0.0360 | Z | −0.845 |
| Total | 31 | – | – | Sig. (2-tailed) | 0.398 |
H2 was refused for ROA.
There is no significant difference in performance (ROS) between Turkey and Italy (p=0.05), but when the average and median values are examined, it is understood that the performance values of dominant businesses in Italy are higher than in Turkey.
2007–2011 period diversification strategy (dominant businesses) and return on sales (ROS).
| Country | N | Median | Mean | Std. deviation | Mann–Whitney U | 102.000 |
| Turkey | 10 | 0.0354 | 0.1004 | 0.1670 | Wilcoxon W | 333.000 |
| Italy | 21 | 0.0473 | 0.0551 | 0.1087 | Z | −0.127 |
| Total | 31 | – | – | Sig. (2-tailed) | 0.899 |
H2 was refused for ROS.
While there is no significant difference in performance (ROA) between Turkey and Italy (p=0.05), according to the average and median values, the performance values of related businesses in Italy are higher than in Turkey.
2007–2011 period diversification strategy (related diversification) and return on assets (ROA).
| Country | N | Median | Mean | Std. deviation | Mann–Whitney U | 13.000 |
| Turkey | 5 | −0.0076 | −0.0036 | 0.0446 | Wilcoxon W | 28.000 |
| Italy | 8 | 0.0228 | 0.0261 | 0.0413 | Z | −1.025 |
| Total | 13 | – | – | Sig. (2-tailed) | 0.306 |
H3 was refused for ROA.
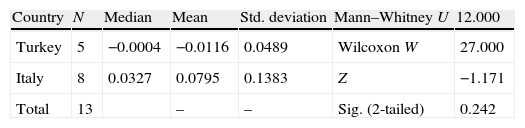
Also, there is no significant difference in performance (ROS) between Turkey and Italy (p=0.05). However, it is understood that the performance values of related businesses in Italy are higher than in Turkey examining the average and median values.
2007–2011 period diversification strategy (related diversification) and return on sales (ROS).
| Country | N | Median | Mean | Std. deviation | Mann–Whitney U | 12.000 |
| Turkey | 5 | −0.0004 | −0.0116 | 0.0489 | Wilcoxon W | 27.000 |
| Italy | 8 | 0.0327 | 0.0795 | 0.1383 | Z | −1.171 |
| Total | 13 | – | – | Sig. (2-tailed) | 0.242 |
H3 was refused for ROS.
There is no significant difference in performance (ROA) between Turkey and Italy (p=0.05), but when the average and median values are examined, it is understood that the performance values of unrelated businesses in Turkey are higher than in Italy.
2007–2011 period diversification strategy (unrelated diversification) and return on assets (ROA).
| Country | N | Median | Mean | Std. deviation | Mann–Whitney U | 101.000 |
| Turkey | 14 | 0.0444 | 0.0306 | 0.0581 | Wilcoxon W | 221.000 |
| Italy | 15 | 0.0364 | 0.0344 | 0.0382 | Z | −0.175 |
| Total | 29 | – | – | Sig. (2-tailed) | 0.861 |
H4 was refused for ROA.
There is no significant difference in performance (ROS) between Turkey and Italy (p=0.05). However, it is understood that the performance values of unrelated businesses in Turkey are higher than in Italy when the average and median values are examined.
2007–2011 period diversification strategy (unrelated diversification) and return on assets (ROS).
| Country | N | Median | Mean | Std. deviation | Mann–Whitney U | 94.000 |
| Turkey | 14 | 0.0563 | 0.0906 | 0.2072 | Wilcoxon W | 214.000 |
| Italy | 15 | 0.0531 | 0.0392 | 0.1044 | Z | −0.480 |
| Total | 29 | – | – | Sig. (2-tailed) | 0.631 |
H4 was refused for ROS.
When the results are considered in terms of Hypothesis 1, the average of performance indicators in Turkey is higher than in Italy for single business. When the results are considered in terms of Hypothesis 4, the average of performance in Turkey is higher than in Italy for unrelated diversification. These analyses of the research reveal that the performance averages only by the developing countries seem to have similar characteristics. As emphasized by the researches mentioned above concerning the developing countries, the reason for such insignificance appears to stem from conditions that are thought to be differentiated in Turkey. The relationship between diversification and performance is thought to be affected by factors such as some of the privatization policies in Turkey, working conditions, crises conditions that coincide with the period of research, absence of perfect competition conditions markets in Turkey, some sectors in developing countries being at the end of product life cycle curve while being at point of entry in Turkey.
To see if related diversification-organizational performance relationship is different in Turkey and Italy, Hypothesis 3 was suggested. When the results are considered in terms of Hypothesis 3, the average of performance in Italy is higher than in Turkey for related diversification. Also, in terms of dominant businesses (Hypothesis 2), the average organizational performance in Italy is higher than in Turkey. However, this finding is at an average level and there is no statistically significant result. Rumelt's dominant business category includes related diversification partially. It is considered that the business groups of Italy prefer diversification focusing on the internal resources rather than environmental opportunities because of high averages and results similar to developed countries in the literature.
On the other hand, when the results are considered in general, they are in accordance with the hypotheses in consideration of median values although there is not significant difference in hypotheses. The reason why the results are not at the level of statistical significance is based on the study period because this study has coincided with the period of economic crisis that existed in the world and Italy is a developed country which was significantly affected by this crisis.
Within the framework of the results emerging from this study, the following recommendations are proposed to researchers and executives:
- •
A similar study involved more countries can also be carried out by researchers. Also, some variables such as crisis conditions, agency problems, business growth, national income and trend rate of gross national product growth could also be considered.
- •
The same studies can be carried out using only Entropy Index or both Rumelt's diversification measure and Entropy Index.
- •
In order to separate related and unrelated diversification 2-digit SIC was used in this study. Another study where 3-digit is used for this separation can be carried out.
