


Various polymorphisms in the beta-2 adrenergic receptor (ADRB2) gene have been associated with cardiometabolic risk factors, such as hypertension, dyslipidemia, type 2 diabetes mellitus and obesity contributing to the physiopathology of these chronic conditions. However, the association of the single nucleotide polymorphism (SNP) rs12654778 at the ADRB2 gene with metabolic changes has been poorly studied and there is no information on the Chilean adult population.
ObjectiveTo investigate the association between the rs12654778 SNP at the ADRB2 gene with cardiometabolic risk markers in a Chilean adult population.
MethodsWe conducted a cross-sectional study including 404 participants from the GENADIO study whom were genotyped for rs12654778 and categorized into GG, AG, and AA genotypes. Associations with cardiometabolic risk markers, such as blood pressure, total cholesterol, high-density lipoprotein cholesterol, low-density lipoprotein cholesterol, triglycerides, blood glucose and insulin were examined using multivariate regression analysis, while statistical models were adjusted for sociodemographic and lifestyle variables.
ResultsOur findings indicate a significant association between the presence of the protective genotype (AA) of the rs12654778 polymorphism and lower low-density lipoprotein cholesterol levels corresponding to 8.75mg/dL per each copy of the protective allele (maximally adjusted model). No significant associations were seen for the remaining variables.
ConclusionThe AA genotype of the rs12654778 SNP at the ADRB2 gene had a protective effect specifically against low-density lipoprotein cholesterol levels. This is the first study ever conducted in Chile on this SNP of ADRB2 and one of the few conducted worldwide to establish an association between the rs12654778 SNP at the ADRB2 gene and LDL cholesterol.
Varios polimorfismos en el gen del receptor the beta-2 adrenérgico (ADRB2) han sido asociados a factores cardiometabólicos, como hipertensión, dislipidemia, diabetes tipo 2 y obesidad, contribuyendo a la fisiopatología de dichas condiciones crónicas. Sin embargo, la asociación del polimorfismo de un nucleótido (SNP) rs12654778 del gen ADRB2 con alteraciones metabólicas ha sido pobremente estudiada, sin información en población chilena.
ObjetivoInvestigar la asociación del SNP rs12654778 del gen ADRB2 con marcadores de riesgo cardiometabólico en una población chilena adulta.
MétodosSe trata de un estudio de corte transversal con 404 participantes del estudio GENADIO. Los individuos fueron genotipificados para rs12654778 y categorizados en genotipos GG, AG y AA. Se analizó su asociación con marcadores de riesgo cardiometabólico como presión arterial total, colesterol total, colesterol en lipoproteína de alta densidad, colesterol en lipoproteína de baja densidad, triglicéridos, glucosa e insulina mediante análisis de regresión multivariado, usando modelos estadísticos ajustados por variables sociodemográficas y de estilo de vida.
ResultadosNuestros resultados indican una asociación significativa entre la presencia del genotipo protector (AA) del polimorfismo rs12654778 y los niveles de colesterol en lipoproteína de baja densidad, correspondiente a 8,75mg/dl menos por cada copia del alelo protector (modelo máximamente ajustado). No se observaron asociaciones significativas para las otras variables.
ConclusiónEl genotipo AA del SNP rs12654778 del gen ADRB2 presenta efecto protector específicamente sobre los niveles de colesterol en lipoproteína de baja densidad. Este es el primer estudio en Chile que incluye este SNP del gen ADRB2 y uno de los pocos realizados a nivel mundial que establece asociación entre el SNP rs12654778 del gen ADRB2 y colesterol LDL.
Cardiovascular diseases (CVDs) were responsible for 31% of all deaths reported worldwide in 2015,1 while in the Americas, they are the leading cause of death, with 50% of these cases being attributed to hypertension.2 Worldwide, hypertension affects 30% of the population,3 and in Chile, 27.6% of the population.4 Additionally, CVDs account for 24.5% of all deaths reported in Chile.4
The beta-adrenergic receptor (ADRB) belongs to the G-protein-coupled receptor superfamily and comprises three isoforms: ADRB1, ADRB2, and ADRB3.5,6ADRB2 is ubiquitously expressed and activated via binding with the catecholamines norepinephrine and epinephrine.7,8ADRB2 activation initiates the cyclic adenosine monophosphate/protein kinase A pathway, regulating adipocyte lipolysis, calcium channel opening, and transcription factor activation in diverse cell types.9,10 The ADRB2 gene is highly polymorphic, featuring over a thousand identified genetic variants, including single nucleotide polymorphisms (SNPs). Notably, three SNPs located inside the gene coding sequence have been identified: rs104213 (Arg16Gly), rs1042714 (Gln27Glu), and rs1800888 (Thr164Ile). These SNPs have been associated with cardiometabolic risk markers, although their effects vary depending on the population's sex, ethnicity, and underlying diseases.10–13 For instance, rs1042714 has been associated with increased diastolic blood pressure (DBP) in the Malay adult population.13 In this group, it was also associated with hypertriglyceridemia, but solely in men. Furthermore, it was associated with obesity, elevated insulin levels, and the HOMA-IR (Homeostatic Model Assessment of Insulin Resistance) in the African-American population, not in Caucasian American population.14 Another variant – rs1042713 – was associated with hypertriglyceridemia in hypertensive Chinese individuals.15
Regarding SNPs located in the 5′-regulatory region of ADRB2, only rs11168070 (−480C/G) has been associated with cardiometabolic risk markers such as hypertension and higher HOMA-IR scores in the Chinese-Kazakh population.16 Other regional SNPs, including rs12654778 (−654G/A), have been associated with bronchopulmonary diseases but not cardiometabolic risk markers.16–18
SNPs present in the ADRB2 coding region cause receptor expression and function changes, whereas those in the promoter region – including rs12654778 – modify gene promoter activity binding to transcription factors.10,17,18
Given these considerations, this study aimed to investigate the association of the rs1265478 SNP of the ADRB2 gene with cardiometabolic biomarkers in a Chilean adult population without a history of CVDs, using data from the Genes, Environment, Diabetes, and Obesity (GENADIO) population study.
Materials and methodsStudy designWe conducted a cross-sectional study, with participants from the GENADIO population study in Chile from 2009 through 2011 to assess the prevalence of cardiovascular risk factors in an ethnically diverse sample of 472 participants of Mapuche and European descent, residing in the Biobío and Los Ríos regions, Chile. These participants had no past medical history of metabolic diseases or cardiovascular diseases in their health records and were not on any drugs at the time of evaluation, which included a total of 404 genotyped participants with available information on the ADRB2 gene rs12654778 SNP.
Determination of ADRB2 (beta-2 adrenergic receptor) allelic variantsGenomic DNA was extracted from peripheral leukocytes using the QIAamp DNA Blood Kit (QIAGEN Ltd, UK) and quantified using a NanoDrop ND-8000. Allelic discrimination was performed through real-time polymerase chain reaction using the ABI 7900-HT thermocycler. The rs12654778 SNP genotyping was conducted using a commercial TaqMan® assay (Applied Biosystems, Warrington, United Kingdom) (Assay ID: C_39187056_10). All analyses were conducted in duplicate, with a 98% success rate in genotype determination.
Adiposity markersAnthropometric measurements were taken by qualified professionals using standardized protocols.19 Body weight and height were measured using an electronic scale (Tanita® TBF 300a, United States) and a stadiometer (Seca® A800, United States), with an accuracy of 100g and 1mm, respectively. Waist circumference (WC) was measured using a non-distensible measuring tape (Seca® Model 201, United States). Nutritional status was categorized based on the World Health Organization body mass index (BMI) cutoff points for adults.20 Central obesity was defined using WC cutoff points of ≥102cm for men and ≥88cm for women.20 Body composition was determined by measuring four skinfold thicknesses (biceps, subscapular, suprailiac, and triceps) using a Harpenden skinfold caliper (Cranlea & Company, Birmingham, United Kingdom) following the clinical practice guidelines established by the International Society for the Advancement of Kinanthropometry.21 The percentage (%) of body fat was calculated using the Durnin and Womersley equation.22
Blood pressure, lipid biomarkers, and other cardiometabolic risk markersBlood samples were obtained via venipuncture after a 10–12-h fasting period. Basal glucose, total cholesterol (TC), high-density lipoprotein cholesterol (HDLc), and triglycerides (TG) were determined using endpoint enzymatic methods (Roche Diagnostics GmbH, Mannheim, Germany). Low-density lipoprotein cholesterol (LDLc) was calculated using Friedewald equation.23 Insulin levels were determined using an enzyme-linked immunosorbent assay (Diagnostic System Labs, TX, United States). Each measurement was taken in duplicate, and the mean was recorded. Systolic blood pressure (SBP) and DBP were measured using an automatic blood pressure monitor in a supine position after a 10-min period of rest (Omron M10-IT Healthcare UK Limited, Milton Keynes, United Kingdom).
Sociodemographic and lifestyle variablesAll sociodemographic data was collected through self-report validated surveys23 including age, gender, geographic area, educational level, and lifestyle-related information such as smoking, physical activity and dietary habits. Participants of Mapuche or European descent were selected, while individuals of mixed ancestry were excluded. Ethnicity was determined based on paternal and maternal surnames associated with the prevalence of erythrocyte antigen ethnic markers.
Physical activity (PA) was estimated using accelerometers (Actigraph GTM1, United States). Macronutrient consumption was assessed via a 7-day food diary where foods were weighed before consumption using a Seca® kitchen scale. Macronutrient consumption was determined using the Chilean Food Composition Database through the MINUTA Software from the Universidad de Concepción.
Statistical analysesThe study population characteristics were expressed as mean and standard deviation (SD) for continuous variables and as percentages for the categorical ones. The normality of these variables was verified using the Anderson–Darling test. The SNP rs12654778 of the ADRB2 gene was coded following an additive genetic model: 0=GG – homozygous for the major allele; 1=AG – heterozygous for the minor one; 2=AA – homozygous for the minor allele. Linear regression analyses were conducted to investigate the associations between the rs12654778 polymorphism of the ADRB2 gene (independent variable) and the respective outcomes: cardiometabolic risk factors (glycemia, insulin, TC, LDLc, HDLc, TG; and blood pressure [DBP and SBP]).
All statistical models were adjusted for confounding variables using four statistical models. Model 0 – unadjusted; Model 1 – adjusted for age, gender, ethnicity, and geographical region (urban/rural); Model 2 – adjusted for Model 1 plus smoking and PA; Model 3 – adjusted for Model 2 plus WC and body fat percentage. Results were expressed as standardized beta coefficients and their respective 95% confidence intervals (95% CI).
The Hardy–Weinberg equilibrium distribution of ADRB2 gene alleles was estimated using the chi-square test. STATA SE v14 software was used for all analyses. The significance level was defined as p<0.05.
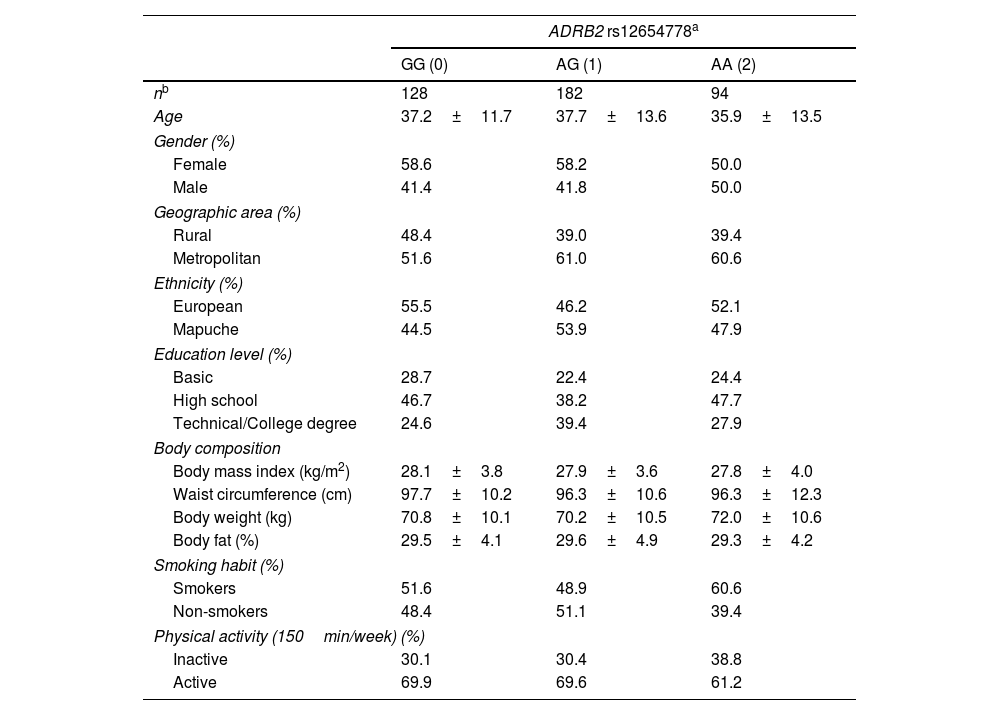
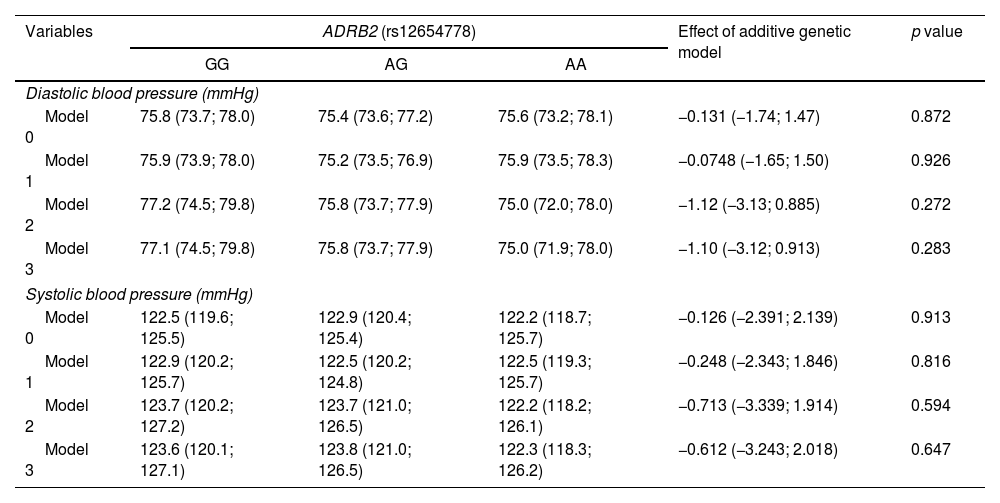
ResultsThe general characteristics of the participants are presented based on genotype (GG, AG, and AA) in Table 1. No differences were observed in sociodemographic variables or parameters such as PA or smoking among individuals with AG and AA genotypes vs the GG genotype group. Table 2 shows the observed frequencies for the rs12654778 genotypes according to Hardy–Weinberg equilibrium (p value for chi-square test of 0.9). Prevalence rates of 32%, 45%, and 23% were observed for GG, GA, and AA genotypes, respectively. The association between the rs12654778 SNP at the ADRB2 gene and blood pressure variables is shown in Table 3. In the unadjusted model (Model 0), no significant changes associated with SBP or DBP were reported (p=0.872 and p=0.913, respectively). No statistically significant changes were seen either after adjusting for confounding variables (Model 1, Model 2, and Model 3).
Population characteristics according to ADRB2 rs12654778 genotype.
| ADRB2 rs12654778a | |||
|---|---|---|---|
| GG (0) | AG (1) | AA (2) | |
| nb | 128 | 182 | 94 |
| Age | 37.2±11.7 | 37.7±13.6 | 35.9±13.5 |
| Gender (%) | |||
| Female | 58.6 | 58.2 | 50.0 |
| Male | 41.4 | 41.8 | 50.0 |
| Geographic area (%) | |||
| Rural | 48.4 | 39.0 | 39.4 |
| Metropolitan | 51.6 | 61.0 | 60.6 |
| Ethnicity (%) | |||
| European | 55.5 | 46.2 | 52.1 |
| Mapuche | 44.5 | 53.9 | 47.9 |
| Education level (%) | |||
| Basic | 28.7 | 22.4 | 24.4 |
| High school | 46.7 | 38.2 | 47.7 |
| Technical/College degree | 24.6 | 39.4 | 27.9 |
| Body composition | |||
| Body mass index (kg/m2) | 28.1±3.8 | 27.9±3.6 | 27.8±4.0 |
| Waist circumference (cm) | 97.7±10.2 | 96.3±10.6 | 96.3±12.3 |
| Body weight (kg) | 70.8±10.1 | 70.2±10.5 | 72.0±10.6 |
| Body fat (%) | 29.5±4.1 | 29.6±4.9 | 29.3±4.2 |
| Smoking habit (%) | |||
| Smokers | 51.6 | 48.9 | 60.6 |
| Non-smokers | 48.4 | 51.1 | 39.4 |
| Physical activity (150min/week) (%) | |||
| Inactive | 30.1 | 30.4 | 38.8 |
| Active | 69.9 | 69.6 | 61.2 |
Data expressed as mean and SD for continuous variables and as percentages for categorical variables.
Association between ADRB2 rs12654778 genotype and blood pressure.
| Variables | ADRB2 (rs12654778) | Effect of additive genetic model | p value | ||
|---|---|---|---|---|---|
| GG | AG | AA | |||
| Diastolic blood pressure (mmHg) | |||||
| Model 0 | 75.8 (73.7; 78.0) | 75.4 (73.6; 77.2) | 75.6 (73.2; 78.1) | −0.131 (−1.74; 1.47) | 0.872 |
| Model 1 | 75.9 (73.9; 78.0) | 75.2 (73.5; 76.9) | 75.9 (73.5; 78.3) | −0.0748 (−1.65; 1.50) | 0.926 |
| Model 2 | 77.2 (74.5; 79.8) | 75.8 (73.7; 77.9) | 75.0 (72.0; 78.0) | −1.12 (−3.13; 0.885) | 0.272 |
| Model 3 | 77.1 (74.5; 79.8) | 75.8 (73.7; 77.9) | 75.0 (71.9; 78.0) | −1.10 (−3.12; 0.913) | 0.283 |
| Systolic blood pressure (mmHg) | |||||
| Model 0 | 122.5 (119.6; 125.5) | 122.9 (120.4; 125.4) | 122.2 (118.7; 125.7) | −0.126 (−2.391; 2.139) | 0.913 |
| Model 1 | 122.9 (120.2; 125.7) | 122.5 (120.2; 124.8) | 122.5 (119.3; 125.7) | −0.248 (−2.343; 1.846) | 0.816 |
| Model 2 | 123.7 (120.2; 127.2) | 123.7 (121.0; 126.5) | 122.2 (118.2; 126.1) | −0.713 (−3.339; 1.914) | 0.594 |
| Model 3 | 123.6 (120.1; 127.1) | 123.8 (121.0; 126.5) | 122.3 (118.3; 126.2) | −0.612 (−3.243; 2.018) | 0.647 |
Data expressed as mean and 95% CI according to genotype. The additive genetic model indicates the mean increase in the exposure variable for each additional copy of the risk variant (A). This additive effect and its corresponding 95% CI were determined by using linear regression. Analyses were adjusted for: Model 0 – unadjusted; Model 1 – adjusted for age, gender, ethnicity, and geographic area (metropolitan/rural); Model 2 – adjusted for Model 1+smoking habit and physical activity; Model 3 – adjusted for Model 2+body composition and percentage of body fat.
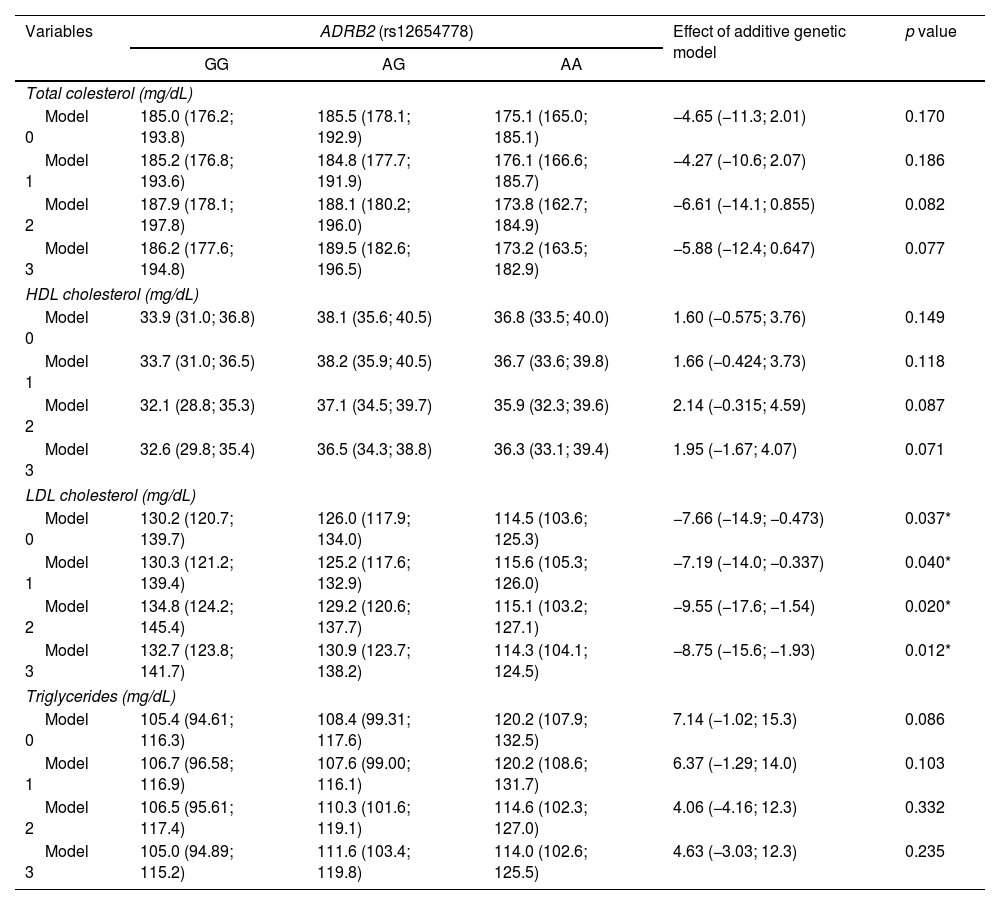
The results of the association between the rs12654778 SNP of the ADRB2 gene and lipid biomarkers are presented in Table 4. No association were observed between the rs12654778 SNP and the following lipids profile biomarkers: TC (p=0.170), HDLc (p=0.149), and TG (p=0.086) in the unadjusted model (Model 0). Similar results were observed when analyses were adjusted for Model 1, 2 and 3. Regarding LDLc, a drop of 7.66mg/dL was observed for each additional copy of the A allele of the ADRB2 gene (p=0.037) in the unadjusted model (Model 0). This association remained significant across all models, been 8.75mg/dL in the more adjusted model (Model 3).
Association between ADRB2 rs12654778 genotype and lipid biomarkers.
| Variables | ADRB2 (rs12654778) | Effect of additive genetic model | p value | ||
|---|---|---|---|---|---|
| GG | AG | AA | |||
| Total colesterol (mg/dL) | |||||
| Model 0 | 185.0 (176.2; 193.8) | 185.5 (178.1; 192.9) | 175.1 (165.0; 185.1) | −4.65 (−11.3; 2.01) | 0.170 |
| Model 1 | 185.2 (176.8; 193.6) | 184.8 (177.7; 191.9) | 176.1 (166.6; 185.7) | −4.27 (−10.6; 2.07) | 0.186 |
| Model 2 | 187.9 (178.1; 197.8) | 188.1 (180.2; 196.0) | 173.8 (162.7; 184.9) | −6.61 (−14.1; 0.855) | 0.082 |
| Model 3 | 186.2 (177.6; 194.8) | 189.5 (182.6; 196.5) | 173.2 (163.5; 182.9) | −5.88 (−12.4; 0.647) | 0.077 |
| HDL cholesterol (mg/dL) | |||||
| Model 0 | 33.9 (31.0; 36.8) | 38.1 (35.6; 40.5) | 36.8 (33.5; 40.0) | 1.60 (−0.575; 3.76) | 0.149 |
| Model 1 | 33.7 (31.0; 36.5) | 38.2 (35.9; 40.5) | 36.7 (33.6; 39.8) | 1.66 (−0.424; 3.73) | 0.118 |
| Model 2 | 32.1 (28.8; 35.3) | 37.1 (34.5; 39.7) | 35.9 (32.3; 39.6) | 2.14 (−0.315; 4.59) | 0.087 |
| Model 3 | 32.6 (29.8; 35.4) | 36.5 (34.3; 38.8) | 36.3 (33.1; 39.4) | 1.95 (−1.67; 4.07) | 0.071 |
| LDL cholesterol (mg/dL) | |||||
| Model 0 | 130.2 (120.7; 139.7) | 126.0 (117.9; 134.0) | 114.5 (103.6; 125.3) | −7.66 (−14.9; −0.473) | 0.037* |
| Model 1 | 130.3 (121.2; 139.4) | 125.2 (117.6; 132.9) | 115.6 (105.3; 126.0) | −7.19 (−14.0; −0.337) | 0.040* |
| Model 2 | 134.8 (124.2; 145.4) | 129.2 (120.6; 137.7) | 115.1 (103.2; 127.1) | −9.55 (−17.6; −1.54) | 0.020* |
| Model 3 | 132.7 (123.8; 141.7) | 130.9 (123.7; 138.2) | 114.3 (104.1; 124.5) | −8.75 (−15.6; −1.93) | 0.012* |
| Triglycerides (mg/dL) | |||||
| Model 0 | 105.4 (94.61; 116.3) | 108.4 (99.31; 117.6) | 120.2 (107.9; 132.5) | 7.14 (−1.02; 15.3) | 0.086 |
| Model 1 | 106.7 (96.58; 116.9) | 107.6 (99.00; 116.1) | 120.2 (108.6; 131.7) | 6.37 (−1.29; 14.0) | 0.103 |
| Model 2 | 106.5 (95.61; 117.4) | 110.3 (101.6; 119.1) | 114.6 (102.3; 127.0) | 4.06 (−4.16; 12.3) | 0.332 |
| Model 3 | 105.0 (94.89; 115.2) | 111.6 (103.4; 119.8) | 114.0 (102.6; 125.5) | 4.63 (−3.03; 12.3) | 0.235 |
Data expressed as mean and 95% CI according to genotype. The additive genetic model indicates the mean increase in the exposure variable for each additional copy of the risk variant (A). This additive effect and its corresponding 95% CI were determined by using linear regression. Analyses were adjusted for: Model 0 – unadjusted; Model 1 – adjusted for age, gender, ethnicity, and geographic area (metropolitan/rural); Model 2 – adjusted for Model 1+smoking and physical activity; Model 3 – adjusted for Model 2+body composition and percentage of body fat.
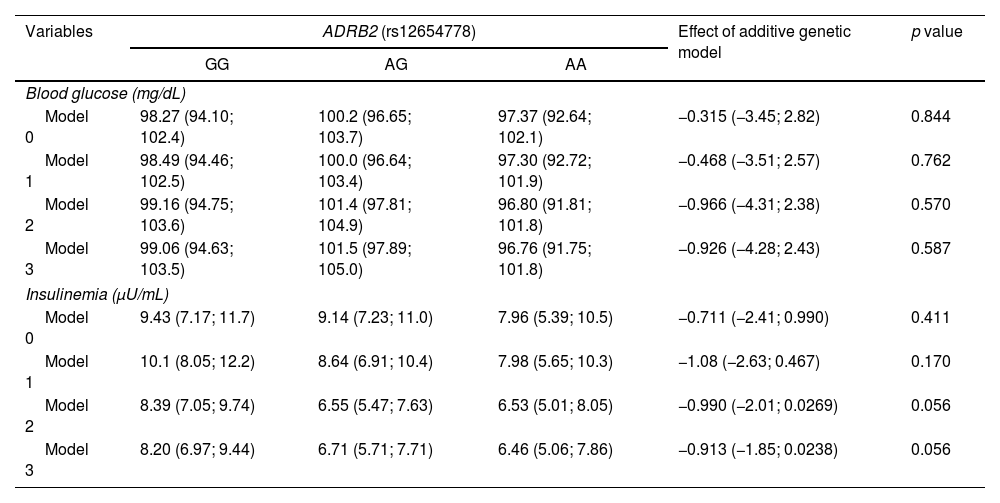
Table 5 shows the results of the association of the rs12654778 SNP of the ADRB2 gene with glycemia and insulin. No associations were reported for any of these biomarkers with the rs12654778 SNP of the ADRB2 gene across any of the statistical models.
Association between ADRB2 rs12654778 genotype and other cardiometabolic risk markers.
| Variables | ADRB2 (rs12654778) | Effect of additive genetic model | p value | ||
|---|---|---|---|---|---|
| GG | AG | AA | |||
| Blood glucose (mg/dL) | |||||
| Model 0 | 98.27 (94.10; 102.4) | 100.2 (96.65; 103.7) | 97.37 (92.64; 102.1) | −0.315 (−3.45; 2.82) | 0.844 |
| Model 1 | 98.49 (94.46; 102.5) | 100.0 (96.64; 103.4) | 97.30 (92.72; 101.9) | −0.468 (−3.51; 2.57) | 0.762 |
| Model 2 | 99.16 (94.75; 103.6) | 101.4 (97.81; 104.9) | 96.80 (91.81; 101.8) | −0.966 (−4.31; 2.38) | 0.570 |
| Model 3 | 99.06 (94.63; 103.5) | 101.5 (97.89; 105.0) | 96.76 (91.75; 101.8) | −0.926 (−4.28; 2.43) | 0.587 |
| Insulinemia (μU/mL) | |||||
| Model 0 | 9.43 (7.17; 11.7) | 9.14 (7.23; 11.0) | 7.96 (5.39; 10.5) | −0.711 (−2.41; 0.990) | 0.411 |
| Model 1 | 10.1 (8.05; 12.2) | 8.64 (6.91; 10.4) | 7.98 (5.65; 10.3) | −1.08 (−2.63; 0.467) | 0.170 |
| Model 2 | 8.39 (7.05; 9.74) | 6.55 (5.47; 7.63) | 6.53 (5.01; 8.05) | −0.990 (−2.01; 0.0269) | 0.056 |
| Model 3 | 8.20 (6.97; 9.44) | 6.71 (5.71; 7.71) | 6.46 (5.06; 7.86) | −0.913 (−1.85; 0.0238) | 0.056 |
Data expressed as mean and 95% CI according to genotype. The additive genetic model indicates the change in blood glucose and insulinemia variables for each copy of the A allele. The additive genetic model indicates the mean increase in the exposure variable for each additional copy of the risk variant (A). This additive effect and its corresponding 95% CI were determined by using linear regression. Analyses were adjusted for: Model 0 – unadjusted; Model 1 – adjusted for age, gender, ethnicity, and geographic area (metropolitan/rural); Model 2 – adjusted for Model 1+smoking and physical activity; Model 3 – adjusted for Model 2+body composition and percentage of body fat.
The findings of this study suggest that the AA allele of the rs12654778 SNP in the ADRB2 gene exerts a cardiometabolic protective effect by being associated with lower concentrations of the lipid biomarker LDLc. This difference was significant, reaching 8.75mg/dL lower levels in AA vs GG carriers for the rs12654778 SNP of the ADRB2 gene in the more adjusted model (Model 3). Although neither individual – carrying the risk (G) or the protective allele (A) – fall under the diagnostic threshold for hypercholesterolemia (150mg/dL TC), the lower levels of LDLc could potentially benefit individuals carrying the protective allele (A). This is especially true if they also have other risk factors for hypercholesterolemia or CVDs, or if they develop them in the future.
No association was found between the rs12654778 SNP and blood pressure, other lipid biomarkers (HDLc, TC, and TG), or other cardiometabolic risk markers, such as glycemia, insulin and HOMA-IR. This lack of association of this SNP with both systolic and DBP in a Chilean population is consistent with the findings from a study conducted in the Chinese-Kazakh population.16 Cai et al.16 included a total of five SNPs in the 5′-regulatory region of the ADRB2 gene associated with hypertension. In that case, only the rs11168070 SNP (−468G/A) was associated with an increased risk of hypertension.
Moreover, the lack of effect of the rs1265778 SNP in the ADRB2 gene on lipid biomarker values in our study contrasts with previous data on other ADRB2 gene SNPs. For instance, the rs34623097 (∼1.8kb upstream) and rs1042713 (Arg16Gly) SNPs were associated with hypertriglyceridemia in the Tongan and Chinese populations, respectively.8,15 As for glycemia and insulin levels, no significant associations with rs12654778 were observed. These results are like those documented in the Kazakh population, in which the rs1042714 (Gln27Glu) SNP was analyzed and no association with hyperinsulinemia or HOMA-IR was found.12 However, for this SNP, controversial results exist. A meta-analysis of eight studies conducted by Li et al.10 found that, in general, the Glu27 allele was associated with coronary artery disease-related mortality in postmenopausal women and surgically treated patients for ischemic disease in the American population. Still, it proved protective in patients on beta-blockers.10 Other meta-analyses found that this SNP is associated with obesity in countries of the Pacific coast, where its incidence rate is lower (3% up to 7%) vs the European Caucasian population (40%).11,13,24
The effect of different ADRB2 SNPs on cardiometabolic risk markers and associated diseases is highly complex and influenced by population characteristics, such as ethnicity, ancestry, geographic residence, age, gender, pharmacological treatment, PA and the SNP per se (frequency, functional effect, haplotype influence).11,25 For example, rs1042714 was associated with DBP in the Malay population of Malaysia; on the other hand, in Malay men, it was also associated with TG and HDLc.13 Unlike men it was also associated with obesity in Japanese women.11 This SNP was associated with BMI, SBP, and TG in the Taiwanese adult population26 and with insulin and HOMA-IR in adolescents from the same population.27 However, there are exceptions because no association was ever found with various cardiometabolic risk markers (BMI, insulin, leptin, glucose, blood pressure, lipids) in Aymara natives, in whom the incidence rate of the disease is 6.71%.28 Instead, it was associated with TG in Swedish men and women in northern France, where the incidence of SNP is higher (66.87% and 57.6%, respectively).13 Another factor we should take into consideration when analyzing data is the admixed ancestry of the Chilean population and the geographical distribution of the studied indigenous population. For the rs1042714 SNP, its incidence shows a geographical gradient in Mexico, ranging from 3% up to 34% across different ethnicities, and it is also influenced by Hispanic racial intermingling, with a mean frequency of 15% of the less represented allele.29
The impact of the rs12654778 SNP on the development of cardiometabolic diseases has been poorly studied, as well as the effect of its alleles on the functionality of ADRB2 in adipose, muscle, and endothelial cells. However, its influence on asthma and chronic obstructive pulmonary disease has been widely studied, particularly in broncho epithelial cells. Notably, the study by Li and Fu17 revealed that the A allele is associated with a 21.8% reduction in the activity of the ADRB2 promoter in human broncho epithelial cells Beas-2B, located within the CCAAT-like motif and involved in the binding to the transcription factor neurofibromin 1 (NF1). Additionally, the study found that modified histones (H3K27Ac, H3K4me1, and H3K4me3) are present in this region, which would contribute to regulating the activity of the ADRB2 promoter.
Regarding the strengths of this study, it is the first research ever conducted in a Chilean population that analyzes the association between the rs12654778 SNP a the ADRB2 gene and cardiometabolic risk markers, making it one of the very few studies ever conducted worldwide on this topic. However, this study has limitations. The small sample size may result in type II errors, potentially overlooking real associations. Furthermore, our findings may not be entirely applicable to different populations. Additionally, our study cross-sectional design prevents us from determining causality. Therefore, caution is advised when interpreting our results.
ConclusionsUsing data from the GENADIO study, we identified that the AA genotype of the rs12654778 SNP at the ADRB2 gene may potentially grant protection vs LDLc levels in the Chilean population. As this study is the first one ever conducted to investigate the association between the rs12654778 SNP in the ADRB2 gene and cardiometabolic risk markers in Chile and one of the few conducted worldwide, it is crucial to validate this finding in larger samples from the same population and in other populations with similar allele frequencies. Future well-powered population studies combined with functional validation studies are warranted to stablish the role of the AA allele at rs12654778 as a protective marker vs hypercholesterolemia.
Ethical approval and informed consent to participateThe study was approved by the ethics committees of Universidad de Chile (Chile), Universidad de Concepción (Chile), and University of Glasgow (United Kingdom, approval code GLARBC12532-A34) in full compliance with the principles set forth in the Declaration of Helsinki.
Before enrollment, all study participants signed written informed consent forms.
FundingThis work was totally self-funded research by the authors, without any financial support whatsoever.
Authors’ contributionsConception and design: CGC, MM and MV. Data analysis: MM, MV and LM. Manuscript drafting: MM and LM. Review & editing: MM, NU, COR, FDT, FPR, CCM, MV and LM.
All authors read and approved the published version of this manuscript.
Conflicts of interestNone declared.
