


Previous observational studies have suggested that low vitamin D status is associated with high circulating C-reactive protein levels, as well as other plasma inflammatory cytokines. However, there is no study to explore the relationship between vitamin D status and Lp-PLA2, a new biomarker of vascular-specific inflammation. The aim of this study was to examine the association between vitamin D status and circulating Lp-PLA2 levels in subjects with type 2 diabetes mellitus.
Material and methodsThis descriptive cross-sectional study enrolled diabetic subjects who underwent physical examination at Taizhou People's Hospital between August 2016 and January 2017. Blood pressure, anthropometry, metabolic profiles, serum 25(OH)D levels and Lp-PLA2 mass levels were measured in all participants.
ResultsA total of 196 participants were recruited into this study. The vitamin D insufficiency group had higher serum LP-PLA2 levels than the vitamin D sufficiency group (t=−2.765, p=.005). A significant negative correlation was noted between Lp-PLA2 and 25(OH)D in the vitamin D insufficiency group (r=−0.364, p=0.009). However, no significant relationship between serum Lp-PLA2 concentration and 25(OH)D levels was observed in subjects with vitamin D sufficiency.
ConclusionsFrom this cohort of patients with type 2 diabetes, regardless of traditional cardiovascular risk factors, we observed a statistically significant inverse relation between Lp-PLA2 and 25(OH)D at levels <30ng/mL.
Los estudios observacionales previos han sugerido que la situación de los bajos niveles de la vitamina D está asociada a los altos niveles de la proteína C reactiva circulantes, así como a otras citoquinas inflamatorias en plasma. Sin embargo, no existe ningún estudio que explore la relación entre la situación de la vitamina D y la lipoproteína asociada a la fosfolipasa A2 (Lp-PLA2), un nuevo biomarcador de la inflamación específico vascular. El objetivo de este estudio fue examinar la asociación entre la situación de la vitamina D y los niveles circulantes de Lp-PLA2 en sujetos con diabetes mellitus tipo 2.
Material y métodosEstudio transversal descriptivo que incluyó sujetos diabéticos que fueron sometidos a un examen físico en el Hospital popular de Taizhou entre agosto de 2016 y enero de 2017. Se midieron en todos los participantes la presión arterial, la antropometría, los perfiles metabólicos, el suero de 25 (OH) niveles séricos de vitamina D y los niveles de masa de Lp-PLA2.
ResultadosUn total de 196 participantes fueron reclutados para este estudio. El grupo de insuficiencia de la vitamina D reflejó unos niveles superiores de Lp-PLA2 que el grupo con suficiencia de vitamina D (T=−2,765; p=0,005). Se observó una correlación negativa significativa entre Lp-PLA2 y 25(OH)D en el grupo con insuficiencia de vitamina D (R=−0,364; p=0,009). Sin embargo, no se observó ninguna relación significativa entre la concentración sérica de Lp-PLA2 y 25(OH)D en sujetos con niveles de suficiencia de vitamina D.
ConclusionesA partir de esta cohorte de pacientes con diabetes tipo 2, independientemente de los factores de riesgo cardiovascular, se observó una relación inversa entre Lp-PLA2, estadísticamente significativa, en los niveles de 25(OH)D<30ng/ml.
Lipoprotein-associated phospholipase A2 (Lp-PLA2), otherwise known as plasma platelet-activating factor acetylhydrolase, is synthesised primarily by inflammatory cells and has been recently described as a biomarker of inflammation.1 Accordingly, Lp-PLA2 hydrolyses oxidised phospholipids on oxidised low-density lipoprotein particles found in plaques, resulting in oxidised free fatty acids and lysophosphatidylcholine products that stimulate the expression of endothelial adhesion molecules and cytokines, ultimately leading to more proinflammatory products.2–5 Hence, serum Lp-PLA2 concentration has been established as a predictor of cardiovascular disease (CVD).6,7
Numerous studies have shown an association between low vitamin D levels and increased risk for incident cardiovascular events.8,9 However, the exact pathophysiologic mechanisms linking the two have not been fully understood. Inflammation has definitely been known to play a prominent role in the occurrence and development of atherosclerosis. Previous observational studies have suggested the association between low vitamin D levels and high circulating C-reactive protein (CRP) levels, as well as other plasma inflammatory cytokines.10,11 Meanwhile, previous reports have shown that cholecalciferol supplementation improves the systemic inflammatory profile.12,13 Building upon the existing literature, Vitamin D deficiency may contribute to higher levels of inflammation. Considering the lack of understanding regarding the relationship between vitamin D status and Lp-PLA2, a vascular-specific inflammatory marker, the present study examined the association between vitamin D status and circulating Lp-PLA2 levels in diabetic subjects.
Materials and methodsStudy subjectsThis descriptive cross-sectional study enrolled subjects with diabetes who underwent physical examination at Taizhou People's Hospital between August 2016 and January 2017. Subjects between 18 and 85 years old were included. The exclusion criteria included the following: (1) serious liver or kidney disease; (2) serious acute and/or chronic diabetic complications (hypoglycemia coma, diabetic ketoacidosis, hyperglycemic hyperosmolar state, renal failure and proliferative diabetic retinopathy); (3) history of coronary heart disease and/or CVD and/or carotid or peripheral vascular disease; (4) acute inflammatory diseases and/or connective tissue disease; (5) those on statins, ezetimibe, omega-3 fatty acids or other medications that influence plasm lipid or vitamin D levels; (6) parathyroid, thyroid or calcium metabolism disorders; and (7) women on hormone replacement therapy. An initial cohort of 281 individuals was recruited, all of whom provided informed consent. However, 82 subjects with atherosclerotic disease determined through coronary angiography, magnetic resonance angiography of the head and peripheral vascular ultrasound were excluded. Moreover, three other subjects with Lp-PLA2 levels over 800ng/mL were excluded.
Anthropometric and laboratory measurementsWeight, height, hip circumferences, waist circumferences and blood pressure were measured. The latter was measured following the recommendations of the Seventh Joint National Committee. Body mass index (BMI) was calculated as weight in kilograms divided by height in metres squared.
All venous blood samples were withdrawn in the morning after an overnight fast for measuring 25(OH)D, fasting glucose, fructosamine, HbA1c, total cholesterol (TC), triglyceride (TG), high-density lipoprotein cholesterol (HDL-C), low-density lipoprotein cholesterol (LDL-C), apolipoprotein (Apo)-A1, Apo-B and Lp-PLA2 in all participants. Serum Lp-PLA2 concentrations were determined through a double-antibody sandwich enzyme-linked immunosorbent assay (Beijing hotgen Biotech Co., Ltd., China) using the upconverting phosphor technology analyser. The intra- and inter-assay coefficients of variation for Lp-PLA2 did not exceed 12% and 15%, respectively. The detection range of the assay was 5–800ng/mL, while the limit of blank did not exceed 5ng/mL. Serum glucose, fructosamine, TC, TG, HDL-C, LDL-C, Apo-A1, and Apo-B were determined using automatic biochemical analyzer (Beckman Coulter Co., Ltd., USA), whereas serum HbA1c levels were measured using high pressure liquid chromatography. Serum 25(OH)D levels were assessed using an enzyme immunoassay.
We set vitamin D insufficiency and deficiency at levels below 30ng/mL and 20ng/mL, respectively. Patients with vitamin D deficiency were included in the vitamin D insufficiency group because of their small number. Subjects were considered hypertensives if they had a prior diagnosis, with or without pharmacologic therapy, and/or if they had an average blood pressure ≥140/90mmHg. Subjects with diabetes were identified as those who had prior diagnosis and/or fasting plasma glucose (FPG) levels ≥7.0mmol/L or 2-h postprandial plasma glucose levels ≥11.1mmol/L after a 75-g oral glucose tolerance test. Dyslipidemia was defined as LDL-C level greater than or equal to 4.1mmol/L, HDL-C level less than or equal to 1.0mmol/L, TC level greater than or equal to 6.2mmol/L, non-HDL-C level greater than or equal to 4.9mmol/L or TG level greater than or equal to 2.3mmol/L during this study according to Chinese guideline for the management of dyslipidemia in adults in 2016. A BMI over 24kg/m2 is defined as overweight, and over 28kg/m2 is defined as obesity.14 Abdominal obesity is defined as waist circumference over 90cm in men and over 85cm in women for Chinese populations. The study was approved by the Taizhou People's Hospital Ethics Research Committee.
Statistical analysisContinuous variables are presented as means (standard deviation) for normally distributed variables and median (interquartile range) for non-normally distributed variables. Categorical variables are presented as percentage. The Kolmogorov–Smirnov method was used to test for normality. Give that plasma levels of HbA1c, FPG, TG, 25(OH)D and Lp-PLA2 had skewed distributions, such variables were log-transformed for analyses. Difference in continuous and categorical variables between groups were separately evaluated using Student's t-tests and Chi-square tests, respectively. Scatter plots and Pearson's correlation analysis were used to examine the relationship between lg25(OH)D and lgLp-PLA2 levels. Furthermore, partial correlation was used to measure the degree of association between lg25(OH)D and lgLp-PLA2 while controlling for the effects of age, sex, diabetes duration, FPG, fructosamine, HbA1c, hypertension, systolic blood pressure (SBP), diastolic blood pressure (DBP), dyslipidemia, obesity and abdominal obesity. Multiple linear regression analysis was used to examine the relationship between lgLp-PLA2 levels and vitamin D status, sex, age, and cardiovascular risk factors. All calculations were performed using SPSS 13.0 for Windows (Chicago, IL, USA). A probability (p) levels of <0.05 was considered statistically significant for all tests.
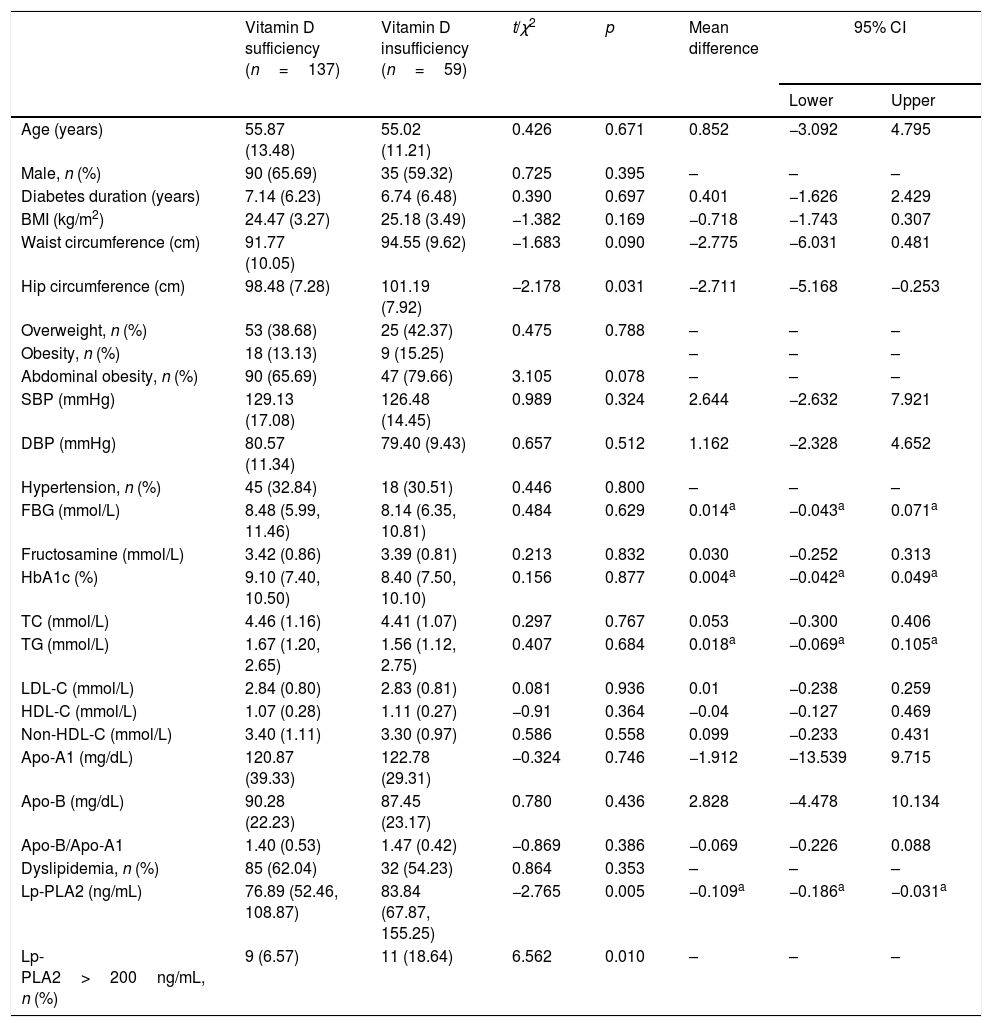
ResultsClinical and laboratory characteristics in vitamin D sufficiency and vitamin D insufficiency groupClinical and laboratory characteristics of the 196 subjects (71 females and 125 males; mean age of 55.61±12.81 years) in vitamin D sufficiency and vitamin D insufficiency group are shown in Table 1. On average, patients in vitamin D insufficiency group had significantly greater hip circumference (p=0.031) and Lp-PLA2 (p=0.005) than those in vitamin D sufficiency group. No significant differences in other laboratory characteristics were observed between vitamin D sufficiency and vitamin D insufficiency group.
Clinical and laboratory characteristics in vitamin D sufficiency and vitamin D insufficiency group.
| Vitamin D sufficiency (n=137) | Vitamin D insufficiency (n=59) | t/χ2 | p | Mean difference | 95% CI | ||
|---|---|---|---|---|---|---|---|
| Lower | Upper | ||||||
| Age (years) | 55.87 (13.48) | 55.02 (11.21) | 0.426 | 0.671 | 0.852 | −3.092 | 4.795 |
| Male, n (%) | 90 (65.69) | 35 (59.32) | 0.725 | 0.395 | – | – | – |
| Diabetes duration (years) | 7.14 (6.23) | 6.74 (6.48) | 0.390 | 0.697 | 0.401 | −1.626 | 2.429 |
| BMI (kg/m2) | 24.47 (3.27) | 25.18 (3.49) | −1.382 | 0.169 | −0.718 | −1.743 | 0.307 |
| Waist circumference (cm) | 91.77 (10.05) | 94.55 (9.62) | −1.683 | 0.090 | −2.775 | −6.031 | 0.481 |
| Hip circumference (cm) | 98.48 (7.28) | 101.19 (7.92) | −2.178 | 0.031 | −2.711 | −5.168 | −0.253 |
| Overweight, n (%) | 53 (38.68) | 25 (42.37) | 0.475 | 0.788 | – | – | – |
| Obesity, n (%) | 18 (13.13) | 9 (15.25) | – | – | – | ||
| Abdominal obesity, n (%) | 90 (65.69) | 47 (79.66) | 3.105 | 0.078 | – | – | – |
| SBP (mmHg) | 129.13 (17.08) | 126.48 (14.45) | 0.989 | 0.324 | 2.644 | −2.632 | 7.921 |
| DBP (mmHg) | 80.57 (11.34) | 79.40 (9.43) | 0.657 | 0.512 | 1.162 | −2.328 | 4.652 |
| Hypertension, n (%) | 45 (32.84) | 18 (30.51) | 0.446 | 0.800 | – | – | – |
| FBG (mmol/L) | 8.48 (5.99, 11.46) | 8.14 (6.35, 10.81) | 0.484 | 0.629 | 0.014a | −0.043a | 0.071a |
| Fructosamine (mmol/L) | 3.42 (0.86) | 3.39 (0.81) | 0.213 | 0.832 | 0.030 | −0.252 | 0.313 |
| HbA1c (%) | 9.10 (7.40, 10.50) | 8.40 (7.50, 10.10) | 0.156 | 0.877 | 0.004a | −0.042a | 0.049a |
| TC (mmol/L) | 4.46 (1.16) | 4.41 (1.07) | 0.297 | 0.767 | 0.053 | −0.300 | 0.406 |
| TG (mmol/L) | 1.67 (1.20, 2.65) | 1.56 (1.12, 2.75) | 0.407 | 0.684 | 0.018a | −0.069a | 0.105a |
| LDL-C (mmol/L) | 2.84 (0.80) | 2.83 (0.81) | 0.081 | 0.936 | 0.01 | −0.238 | 0.259 |
| HDL-C (mmol/L) | 1.07 (0.28) | 1.11 (0.27) | −0.91 | 0.364 | −0.04 | −0.127 | 0.469 |
| Non-HDL-C (mmol/L) | 3.40 (1.11) | 3.30 (0.97) | 0.586 | 0.558 | 0.099 | −0.233 | 0.431 |
| Apo-A1 (mg/dL) | 120.87 (39.33) | 122.78 (29.31) | −0.324 | 0.746 | −1.912 | −13.539 | 9.715 |
| Apo-B (mg/dL) | 90.28 (22.23) | 87.45 (23.17) | 0.780 | 0.436 | 2.828 | −4.478 | 10.134 |
| Apo-B/Apo-A1 | 1.40 (0.53) | 1.47 (0.42) | −0.869 | 0.386 | −0.069 | −0.226 | 0.088 |
| Dyslipidemia, n (%) | 85 (62.04) | 32 (54.23) | 0.864 | 0.353 | – | – | – |
| Lp-PLA2 (ng/mL) | 76.89 (52.46, 108.87) | 83.84 (67.87, 155.25) | −2.765 | 0.005 | −0.109a | −0.186a | −0.031a |
| Lp-PLA2>200ng/mL, n (%) | 9 (6.57) | 11 (18.64) | 6.562 | 0.010 | – | – | – |
Data are n (%), means (SD) or median (range).
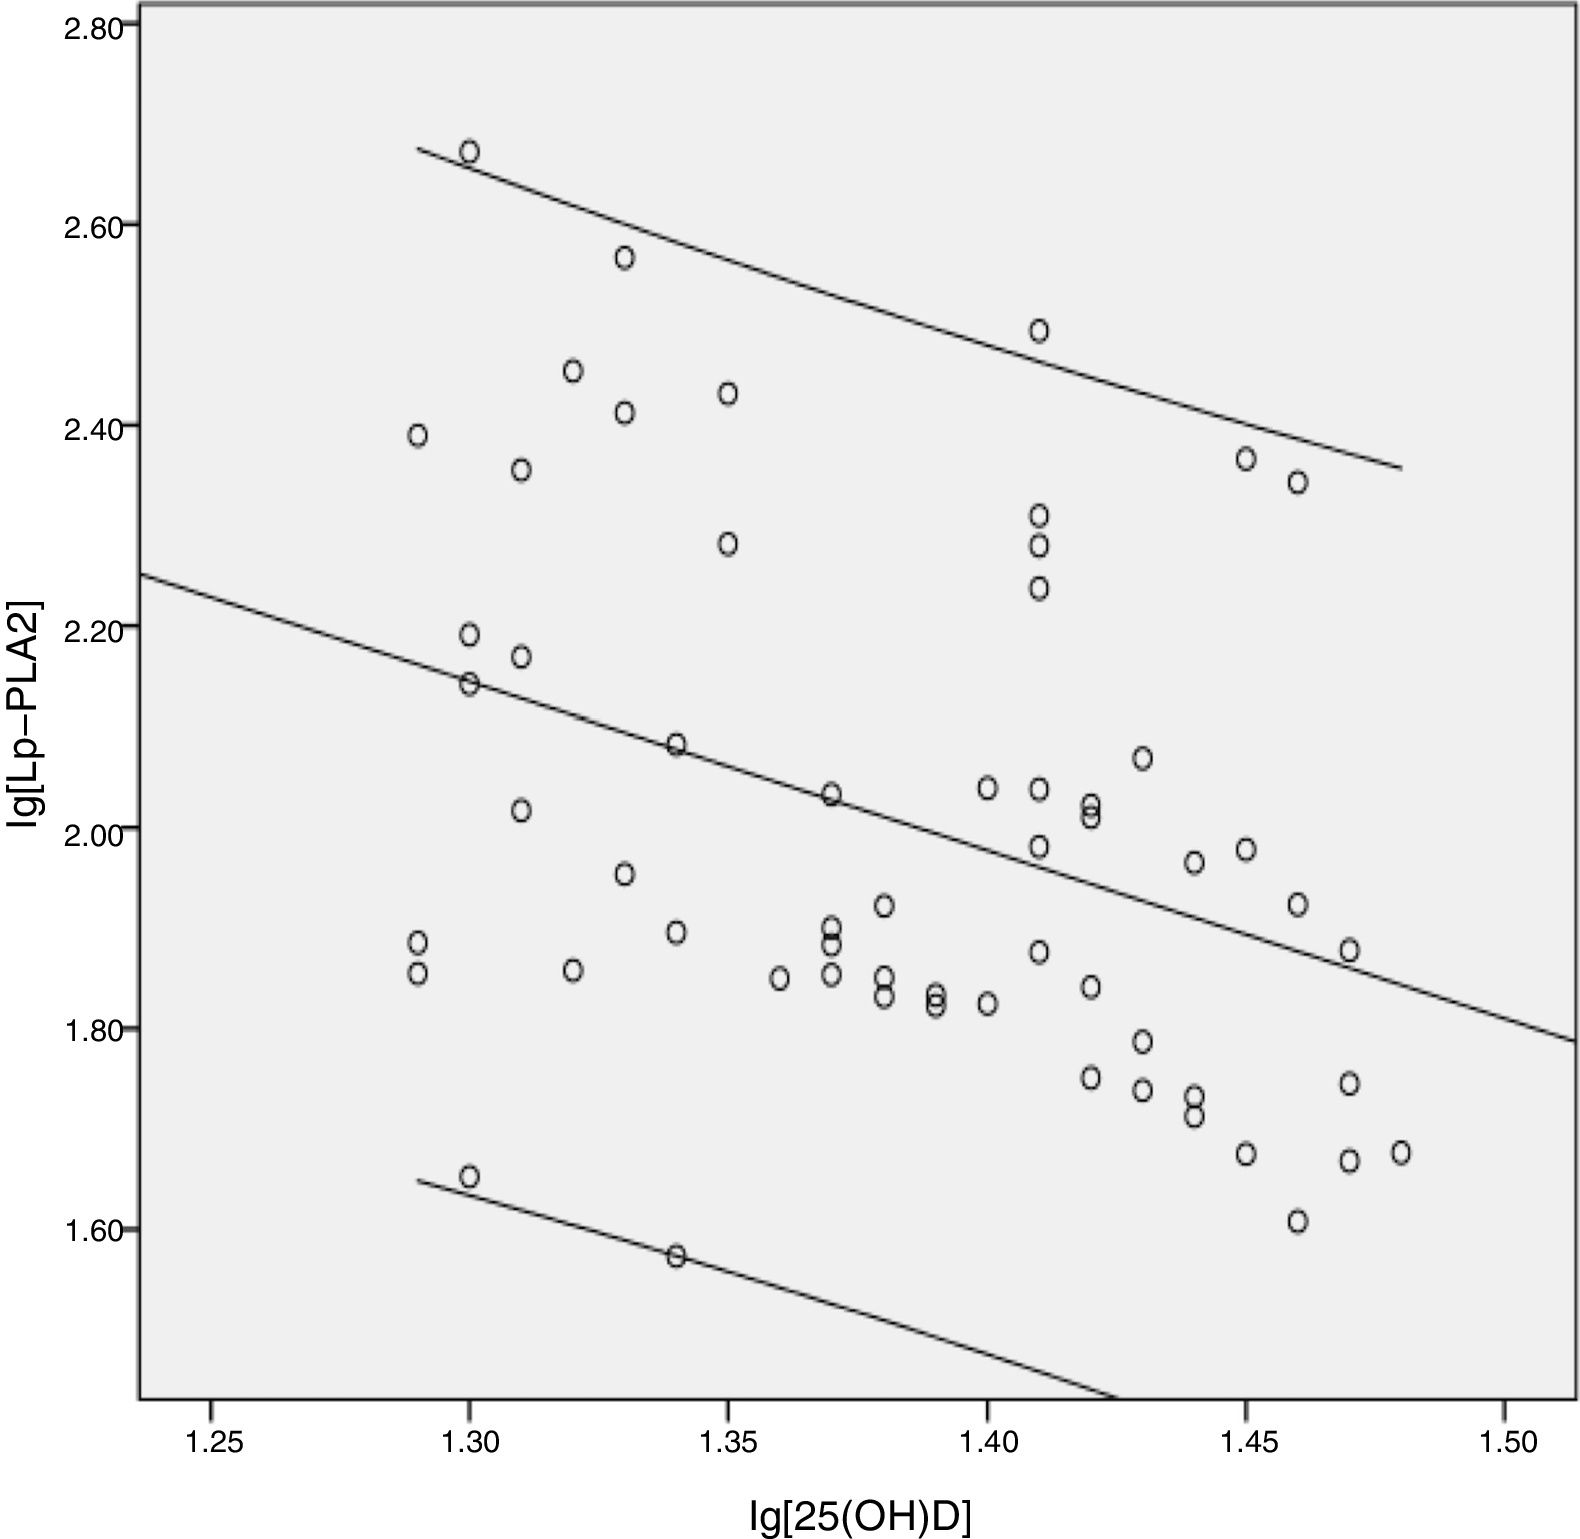
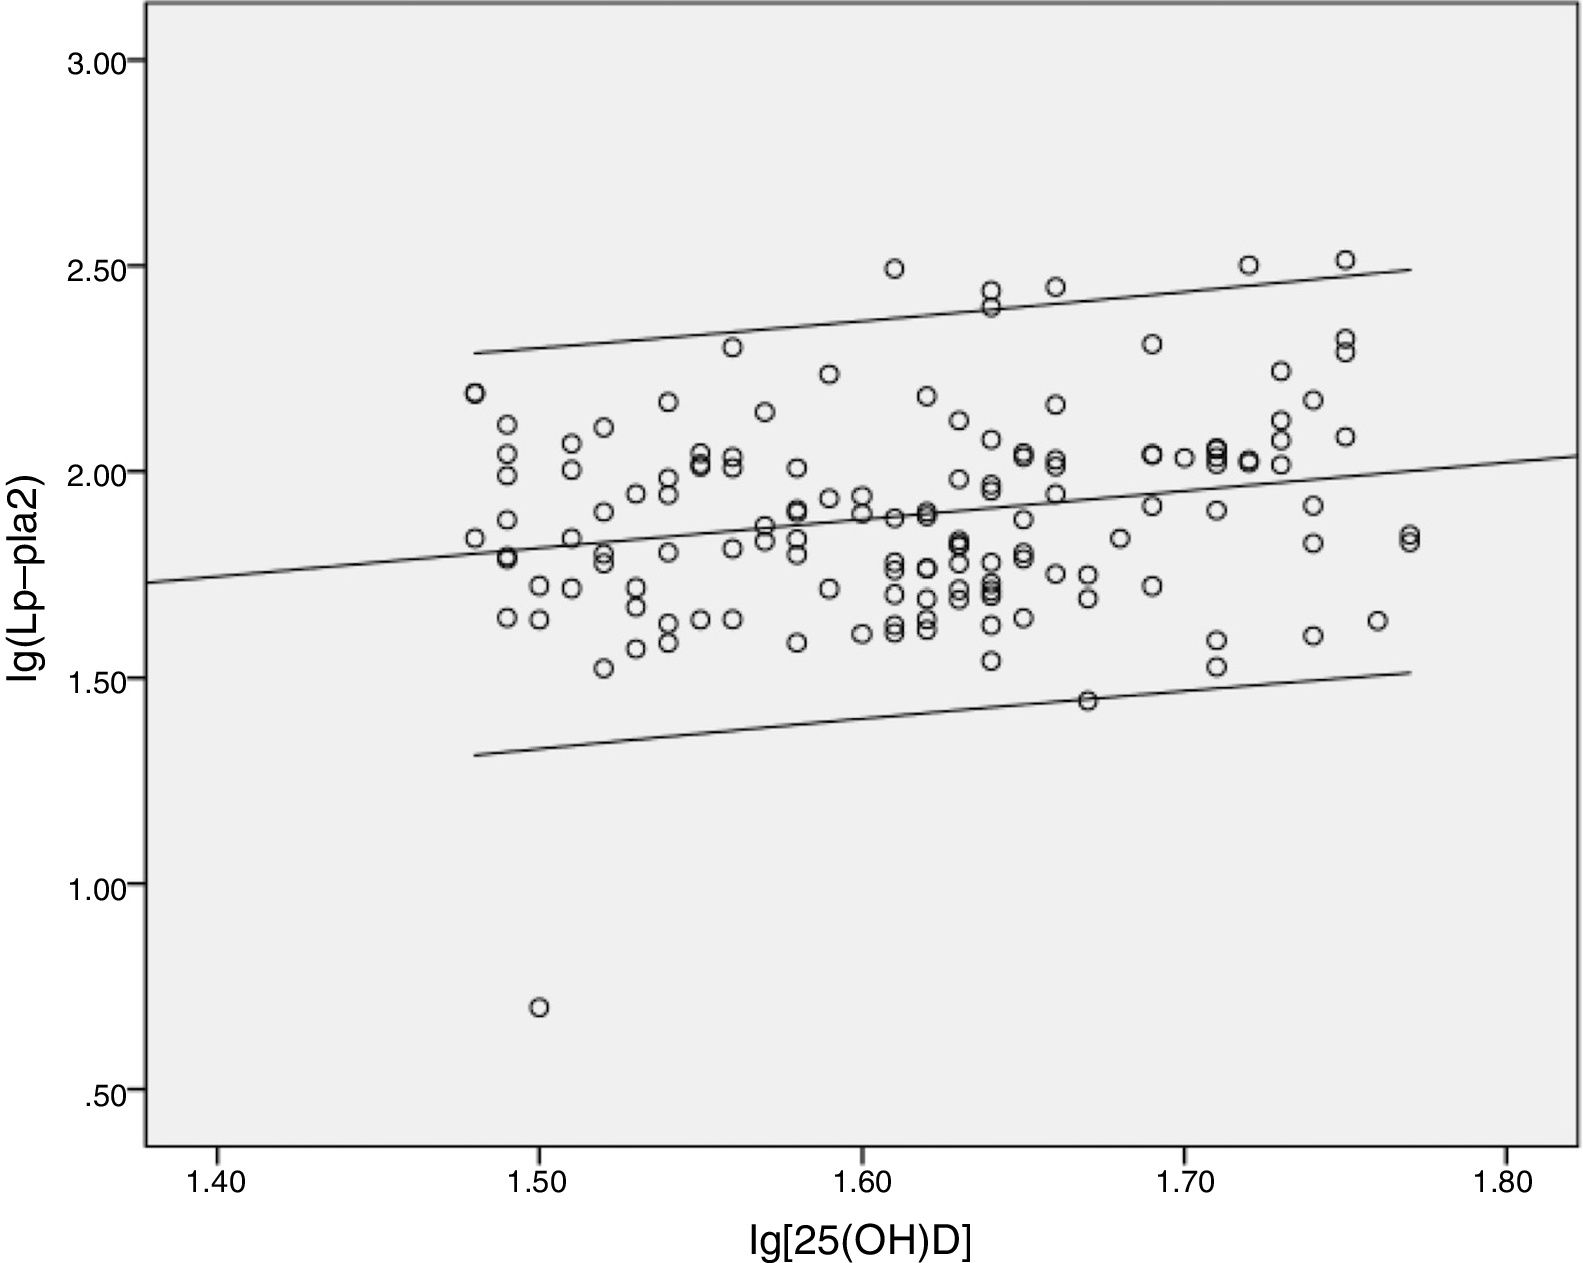
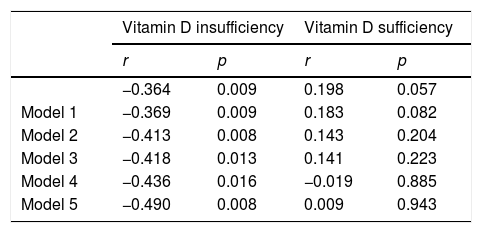
After assessing the relation between serum Lp-PLA2 and plasma 25(OH)D levels, no linear correlation between the two was found. Based on a cutoff value of 30ng/mL, the subjects were then grouped into those having vitamin D insufficiency and vitamin D sufficiency. The correlation between Lp-PLA2 and vitamin D status is presented in Table 2. Moreover, a significant negative correlation was observed between Lp-PLA2 and 25(OH)D in the vitamin D insufficiency group (r=−0.364, p=0.009) as indicated in the scatter plot (Fig. 1). Partial correlation analyses found that Lp-PLA2 concentration was still negatively correlated with serum 25(OH)D levels, with the correlation coefficient increasing gradually from −0.369 to −0.490 after adjusting for five different models (Table 2). On the contrary, no significant relationship was found between serum Lp-PLA2 concentration and 25(OH)D levels in subjects with vitamin D sufficiency even after adjusted analysis (Fig. 2).
Correlation coefficients of Lp-PLA2 with 25-(OH)D levels in vitamin D insufficiency and Vitamin D sufficiency group.
| Vitamin D insufficiency | Vitamin D sufficiency | |||
|---|---|---|---|---|
| r | p | r | p | |
| −0.364 | 0.009 | 0.198 | 0.057 | |
| Model 1 | −0.369 | 0.009 | 0.183 | 0.082 |
| Model 2 | −0.413 | 0.008 | 0.143 | 0.204 |
| Model 3 | −0.418 | 0.013 | 0.141 | 0.223 |
| Model 4 | −0.436 | 0.016 | −0.019 | 0.885 |
| Model 5 | −0.490 | 0.008 | 0.009 | 0.943 |
r=correlations coefficient; p=p-value.
Model 1 adjusted for age (years), sex.
Model 2 adjusted for Model 1+diabetes duration, FPG, fructosamine, HbA1c.
Model 3 adjusted for Model 2+hypertension, systolic and diastolic blood pressure.
Model 4 adjusted for Model 3+overweight or obesity, and abdominal obesity.
Model 5 adjusted for Model 4+dyslipidemia.
D concentrations in diabetic patients with vitamin D insufficiency.")
D concentrations in diabetic patients with vitamin D sufficiency.")
Multiple linear regression analysis found that 25(OH)D had an independent effect on Lp-PLA2 levels (beta=−0.642, p<0.001) in the vitamin D insufficiency group (Table S1). Additionally, BMI, Apo-B, Apo-B/Apo-A1 and dyslipidemia were independently associated with Lp-PLA2 levels (beta=0.373, p=0.021; beta=0.781, p=0.031; beta=0.604, p=0.008; and beta=0.592, p=0.007, respectively). On the contrary, the effects of SBP, DBP, TG, TC, HDL-C, LDL-C, Apo-A1, non-HDL-C, FPG, fructosamine and HbA1c on Lp-PLA2 concentrations were not significant.
Multiple linear regression analysis found that only Apo-B/Apo-A1 had an independent effect on Lp-PLA2 levels (beta=0.273, p=0.021) in the vitamin D sufficiency group. Meanwhile, the effects of blood pressure, blood glucose and other serum lipids on Lp-PLA2 concentrations were not significant.
DiscussionThe present study explored the probable relationship between vitamin D status and Lp-PLA2 mass levels in subjects with type 2 diabetes. Accordingly, data analysis of a small number of subjects showed that the vitamin D insufficiency group had higher serum LP-PLA2 levels compared to the vitamin D sufficiency group. Moreover, a significant negative correlation was found between Lp-PLA2 and 25(OH)D in the vitamin D insufficiency group, even after adjusting for sex, age and other cardiovascular risk factors, with the correlation coefficient increasing after adjusting for the aforementioned variables. However, no significant relationship between serum Lp-PLA2 concentration and 25(OH)D levels had been observed in subjects with vitamin D sufficiency.
Recently, vitamin D had been found to affect the process of atherosclerosis through inflammatory cytokines while having a direct effect on the vasculature. Talmor Y et al.15 showed that calcitriol decreased the expression of adhesion molecules, receptor for advanced glycation end products and interleukin-6 in human umbilical vein endothelial cells. More recently, Talmor Y et al.16 demonstrated that calcitriol blunted the impact of advanced glycation end products in cultured endothelial cells. Many inflammatory markers related to vitamin D have been investigated in cross-sectional and prospective studies. Given that Lp-PLA2 is a predictor of CVD with increased specificity for vascular inflammation, assessing the relationship between Lp-PLA2 and vitamin D is important.
Regarding the association between vitamin D and cardiovascular outcomes, low vitamin D levels have been definitely associated with increased risk for incident cardiovascular events.17 Accordingly, Kendrick et al.8 had shown that vitamin D deficiency was independently associated with CVD. However, vitamin D levels seemed to be nonlinearly correlated with inflammatory cytokines and the risk for CVD, a finding that had been confirmed herein. Moreover, the Offspring Study18 found a somewhat U-shaped association between vitamin D concentration and the risk for overall cardiovascular events. Evidence from several studies19–22 have suggested an apparent 25(OH)D threshold concentration of 20ng/mL, beyond which risk for CVD does not decrease further. More recently, Amer et al.23 had found an inverse correlation between vitamin D levels and CRP in asymptomatic adults with low vitamin D levels, but a positive correlation in those with high 25(OH)D levels. Accordingly, Ellam et al.24 verified that vitamin D deficiency and excess exogenous vitamin D similarly increased diffuse atherosclerotic calcification in Apo-E knockout mice. These data suggest that although low vitamin D levels may increase risk, higher 25(OH)D concentrations may not proportionately lower risk. Large-scale studies have shown that vitamin D supplementation does not reduce the incidence of cardiovascular events even in participants with baseline vitamin D deficiency.25,26 Interestingly, previous studies have found that specific inhibition of lipoprotein-associated phospholipase A2 with darapladib does not reduce the risk of cardiovascular death, myocardial infarction or stroke.27,28 Thus, the relationship between vitamin D and Lp-PLA2 deserves further exploration.
One interesting aspect of the present study was that independent factors associated with Lp-PLA2 differed between the vitamin D insufficiency and vitamin D sufficiency group. Accordingly, multiple regression analysis showed that only Apo-B/Apo-A1 was independently associated with Lp-PLA2 levels in the vitamin D sufficiency group. Meanwhile, Apo-B, Apo-B/Apo-A1 and dyslipidemia had been found to be independently associated with Lp-PLA2 levels in the vitamin D insufficiency group, a finding consistent with that presented in existing literature.29–31 However, no correlation had been found between Lp-PLA2 and HDL-c, Apo-A1 and non-HDL-c. Interestingly, majority of the studies reporting positive results had explored the association between Lp-PLA2 activity, but not Lp-PLA2 mass, and serum lipids.32,33 Thompson et al.34 had found that Lp-PLA2 activity was more strongly associated with various lipid markers than Lp-PLA2 mass, which could be attributed to varying distributions across lipoprotein classes or differences in measurement precision. Additionally, the cross-sectional association observed between Lp-PLA2 and obesity was consistent with that found in existing literature.30,35 Furthermore, the present study found no correlation between Lp-PLA2 and blood glucose and blood pressure, a finding similar to that presented in the study by Acevedo.32 On the contrary, Persson et al.30 showed that Lp-PLA2 was strongly correlated with blood glucose and weakly associated with blood pressure in a population-based cohort.
The present study has several limitations worth noting. (1) Given its cross-sectional design, temporal relationships between vitamin D and Lp-PLA2 could not be examined. (2) Only a small, non-random sample population had been studied. (3) The present study did not adjust for factors such as weather, time of the year, and smoking status. (4) Finally, given that our laboratory was unable to detect Lp-PLA2 activity, only Lp-PLA2 mass had been determined herein. Nevertheless, Lp-PLA2 activity and mass have been found to be associated with each other.34
The present cross-sectional study involving diabetic subjects without atherosclerotic disease demonstrated that the vitamin D insufficiency group had significantly higher levels of serum Lp-PLA2 than the vitamin D sufficiency group. Moreover, Lp-PLA2 mass was inversely associated with vitamin D status in subjects with vitamin D insufficiency.
Financial supportFunding was from the Affiliated Taizhou People's Hospital of Nantong University (ZL201725).
Conflict of interestsThe authors declare that there is no conflict of interests regarding the publication of this paper.
We thank all the participants in this study.
The following are the supplementary data to this article:
