


Cardiovascular (CV) diseases are among the main causes of death in systemic lupus erythematosus (SLE). Physical activity (PA) and fitness are potential protective factors against the progression of CV risk factors and atherosclerosis.
AimTo analyze trends over time in PA, sedentary time (ST) and physical fitness and their associations of with traditional and novel markers of CV risk and subclinical atherosclerosis in women with SLE over a 3-year follow-up period.
MethodsIn this exploratory study, 77 White Hispanic women with SLE (43.3±13.8 years) with mild disease activity were followed after 3 years (n=44). HDL and LDL cholesterol (blood samples), BMI and muscle mass (stadiometer and bioimpedance device), blood pressure (BP), pulse wave velocity (PWV, Mobil-O-Graph® monitor), carotid plaques and intima–media thickness (General Electric Medical Systems, LOGQ-6 model) were assessed. PA and ST were measured using triaxial accelerometers. Physical fitness was assessed with the back-scratch, handgrip strength, 30-s chair stand, and 6-min walk, tests.
ResultsAfter 3 years, LDL-c (estimated mean change [est]=13.77mg/dL) and PWV (0.13m/s) increased while diastolic BP (−2.80mmHG) decreased (all, p<0.05). In mixed models, 6-min walk test was positively associated with HDL-c (est=0.07); back scratch (est=0.33) and chair-stand (est=1.19) tests were positively associated with systolic BP (all, p<0.05). No other trends or associations over time were identified (all, p>0.05).
ConclusionsPA, ST, fitness, and most studied CV risk factors remained stable over time, with only marginal changes in LDL-c, PWV, and diastolic BP. Overall, PA and ST were not longitudinally associated with CV risk factors and subclinical atherosclerosis and contradictory weak associations were found for physical fitness.
Las enfermedades cardiovasculares están entre las principales causas de muerte en el lupus eritematoso sistémico (LES). La actividad física (AF) y la condición física son posibles factores protectores contra la progresión del riesgo cardiovascular (CV) y la aterosclerosis.
ObjetivoAnalizar las tendencias a lo largo del tiempo en la AF, el tiempo sedentario (TS) y la condición física, así como sus asociaciones con marcadores tradicionales y novedosos de riesgo CV y aterosclerosis subclínica en mujeres con LES durante un seguimiento de 3 años.
MétodosEn este estudio exploratorio se hizo un seguimiento a 77 mujeres hispanas blancas con LES (43,3±13,8años) con actividad de la enfermedad leve a lo largo de 3 años (n=44), evaluando: colesterol ligado a lipoproteínas de alta densidad (HDL) y baja densidad (LDL) (muestras de sangre), índice de masa corporal y masa muscular (estadiómetro y dispositivo de bioimpedancia), presión arterial (PA), velocidad de onda de pulso (VOP, monitor Mobil-O-Graph®), placas carotídeas y grosor íntima-media (Sistemas Médicos General Electric, modelo LOGQ-6). La AF y el TS se midieron utilizando acelerómetros triaxiales. La condición física se evaluó usando los test: back-scratch, handgrip strength, 30-sec chair stand y 6-min walk.
ResultadosA los 3 años el colesterol LDL (cambio medio estimado [est]=13,77mg/dl) y la VOP (0,13m/s) aumentaron, mientras que la PA diastólica (–2,80mmHg) disminuyó (todo, p<0,05). En modelos mixtos el 6-min walk test se asoció positivamente con el colesterol HDL (est=0,07); el back-scratch test (est=0,33) y el 30-sec chair stand test (est=1,19) se asociaron positivamente con la PA sistólica (todo, p<0,05). No se identificaron otras tendencias o asociaciones a lo largo del tiempo (todo, p>0,05).
ConclusionesLa AF, el TS, la condición física y la mayoría de los factores de riesgo CV estudiados permanecieron estables a lo largo del tiempo, con solo cambios marginales en el colesterol LDL, VOP y la PA diastólica. En general, la AF y el TS no se asociaron longitudinalmente con los factores de riesgo CV y la aterosclerosis subclínica, y se encontraron asociaciones débiles y contradictorias con la condición física.
Systemic lupus erythematosus (SLE) is an autoimmune disease of an unknown etiology, with a prevalence of approximately 44 cases per 100,000 individuals, primarily affecting adult women.1 Despite recent improvements in SLE management, which has reduced morbidity and mortality,2 cardiovascular (CV) diseases remain the leading cause of death in this population.3 Consequently, there is a growing emphasis on enhancing CV risk assessment and management in patients with SLE.4
Higher physical activity (PA) levels have been favorably associated with traditional CV risk markers in the general population.5 Sedentary time (ST), defined as periods of low energy expenditure during waking hours,6 has become a distinct risk factor associated with CV disease incidence 7,8 and mortality.9 In SLE, higher levels of moderate-to-vigorous physical activity (MVPA) and lower ST have been linked to lower blood pressure and reduced potential CV risk at 10 years.10 Physical fitness, including cardiorespiratory fitness, muscular strength, or range of motion, also exhibits a correlation with enhanced CV health,11,12 body composition,13 systolic blood pressure and triglycerides 12 in SLE. However, the limited evidence on the relationship between PA, ST, and physical fitness with CV health in SLE is primarily derived from cross-sectional studies. Additionally, existing research has mainly focused on traditional CV risk factors that insufficiently explain the increased CV morbi-mortality of this population.3
Exploring novel contributors to CV risk, such as inflammation 14 and muscle mass,3 may offer a more comprehensive understanding of CV health in SLE. As evidenced by cross-sectional studies, higher levels of PA 15 and physical fitness 12,14,16 have been correlated with lower inflammatory states in SLE.16 Increased levels of PA 17,18 and muscle mass 18,19 are determinants for better physical fitness.17–19 Despite their interrelated nature, muscular strength, which represents functionality, is affected differently and more significantly than muscle mass in SLE.20 In addition, muscular strength, rather than muscle mass, seems to be associated with all-cause mortality 21 and greater disability in SLE 19. The impact of modifiable protective factors such as PA, ST, and physical fitness, on the progression over time of novel CV risk factors in SLE remains largely unexplored.
Proper management of CV risk factors prevents the progression of atherosclerosis, which is especially accelerated in SLE.22 Arterial stiffness (an indicator of the elasticity of vessel walls), carotid intima media thickness (IMT) and the presence of plaques are relevant markers of early atherosclerosis.23 Studies investigating the influence of PA on arterial stiffness in SLE have produced mixed findings: whereas some research has reported a correlation between being physically active and reduced arterial stiffness,24 others did not find such association.25 Greater levels of muscular strength 12 and cardiorespiratory fitness 26 seem to be more consistently associated with reduced arterial stiffening in patients with SLE.12,26 Furthermore, levels of self-reported PA have been linked to both a reduced number of atherosclerotic plaques 27 and a decreased progression of atherosclerotic plaques over a 7-year period in SLE.28 Nevertheless, self-reported measures of PA are susceptible to inaccuracies, and the use of accelerometers provides more precise measurements of daily PA.29
The aims of this study were to explore (i) the changes over 3 years in PA, ST and physical fitness, and (ii) the associations of PA, ST, and physical fitness components with traditional (cholesterol, blood pressure, and body weight) and novel (inflammation and muscle mass) markers of CV risk and subclinical atherosclerosis (arterial stiffness, IMT, and atherosclerotic plaque) at 3-year follow-up in women with SLE.
MethodsDesign and participantsPatients with SLE were invited to participate through the Systemic Autoimmune Diseases Unit of the “Virgen de las Nieves” University Hospital and the “San Cecilio” University Hospital. Approximately three years later, the same cohort was contacted for follow-up evaluations. Inclusion criteria for the current study were: (i) women (aged 18–60 years) with ≥4 SLE classification criteria according to the American College of Rheumatology criteria 30 with a minimum medical follow-up of 1 year at our unit and clinical stability during the previous 6 months of the study defined as no changes in the systemic lupus erythematosus disease activity index (SLEDAI) and/or the treatment. Exclusion criteria were: (i) not being able to read, (ii) understand and/or sign the informed consent; (iii) family history of clinical CV disease in the last year, (iv) receiving a biological treatment or required doses of prednisone (or equivalent) greater than 10mg/day in the last 6 months.
All participants received detailed information about the study procedures and signed informed consent before being included. The Research Ethics Committee of Granada reviewed and approved the study protocol.
ProceduresThe baseline assessments of eligible participants were carried out between October 2016 and March 2017. On day 1, sociodemographic and clinical information were collected, and anthropometric measures and physical fitness tests performed. On day 2 (i.e. 2–4 days after day 1), 8-h fasting blood samples were collected between 8:00am and 10:00am. Subsequently, each participant was provided with an accelerometer, which was returned 9 days later. A similar assessment procedure was repeated at 3-year follow-up, but this second time point of evaluation incorporated the additional assessment of intima-media thickness on day 2.
MeasurementsAnthropometric measuresHeight was measured in cm using a height gauge, and weight as well as muscle mass were measured with a bioimpedance device (InBody R20, Biospace, Seoul, Korea). Body mass index (BMI, kg/m2) was calculated. Waist circumference was measured in cm with an anthropometric tape (Harpenden, Holtain Ltd, Wales, United Kingdom).
Blood samplesVenous fasting blood samples were collected in the morning with heparin as an anticoagulant. Blood was centrifuged at 3500rpm for 15min to separate the plasma, which was subsequently removed. High-density lipoprotein cholesterol (HDL-c), low-density lipoprotein cholesterol (LDL-c), total cholesterol concentrations were analyzed enzymatically with an autoanalyzer (Olympus Diagnostic, Hamburg, Germany). Serum high-sensitivity hs-CRP was assessed by an immunoturbidimetric method using the ARCHITECT cSystems (MULTIGENT hs-CRP Vario assay) and following the manufacturer's instructions. The limit of quantitation was 0.2mg/L and the upper limit for normal serum was 5mg/L (coefficient of variation<6%). Serum complements levels of C3 and C4 (mg/dL), glucose (mg/dL), triglycerides (mg/dL) were also assessed.
Blood pressure and arterial stiffnessSystolic and diastolic blood pressure were measured in a seated position using the Mobil-O-Graph® 24h pulse wave analysis monitor (IEM GmbH, Stolberg, Germany) after 5min of rest. Arterial stiffness was assessed by pulse wave velocity (PWV),31 using the same device—an established, valid, and reliable instrument.32,33 This instrument operates based on oscillometry recorded by a blood pressure cuff placed on the brachial artery.34 PWV measurement was conducted under static conditions preceding the assessment of physical fitness.32,33
Intima-media thickness and carotid plaqueCarotid intima media thickness (IMT) was assessed using a General Electric Medical Systems (LOGQ-6 model) ultrasound scan device with a 9 linear (8MHz) probe. Firstly, a cross-sectional scanning was made to identify possible plaques or stenosis. Next, a longitudinal scanning of the common carotid artery was made to measure IMT, (i.e., the distance from the leading edge of the lumen-intima interface to the leading edge of the lumen-intima interface of the far wall), defining the region of interest as the 10-mm long segment of the carotid artery located 10mm proximally to the bulb. The assessment was performed three times on the left carotid artery, three times on the right carotid artery and then a mean IMT value was calculated for each artery. The presence of plaque (yes/no) was defined as a focal structure that either exceeds at least twice the IMT of the adjacent segments of the artery or have a thickness from the intimal–luminal to the media-adventitial interface of >1.2mm.35
Physical activity and sedentary timeParticipants wore a triaxial accelerometer GT3X+ (Actigraph) on their hip for 9 consecutive days, 24h/day, except for water-based activities. Data were collected using the default mode filter option at a rate of 30Hz and stored at an epoch length of 60s.36,37 Data from day 1 (to avoid reactivity) and day 9 (the day of device return) were excluded from the analyses. A total of 7 continuous days with at least 10 valid hours/day were required for inclusion. Data download, reduction, cleaning, and analyses were conducted using the manufacturer's software (ActiLife desktop, version 6.11.7).
Accelerometer wear time was calculated by subtracting sleeping time (reported in sleep diaries by patients) and non-wear periods (90 continuous minutes of 0 counts 38). PA intensity levels were calculated based upon recommended PA vector magnitude cut points: light (200–2689counts per minute{cpm}), and MVPA (>2690cpm). ST was estimated as the time accumulated below 200cpm during periods of wear time.36,37
Physical fitness componentsCardiorespiratory fitness: was assessed using the 6-min walk test. This test measures the maximum distance (in meters) a person can walk for 6min.39
Upper-body range of motion was assessed with the back-scratch test.39 This test measures how close the hands can be brought together behind the back. The distance between (or overlap of) the middle fingers behind the back was recorded twice for each arm, and the best scores from the right and left arms were averaged.
Muscle strength: Upper-body muscular strength was assessed with the handgrip strength test as previously described 40 were best score of each hand was used to compute an average of the two hands. Lower-body muscular strength was assessed using the “30-s chair stand test.” 39 The number of times in 30s that an individual can rise to a full stand from a seated position was registered.
Statistical analysesThis exploratory study focused on investigating emerging trends and patterns, rather than rigorously testing specific hypotheses. Therefore, a formal sample size calculation was not carried out. The flexible sample size enabled a broader exploration of the subject. Data normality was assessed using the Kolmogorov–Smirnoff test, visual histograms, and Q–Q plots. To address extreme outliers, a winsorization approach was applied to BMI and hsCRP, limiting values to the lowest 5% and highest 95%. Descriptive statistics (mean and standard deviation for quantitative variables and frequency and percentage for categorical variables) were used to examine the sociodemographic and clinical characteristics of the study’ sample. The percentage of participants presenting with hypertension, hyperglycemia, hypertriglyceridemia (>130/85mmHg, >126mg/dL, >150mg/dL, respectively or taking medication to control these factors) and low levels of HDL-c (<50mg/dL) were calculated.
To analyze trends for changes over time, linear mixed-effects models were conducted using the lme4 package.41 The subject was included as a random effect to capture individual-specific variability. CV risk factors, physical fitness components, PA and ST were entered as dependent variables and time was included as fixed effect. CV risk factors were included as dependent variables to analyze longitudinal associations, and physical fitness components, PA or ST interaction with time were included as fixed effects. Various models were constructed considering potential confounders, such as age, BMI, and smoking habits. Model summaries, diagnostic plots (including quantile–quantile plots for normality checks), and missing value assumptions were thoroughly examined. Significance testing employed the lmerTest package,42 utilizing Satterthwaite's method for degrees of freedom estimation and p-value generation in mixed models.
Because data for intima-media thickness was only available at 3-year follow-up, linear regression models were used to assess the association with physical fitness components and accelerometer-derived measures at baseline. Finally, binary logistic regressions were conducted to assess the association of the presence (yes/no) of atherosclerotic plaque at 3-year follow-up with physical fitness components accelerometer-derived measures at baseline. All analyses were conducted using R statistical software (version 4.2.1), with a significance threshold set at p<0.05.
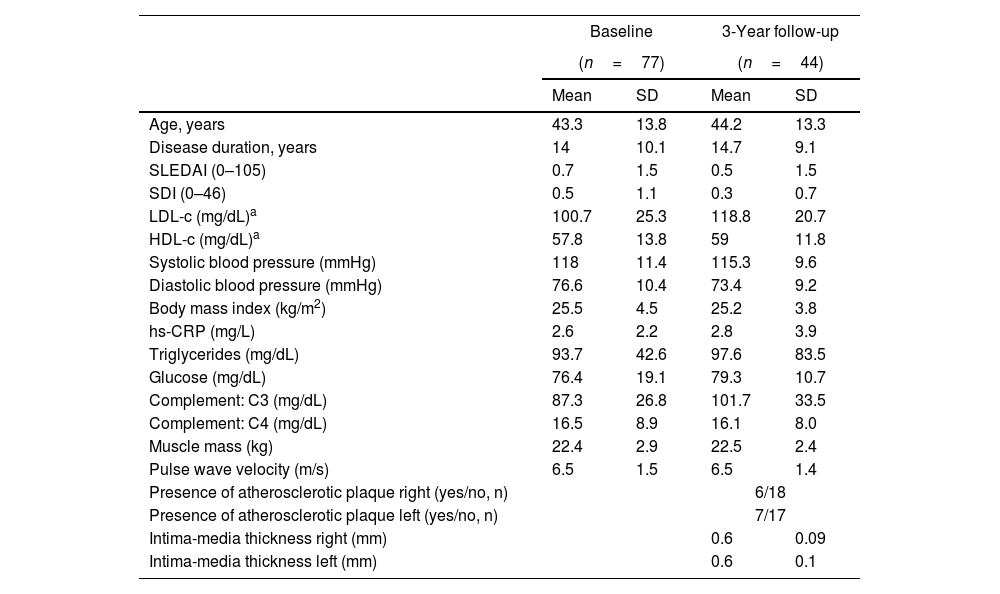
ResultsThe flowchart of the participants throughout the study is presented in Supplementary Fig. 1. At baseline, out of 172 patients initially invited, 81 refused to participate and 14 did not meet the inclusion criteria. Among the eligible participants with valid data at baseline (n=77), a total of 44 participants attended the 3-year follow-up. Table 1 presents the clinical and sociodemographic characteristics of the participants’ at baseline and 3 years follow-up, and Table 2 presents an overview of the PA, ST and physical fitness at each time point.
Clinical and sociodemographic characteristics of the participants at baseline and 3-year follow-up.
| Baseline | 3-Year follow-up | |||
|---|---|---|---|---|
| (n=77) | (n=44) | |||
| Mean | SD | Mean | SD | |
| Age, years | 43.3 | 13.8 | 44.2 | 13.3 |
| Disease duration, years | 14 | 10.1 | 14.7 | 9.1 |
| SLEDAI (0–105) | 0.7 | 1.5 | 0.5 | 1.5 |
| SDI (0–46) | 0.5 | 1.1 | 0.3 | 0.7 |
| LDL-c (mg/dL)a | 100.7 | 25.3 | 118.8 | 20.7 |
| HDL-c (mg/dL)a | 57.8 | 13.8 | 59 | 11.8 |
| Systolic blood pressure (mmHg) | 118 | 11.4 | 115.3 | 9.6 |
| Diastolic blood pressure (mmHg) | 76.6 | 10.4 | 73.4 | 9.2 |
| Body mass index (kg/m2) | 25.5 | 4.5 | 25.2 | 3.8 |
| hs-CRP (mg/L) | 2.6 | 2.2 | 2.8 | 3.9 |
| Triglycerides (mg/dL) | 93.7 | 42.6 | 97.6 | 83.5 |
| Glucose (mg/dL) | 76.4 | 19.1 | 79.3 | 10.7 |
| Complement: C3 (mg/dL) | 87.3 | 26.8 | 101.7 | 33.5 |
| Complement: C4 (mg/dL) | 16.5 | 8.9 | 16.1 | 8.0 |
| Muscle mass (kg) | 22.4 | 2.9 | 22.5 | 2.4 |
| Pulse wave velocity (m/s) | 6.5 | 1.5 | 6.5 | 1.4 |
| Presence of atherosclerotic plaque right (yes/no, n) | 6/18 | |||
| Presence of atherosclerotic plaque left (yes/no, n) | 7/17 | |||
| Intima-media thickness right (mm) | 0.6 | 0.09 | ||
| Intima-media thickness left (mm) | 0.6 | 0.1 | ||
| n | % | n | % | |
|---|---|---|---|---|
| Corticosteroids use | 50 | 64.9 | 21 | 47.7 |
| Hydroxicroloquine use | 69 | 89.6 | 39 | 88.6 |
| Immunosupressant use | 35 | 45.5 | 17 | 38.6 |
| Statins use | 14 | 18.2 | 7 | 15.9 |
| Hypertension | 15 | 19.5 | 5 | 11.4 |
| Hyperglycemia | 0 | 0 | 2 | 4.5 |
| Hypertriglyceridemia | 7 | 9.1 | 8 | 18.2 |
| Low HDL-c levels | 5 | 6.5 | 1 | 2.3 |
| Smoker | 23 | 29.9 | 11 | 25 |
| Menopause | 30 | 39 | 8 | 18.2 |
| Marital status | ||||
| Married | 37 | 48.1 | 21 | 47.7 |
| Not married | 40 | 51.9 | 23 | 52.3 |
| Level of education | ||||
| University | 37 | 48.1 | 18 | 40.9 |
| Non-university | 40 | 51.9 | 26 | 59.1 |
| Work activity | ||||
| Working | 39 | 50.6 | 23 | 52.3 |
| Housework | 12 | 15.6 | 6 | 13.6 |
| Not working | 26 | 33.8 | 15 | 34.1 |
HDL-C: high density lipoprotein cholesterol; hsCRP: high sensitivity C-reactive protein; LDL-C: low density lipoprotein cholesterol; SLEDAI: Systemic Lupus Erythematosus Disease Activity Index; SDI: Systemic Damage Index.
Physical activity, sedentary time, and physical fitness data of the participants at baseline and 3-year follow-up.
| Baseline | 3-Year follow-up | |||||
|---|---|---|---|---|---|---|
| N | Mean | SD | N | Mean | SD | |
| PA and ST | 47 | 30 | ||||
| Sedentary time (min/day) | 451.4 | 104.7 | 465.9 | 99 | ||
| Light PA (min/day) | 425.7 | 96.5 | 431.3 | 79.4 | ||
| Moderate–vigorous PA (min/day) | 51.1 | 31.3 | 57.4 | 25.7 | ||
| Reaching 150min MVPA/week (n, %) | 42 | 89.3 | 29 | 96.7 | ||
| Accelerometer wear time (min/day) | 928.2 | 67.2 | 954.6 | 49.8 | ||
| % of accelerometer wear time in ST | 48.7 | 10.8 | 48.6 | 9.4 | ||
| % of accelerometer wear time in light PA | 45.8 | 9.5 | 45.3 | 9.1 | ||
| % of accelerometer wear time in MVPA | 5.5 | 3.2 | 6.0 | 2.6 | ||
| Physical fitness | ||||||
| Back scratch test (cm) | 76 | −0.8 | 9.6 | 44 | 0.7 | 9.4 |
| Hand-grip strength test (kg) | 76 | 23.7 | 5.4 | 44 | 23.8 | 5.2 |
| Chair stand test (repetitions) | 77 | 15.0 | 3.2 | 42 | 15.8 | 3.4 |
| 6-min walk test (m) | 49 | 570.8 | 71.8 | 15 | 565 | 81.7 |
MVPA: moderate-to-vigorous physical activity; PA: physical activity; ST: sedentary time.
The 3-year changes in markers of CV risk are displayed in Supplementary Fig. 2, and the 3-year changes in PA, ST and physical fitness are presented in Supplementary Fig. 3. There was a deterioration of LDL-c (estimate mean change [est]: 13.78mg/dL, SE: 3.7, p<0.005) and PWV (est: 0.13m/s, 0.05, p=0.008) and an improvement in diastolic blood pressure (est: −2.80mmHg, 1.13, p=0.017) over time. No other trends were observed over the 3 years follow-up (all p>0.05).
Table 3 shows the longitudinal associations of PA and ST with CV risk markers at 3-year follow-up. Higher ST was associated with lower BMI (est: −0.09, SE: 0.04, p=0.042), however, this association lost statistical significance when age was considered (model 2). Higher MVPA was associated with lower HDL-c in model 2 (est: −1.18, SE: 0.59, p=0.048), though such an association was not consistent in models 1 and 3. Additional adjustment for smoking habits did not alter the results. No other associations were observed between PA or ST and CV risk markers.
Longitudinal associations of physical activity and sedentary time with cardiovascular risk markers at 3-year follow-up.
| Sedentary time (% of wear time) | Light PA (% of wear time) | MVPA (% of wear time) | ||||||||||
|---|---|---|---|---|---|---|---|---|---|---|---|---|
| Estimate | SE | P1 | P2 | Estimate | SE | P1 | P2 | Estimate | SE | P1 | P2 | |
| LDL-c (mg/dL) | −0.49 | 0.39 | 0.221 | 0.385 | 0.63 | 0.42 | 0.142 | 0.235 | −0.77 | 1.23 | 0.538 | 0.424 |
| HDL-c (mg/dL) | 0.23 | 0.22 | 0.300 | 0.181 | −0.15 | 0.24 | 0.545 | 0.379 | −1.18 | 0.59 | 0.060 | 0.048a |
| Systolic blood pressure (mmHg) | 0.02 | 0.19 | 0.900 | 0.695 | −0.02 | 0.20 | 0.912 | 0.742 | −0.04 | 0.61 | 0.943 | 0.866 |
| Diastolic blood pressure (mmHg) | 0.03 | 0.15 | 0.854 | 0.665 | −0.06 | 0.17 | 0.719 | 0.569 | 0.17 | 0.48 | 0.730 | 0.801 |
| Body mass index (kg/m2) | −0.09 | 0.04 | 0.042 | 0.056 | 0.08 | 0.04 | 0.093 | 0.116 | 0.26 | 0.13 | 0.066 | 0.074 |
| hsCRP | −0.09 | 0.05 | 0.073 | 0.081 | 0.10 | 0.05 | 0.072 | 0.077 | 0.02 | 0.18 | 0.891 | 0.937 |
| Muscle mass (%) | 0.06 | 0.10 | 0.535 | 0.703 | −0.03 | 0.11 | 0.777 | 0.933 | −0.43 | 0.34 | 0.219 | 0.261 |
| Pulse wave velocity (m/s) | −0.01 | 0.01 | 0.347 | 0.426 | 0.01 | 0.01 | 0.267 | 0.325 | −0.01 | 0.03 | 0.735 | 0.875 |
HDL-C: high density lipoprotein cholesterol; hsCRP: high sensitivity C-reactive protein; LDL-C: low density lipoprotein cholesterol; MVPA: moderate-to-vigorous physical activity; PA: physical activity.
P1: no covariates in the models. P2: models adjusted for age.
Table 4 shows the longitudinal associations of physical fitness components with CV risk markers at 3-year follow-up. Higher scores in the back scratch (est: 0.33, SE: 0.14, p=0.020) and chair-stand (est: 1.19, SE: 0.39, p=0.004) tests were associated with higher systolic blood pressure at follow-up. Higher scores in the 6-min walk test was associated with higher HDL-c (est: 0.07, SE: 0.02, p<0.001). These associations were consistent in models 1, 2 and 3. Additional adjustment for smoking habits did not alter the results. No other associations were observed between physical fitness and CV risk markers.
Longitudinal associations of physical fitness components with cardiovascular risk markers at 3-year follow-up.
| Back scratch test | Hand-grip test | Chair-stand test | 6-min walk test | |||||||||||||
|---|---|---|---|---|---|---|---|---|---|---|---|---|---|---|---|---|
| Estimate | SE | P1 | P2 | Estimate | SE | P1 | P2 | Estimate | SE | P1 | P2 | Estimate | SE | P1 | P2 | |
| LDL-c (mg/dL) | 0.05 | 0.40 | 0.907 | 0.860 | −0.84 | 0.78 | 0.285 | 0.206 | −0.25 | 1.17 | 0.835 | 0.495 | −0.05 | 0.08 | 0.559 | 0.412 |
| HDL-c (mg/dL) | −0.01 | 0.20 | 0.969 | 0.987 | −0.05 | 0.41 | 0.899 | 0.820 | 0.14 | 0.54 | 0.801 | 0.914 | 0.07 | 0.02 | <0.001 | <0.001a |
| Systolic blood pressure (mmHg) | 0.33 | 0.14 | 0.020 | 0.016a | 0.54 | 0.26 | 0.041 | 0.071a | 1.19 | 0.39 | 0.004 | 0.032a | 0.04 | 0.03 | 0.198 | 0.238 |
| Diastolic blood pressure (mmHg) | 0.20 | 0.12 | 0.110 | 0.107 | 0.40 | 0.23 | 0.082 | 0.110 | 0.71 | 0.37 | 0.055 | 0.130 | 0.02 | 0.03 | 0.507 | 0.548 |
| Body mass index (kg/m2) | −0.02 | 0.04 | 0.624 | 0.617 | 0.03 | 0.06 | 0.590 | 0.728 | 0.05 | 0.12 | 0.639 | 0.967 | −0.01 | 0.01 | 0.378 | 0.381 |
| hsCRP | 0.03 | 0.04 | 0.489 | 0.508 | 0.11 | 0.08 | 0.174 | 0.197 | 0.19 | 0.12 | 0.131 | 0.304 | −0.01 | 0.01 | 0.436 | 0.441 |
| Muscle mass (%) | −0.07 | 0.06 | 0.289 | 0.284 | −0.02 | 0.12 | 0.900 | 0.975 | −0.11 | 0.18 | 0.541 | 0.713 | −0.02 | 0.02 | 0.237 | 0.228 |
| Pulse wave velocity (m/s) | 0.01 | 0.01 | 0.208 | 0.101 | 0.02 | 0.01 | 0.065 | 0.110 | 0.03 | 0.02 | 0.153 | 0.217 | 0.00 | 0.00 | 0.252 | 0.505 |
HDL-C: high density lipoprotein cholesterol; hsCRP: high sensitivity C-reactive protein; LDL-C: low density lipoprotein cholesterol.
P1: no covariates in the models. P2: models adjusted for age.
Table 5 shows the longitudinal associations of PA, ST and physical fitness with intima-media thickness. Higher scores in the 30-s chair stand (β=−0.44, p=0.031) and the 6-min walk (β=−0.56, p=0.037) tests were associated with lower intima-media thickness in the right side, although these associations vanished when adjusting for age (p>0.05). Additional adjustment for smoking habits did not alter the results. Table 6 shows the odds ratio for PA, ST and physical fitness with presence of atherosclerotic plaque at 3-year follow-up, revealing no statistically associations between the studied variables.
Longitudinal associations of physical activity, sedentary time and physical fitness at baseline with intima-media thickness at 3-year follow-up.
| IMT right | IMT left | |||||||||||
|---|---|---|---|---|---|---|---|---|---|---|---|---|
| β | B | (95% CI) | P1 | P2 | β | B | (95% CI) | P1 | P2 | |||
| Sedentary time | 0.10 | 0.00 | 0.00 | 0.00 | 0.754 | 0.742 | 0.09 | 0.00 | 0.00 | 0.00 | 0.781 | 0.958 |
| Light PA | −0.46 | 0.00 | 0.00 | 0.00 | 0.115 | 0.726 | −0.33 | 0.00 | 0.00 | 0.00 | 0.276 | 0.909 |
| MVPA | −0.01 | 0.00 | 0.00 | 0.00 | 0.973 | 0.960 | −0.08 | 0.00 | 0.00 | 0.00 | 0.792 | 0.894 |
| Back scratch test | −0.23 | 0.00 | −0.01 | 0.00 | 0.290 | 0.260 | −0.26 | 0.00 | −0.01 | 0.00 | 0.211 | 0.193 |
| Handgrip test | −0.29 | 0.00 | −0.01 | 0.00 | 0.162 | 0.618 | −0.24 | 0.00 | −0.01 | 0.00 | 0.251 | 0.743 |
| Chair stand test | −0.44 | −0.01 | −0.02 | 0.00 | 0.031 | 0.572 | −0.32 | −0.01 | −0.02 | 0.00 | 0.131 | 0.995 |
| 6-min walk test | −0.56 | 0.00 | 0.00 | 0.00 | 0.037 | 0.125 | −0.39 | 0.00 | 0.00 | 0.00 | 0.163 | 0.464 |
IMT: intima-media thickness. MVPA: moderate-to-vigorous physical activity; PA: physical activity P1: no covariates in the models. P2: models adjusted for age. Additional adjustment for smoking habits did not alter the results.
Odds ratio for the association of physical activity, sedentary time, and physical fitness at baseline with the presence of atherosclerotic plaque at 3-year follow-up.
| Presence of atherosclerotic plaque (right) | Presence of atherosclerotic plaque (left) | |||||||
|---|---|---|---|---|---|---|---|---|
| OR | (95% CI) | P | OR | (95% CI) | P | |||
| Sedentary time | 1.02 | 1.00 | 1.04 | 0.104 | 1.00 | 0.99 | 1.01 | 0.809 |
| Light PA | 0.99 | 0.97 | 1.00 | 0.121 | 1.00 | 0.99 | 1.01 | 0.687 |
| MVPA | 0.91 | 0.81 | 1.02 | 0.119 | 0.95 | 0.87 | 1.03 | 0.194 |
| Back scratch test | 1.16 | 0.99 | 1.36 | 0.068 | 0.96 | 1.09 | 0.85 | 0.556 |
| Handgrip test | 0.97 | 0.84 | 1.13 | 0.726 | 0.95 | 0.82 | 1.09 | 0.459 |
| Chair stand test | 0.76 | 0.53 | 1.08 | 0.120 | 0.85 | 0.62 | 1.15 | 0.285 |
| 6-min walk test | 1.00 | 0.99 | 1.02 | 0.863 | 0.98 | 0.95 | 1.01 | 0.129 |
CI: confidence interval; MVPA: moderate-to-vigorous physical activity; OR: odds ratio, PA: physical activity;
The present exploratory cohort study evidenced that PA, ST, physical fitness, and most studied CV risk factors remained stable over a 3-year follow-up in adult women with SLE with mild disease activity. Only marginal changes were observed, reflecting a deterioration in LDL and PWV, and an improvement in diastolic blood pressure. CV risk factors and subclinical atherosclerosis were not longitudinally associated with PA or ST. Contradictory weak associations were found for physical fitness. While higher levels of cardiorespiratory fitness were associated with higher HDL-c at follow-up, higher levels of range of motion and muscular strength were associated with higher systolic blood pressure. No significant associations were identified between other components of physical fitness and CV risk factors or subclinical atherosclerosis.
Prior research suggests that individuals with SLE tend to be physically inactive 43 and engage in lower levels of PA than healthy controls.42,44 Only one previous study examined the longitudinal evolution of PA, showing a decline in self-reported adherence to the recommended 150min/week of MVPA from 38.4% at baseline to 26.7% during a 7-year follow-up.28 This study is the first to analyze the trends of PA using accelerometers in SLE, with 89.3% of participants meeting PA recommendations at baseline and 96.7% at the 3-year follow-up. Furthermore, previous cross-sectional studies using accelerometers in SLE have described greater daily ST levels (532–603min),10,45 and lower light PA (127–346min)42,46 and MVPA levels (25.7–38.4min) 45,46 compared to our sample. Different accelerometer algorithms or cutoff points for PA could explain these differences.47 Nevertheless, our selected sample may be notably more active than those in prior studies, maintaining stable these levels of PA and ST over time.
On the contrary, the participants showed compromised fitness levels. In our sample of women with an average age of 43.3±13.8 years, 6-min walk test scores ranged between the 25th-50th percentiles of women aged 60–64.39 Handgrip values were comparable to those in other SLE studies,20 but below the 25th percentile for women of similar age.48 In the 30-sec chair stand test, scores were slightly lower 49 and higher 50 compared to other SLE studies, and approximately in line with the 50th percentile for women aged 60–64.39 Range of motion scores fell between the 50th and 75th percentiles of women aged 60–64.39 These findings confirm the documented deteriorated physical fitness levels in prior SLE studies.20,43 While a decline in fitness components over time was not observed, it is essential to emphasize that fitness levels persist below the desired values for health. Thus, proactive strategies to enhance fitness levels in SLE are strongly encouraged.
Most traditional CV risk factors remained generally stable over time and mostly within healthy values (except BMI slightly exceeding the recommended upper range of 24.9kg/m2). Similarly, arterial stiffness and hs-CRP were not as pronounced as previously described for SLE,22,51,52 approaching the normal range for the general population.53 Muscle mass closely aligned with reference values,54 consistent with a previous meta-analysis showing similar muscle mass values in SLE and healthy controls.20 While LDL-c, PWV, and diastolic blood pressure showed statistical changes over time, the magnitude of the changes was small and the clinical relevance of these changes limited. Although individuals with SLE typically face increased CV risk,4 this study focused on patients who sustained clinical stability over the preceding 6 months, undergoing regular monitoring by healthcare providers, which potentially contributed to the tight control of CV factors.
Previous evidence in SLE has linked lower levels of ST 10 and higher levels of PA 10,15 and fitness 11,16 with improved CV risk markers 10,12–16 and general CV health.10–12 However, the present study did not support the longitudinal association between PA, ST and CV risk factors at 3-year follow-up. For physical fitness, the 6-minute walk was the only fitness component favorably associated with higher HDL-c, while the back scratch and 30-s chair stand were associated with higher systolic blood pressure. However, it is crucial to approach these findings with a nuanced perspective, emphasizing the relatively small changes and their limited clinical significance, rather than placing exclusive reliance on statistical significance.55,56 Therefore, the longitudinal association between fitness and traditional CV risk factors in this study seem to be weak and inconsistent.
An earlier study reported reduced arterial stiffening in self-reported physically active patients with SLE.24 However, our preceding cross-sectional study,25 and this 3-year follow-up did not support this association. To our knowledge, only our prior cross-sectional studies within this sample explored the link between fitness and arterial stiffness in SLE,12,26 revealing associations with reduced arterial stiffening; however, this follow-up suggests that these associations may not endure over time. Furthermore, self-reported PA levels have been associated with a lower number of atherosclerotic plaques 27 and a reduced progression of atherosclerotic plaques over a 7-year period in SLE.28 In our present study, which only assessed the presence and size of atherosclerotic plaques at the 3-year follow-up, no associations were found with baseline levels of PA, ST, or fitness. Although this study is novel in considering non-previously explored predictors such as device-measured PA and fitness, the IMT analysis had a particularly low sample size, specially limiting the power of the analysis.
Several factors contribute to the overall lack of association found between PA and fitness with CV risk factors and subclinical atherosclerosis. First, the low disease activity and the meticulous control of CV risk factors within the study sample. Additionally, these CV risk factors are mechanisms through which arterial stiffness and IMT might be enhanced,28 further limiting these associations too. Indeed, in a previous study describing a link between PA and IMT in SLE, this association did not remain significant after controlling for traditional CV risk factors.27 The inclusion of highly active patients in our study may account for these discrepancies in relation to previous studies analyzing PA. Furthermore, accelerometers may capture distinct facets of PA compared to self-reported data in SLE.29 Moreover, in this study sample, participants with greater levels of PA were older and presented a higher prevalence of comorbidities,25 probably due to a higher degree of motivation to move, or a more intensive and strict CV recommendations by their physicians, which might have influenced our results. Finally, the limited sample size at follow-up, especially for IMT, might have underpowered the results.
This study has limitations that must be acknowledged. The relatively large loss to follow-up of participants resulted in a relatively small sample size that limits the statistical power of the analyses and the ability to achieve statistically significant results. It is important to note that the study was fundamentally exploratory, with the goal of generating new ideas and hypotheses and establishing a foundation for future research. Future studies with larger samples (perhaps through multicenter cohorts since SLE is a rare disease in Spain) are needed to confirm or contrast these findings. In addition, it is crucial to incorporate strategies aimed at reducing loss to follow-up, particularly for outcomes like intima-media thickness, where a larger sample size may be necessary to achieve adequate statistical power. Also, the inclusion criteria may impact the generalizability of the findings to female SLE patients with mild disease activity and a mean age of 43. In this regard, forthcoming studies could embrace a more diverse cohort of women with SLE, considering factors such as: age (including those older than 60 years and younger than 18), a broader range of disease severities, clinical stability, and treatment modalities (such as biological treatments or higher doses of prednisone), family history of cardiovascular disease (to evaluate the genetic impact), and demographic characteristics. Moreover, the limited sample size constrains our ability to address potential confounding variables in the relationship between PA, ST, fitness, and CV risk factors, aiming to maximize parsimony and avoid overfitting the model. Factors such as general treatments (particularly those mitigating CV risk), the presence of comorbidities, or smoking merit consideration. Given the dynamic nature of SLE, future studies will benefit from registering and considering years of inflammation exposure and potential organ damage. Furthermore, the COVID-19 pandemic significantly influenced this study, creating challenges in reaching and measuring participants during the 3-year follow-up. The strengths of this study include the use of accelerometers which allowed us to quantify ST and PA more accurately. Interestingly, complementing accelerometer data with self-reported questionnaires, which offer descriptive insights into the types of physical activity, could further enhance this measure.29 Also, to better describe CV health in SLE, both traditional and novel CV risk factors were considered.
ConclusionsThe present study evidenced that PA, fitness, and most studied CV risk factors remained stable over a 3-year follow-up in adult women in SLE with mild disease activity. Only marginal changes toward deterioration in LDL and PWV and improvement in diastolic blood pressure over the 3 years were observed. Overall, CV risk factors and subclinical atherosclerosis were not longitudinally associated with PA or ST and contradictory weak associations were found for physical fitness. These preliminary findings pave the way for future studies with larger and more heterogeneous sample size assessing the protective role of PA and fitness in relation to CV health in SLE.
Ethical considerationsAll participants received detailed information about the study procedures and signed informed consent before being included. The Research Ethics Committee of Granada reviewed and approved the study protocol.
FundingBlanca Gavilán-Carrera was supported by the Consejería de Universidad, Investigación e Innovación de la Junta de Andalucía, “PAIDI 2020 Grant Program” (ref: POSTDOC_21_00308). Elena Martínez-Rosales was supported by PPIT-UAL, Junta de Andalucía-FEDER 2021–2027. Program: 54.A. Ref: CPUENTE2023/05. This work was supported by Fundación para la Investigación Biosanitaria de Andalucía Oriental – Consejería de Salud y Familias (ref: PIER-0223-2019) and by the UALtransfierE program from the University of Almería [ref. TRFE-SI-2022/017].
Conflicts of interestThe authors have no conflicts of interest to declare.
The followings are the supplementary data to this article:
