


Understanding the gut mycobiota composition and its impact on health requires reliable methods for fungal community assessment. This study explores the influence of DNA extraction methods in GM analysis. Three protocols were evaluated: Qiagen DNeasy blood and tissue kit with mechanical glass bead lysis (DNgb), Thermofisher MagMax Microbiome ultra-nucleic isolation kit automated method (MM), and MM combined with glass beads lysis (MMgb). Fecal samples from healthy volunteers were collected, DNA extracted and ITS2 amplicon library preparation and sequencing performed. Results showed that DNA yields did not significantly differ among methods and the addition of glass bead beating favored the recovery of DNA more appropriate for fungal analysis. Beta diversity revealed distinct clusters, with MMgb showing the most pronounced variation in mycobiota composition, exposing particularly the low abundance taxa. LEfSe analysis identified significant differences in the abundance of fungal species among the extraction methods. Samples extracted with bead beating were enriched in filamentous species, while those without this step showed higher relative abundance of yeast fungi. This study underscores the importance of selecting appropriate DNA extraction methods for accurate characterization of the gut mycobiota, emphasizing the need for standardized methodologies to ensure reproducibility and reliability in microbial data acquisition.
Comprender la composición de la micobiota intestinal y su impacto en la salud requiere el uso de procedimientos estandarizados y confiables. Este estudio exploro la influencia de los métodos de extracción de ADN en el análisis de la micobiota intestinal. Se evaluaron tres procedimientos: 1) Qiagen DNeasy para sangre y tejido con lisis mecánica con perlas de vidrio (DNgb); 2) Thermofisher MagMax Microbiome Ultra-Nucleic Isolation kit automatizado (MM), y 3) MM combinado con lisis con perlas de vidrio (MMgb). Se colectaron muestras de materia fecal de voluntarios sanos; se extrajo el ADN y se realizó la secuenciación de la región ITS2 mediante secuenciación masiva (NGS). El rendimiento de ADN fue comparable entre los distintos métodos; la incorporación de la lisis mecánica favoreció la recuperación de un ADN óptimo para el análisis fúngico. Los estudios de beta diversidad revelaron clusters diferentes; el método MMgb mostró una variación pronunciada en la composición de la micobiota, evidenciando particularmente los grupos menos abundantes. Los análisis LefSe detectaron diferencias significativas en la abundancia de especies fúngicas según el método de extracción de ADN y revelaron que las muestras extraídas con lisis mecánica estuvieron enriquecidas en especies filamentosas, mientras que aquellas obtenidas sin esta etapa mostraron mayor abundancia de levaduras. Nuestro estudio enfatiza la importancia de la selección apropiada de los métodos de extracción de ADN para una caracterización precisa de la micobiota intestinal, destacando la necesidad de protocolos estandarizados para asegurar la reproducibilidad y la confiabilidad en la adquisición de datos microbianos.
The human gastrointestinal tract is a complex ecosystem hosting a myriad of microorganisms, including bacteria, viruses, and fungi, collectively forming the gut microbiota (GM). While extensive research has demonstrated the pivotal role of bacterial microbiota in human health and disease, the significance of the fungi within the human gut, collectively known as the gut mycobiota (GM), has gained recognition in recent years. GM contributes to the synthesis of metabolites and play integral roles in maintaining homeostasis, influencing nutrition, metabolism, and immune responses. The increasing interest in gut mycobiota underscores its potential implications for overall human health25.
Previous studies, such as those by Richard and Sokol20, Halwachs et al.10, and Wu et al.25, have made substantial contributions to understanding GM composition, environmental interactions, and its involvement in gastrointestinal diseases. Their work has shed light on the critical issues surrounding mycobiota analysis, disrupted equilibriums in GM, and potential clinical opportunities arising from the study of fungal communities.
In elucidating the complexity of the gut mycobiota, studies have employed advanced molecular techniques, particularly next-generation sequencing (NGS), to analyze fungal communities present in the intestinal milieu. Generally, many culture-independent methods have been developed, such as sequencing for 18S ribosomal DNA and internal transcribed spacer regions (ITS, 1 and 2). However, the reliability and reproducibility of the results obtained from these analyses are contingent upon various methodological factors; variability in results can stem from all of the steps in the human microbiome study process including sample collection, primer selection, sequencing, and bioinformatics pipelines (assignment algorithms and databases), with the choice of DNA extraction method standing out as a critical determinant8.
Standardization in microbiome analyses is fundamental to reliably study the human microbiome. As stated above, DNA extraction was identified by the MicroBiome Quality Control (MBQC) project22, the International Human Microbiome Standards (IHMS) group23, among others, as contributing a majority of experimental variability. This underscores the need for a comprehensive investigation into the impact of DNA extraction methods before assessing gut fungal communities.
A variety of protocols are available to extract microbial DNA from human samples, the source of variability among them could be related to multiple factors including reagents, type of lysis, such as mechanical or enzymatic, differences between laboratory personnel or automation of DNA extraction, among many other factors.
In light of these evidences, our study aims to explore the methodological steps of DNA extraction methods and their influence on gut fungal community assessment. Based on previous research15, we have chosen to focus on the most commonly employed DNA extraction methods, namely the Qiagen DNeasy blood and tissue kit and the MagMax Microbiome ultra-nucleic isolation kit coupled or not with mechanical lysis.
Through a comparative analysis, we seek to provide insights into the efficiency and potential biases introduced by these methods, with a particular emphasis on their implications for accurately characterizing the GM. By addressing this critical aspect of GM analysis, we assessed and compared the performance of three DNA extraction methods, in order to provide a non-biased view of the composition of the fungi communities present in local human stools as a starting point to further establish a consensus profile of healthy individuals.
Materials and methodsSubjectsTen volunteers were selected for this study based on the following inclusion criteria: over 18 years of age, no diagnosis of gastrointestinal disease, no recent medical treatments including antibiotics, drugs, or supplements that could affect the gut microbiota. Individuals involved in weight loss programs and those with neuropsychological disorders, immunosuppression, tumors, or autoimmune diseases were excluded. The study was approved by the Institutional Review Board of the C.I.E.I.S Del Niño y Del Adulto Polo Hospitalario, Ministerio de Salud de la Provincia de Córdoba (Córdoba, Argentina), 18 de mayo de 2020, acta número 8. Written informed consent was obtained from all participants prior to their enrollment in the study, and the research adhered to relevant guidelines and regulations.
Stool sample collectionFor the collection of fecal samples, volunteers were given a sterile, airtight collection kit to collect a fresh stool sample at home. The collected stools were frozen, transported to the laboratory within 24h, and stored at −40°C until analysis.
DNA extractionStool samples were handled under a laminar flow hood using a sterile technique. Microbial DNA was isolated from stool using three different DNA extraction methods: the Qiagen DNeasy Blood & Tissue kit with the addition of glass beads beating prior to the manufacturer's instructions (DNgb); the Thermofisher MagMax Microbiome ultra-nucleic isolation kit automated method on a KingFisher Duo Prime purification system (MM), following the manufacturer's protocol and MM combined with glass beads beating prior to the manufacturer's instructions (MMgb).
Briefly, 100mg of stool were used for each extraction method; when tubes for glass bead beating were required (DNgb and MMgb) they were prepared by adding 250mg of 425–600μm glass beads (Sigma-Aldrich, USA) per tube. Samples were first incubated at 65°C for 30min in 200μl of ATL buffer, followed by the addition of Proteinase K (20μl) and glass bead beating for 10min.
The concentration of extracted DNA was measured using fluorometric quantitation with the Qubit dsDNA high-sensitivity kit in a Qubit 2 (Thermo Fisher Scientific, Carlsbad, CA, USA) and purity was assessed by the 260/280 absorbance ratio on the NanoDrop™ One equipment (Thermo Fisher Scientific, Carlsbad, CA, USA). The extracted DNA was stored at −40°C.
ITS2 amplicon library preparationExtracted DNA was amplified using the Applied Biosystems ProFlex PCR System (ThermoFisher Scientific). PCR amplification was carried out in two steps:
First-round amplification: Primers used for DNA fungal amplification were ITS1 (5′-TCC GTA GGT GAA CCT GCG G-3′), and ITS4 (5′-TCC TCC GCT TAT TGA TAT GC-3′)7. A 15-μl PCR mixture containing 12.5μl of AmpliTaq Gold 360 Master Mix, 1μl of 360 GC Enhancer (4% v/v), 0.2μM of each primer, and 5μl of DNA template (Applied Biosystems) was used. PCR cycle conditions were: initial denaturation at 95°C for 10min; 35 cycles of 95°C 30s, 55°C 30s and 72°C 1min; and a final extension at 72°C for 7min.
Second-round amplification: ITS86 (5′-GTG AAT CAT CGA ATC TTT GAA C-3′) and ITS4 primers7 were used. Semi-nested PCR amplification mixture contained 3μl of first-round product in 30μl of PCR reaction mix with 15μl of AmpliTaq Gold 360 Master Max, 1.2μl of 360 GC Enhancer (4%, v/v), 0.2μM of each primer (Applied Biosystems). The cycling program was the same as above. Then, 20μl of second-round product was partially digested, barcodes were ligated to the amplicons (Ion Plus Fragment Library kit, Thermo Fisher Scientific, Carlsbad, CA, USA) and the product was purified using Agencourt AMPure XP beads (Beckman Coulter; Pasadena, CA, USA) according to the manufacturer's protocol.
ITS2 amplicon sequencing and taxonomic identificationSequencing was performed using the Ion 510™ & Ion 520™ & Ion 530™ Kit – Chef (Thermo Fisher Scientific, Carlsbad, CA, USA) on the Ion GeneStudio S5 Platform (Thermo Fisher Scientific, Carlsbad, CA, USA) according to the manufacturer's instructions.
A mock community dataset was generated from mixed fungal genomic DNA from: Candida parapsilopsis, Candida tropicalis, Candida albicans, Candida krusei, Candida dubliniensis, Cryptococcus neoformans, Cryptococcus sp., Curvularia sp., Alternaria sp., Fusarium oxysporum, Aspergillus sp., Saccharomyces cervisiae and Trichosporum mucoides.
Sequence quality control, annotation, and taxonomical assignment were performed using the DADA2 v1.22.04, phyloseq v1.38.014, and microbiome v1.16.013 packages in R software v4.1.219 following the standard pipeline from demultiplexed fastq files. DADA2-formatted Unite Database, Version 9.0 (Updated October 2022), was used for taxonomic assignment1. Linear discriminant analysis effect size (LEfSe) was performed using the microbiomeMarker package5. Sequencing data are accessible in the National Center for Biotechnology Information (NCBI) database under BioProject accession number PRJNA1074688 (https://www.ncbi.nlm.nih.gov/bioproject/PRJNA1074688) accessed on 8th February 2024.
Statistical data analysisThe statistical analysis was conducted and visualized using R v4.1.2 software19. The normality of variables was assessed using the Shapiro–Wilk test. ANOVA or Friedman tests were performed to analyze more than two simultaneous variables, all of which involved paired samples. Pairwise comparisons were conducted using the Wilcoxon signed-rank test if the Friedman test yielded a significant result. Similarly, the paired t-test was employed when significant results were obtained from the ANOVA test. The p-values were adjusted using the Bonferroni multiple-testing correction method. For the LEfSe analysis, linear discriminant analysis (LDA) scores of 3 and a p-value <0.05 were considered significant. All data were visualized using ggplot2 v3.4.024 and ggpubr v0.5.02. In all cases, a p-value <0.05 was considered significant.
Alpha diversity metrics, including observed ASVs, Shannon, and Simpson indices, as well as Beta diversity metrics (PCA and UniFrac, both weighted and unweighted), were computed based on the ASV table representing the relative abundances of fungal taxa from the microbiome v1.6.0 R package13. The relationship between DNA extraction methods and the overall GM composition was assessed using the Adonis test implemented through the Adonis function in the vegan v2.4.6 R package, as well as ANOSIM18.
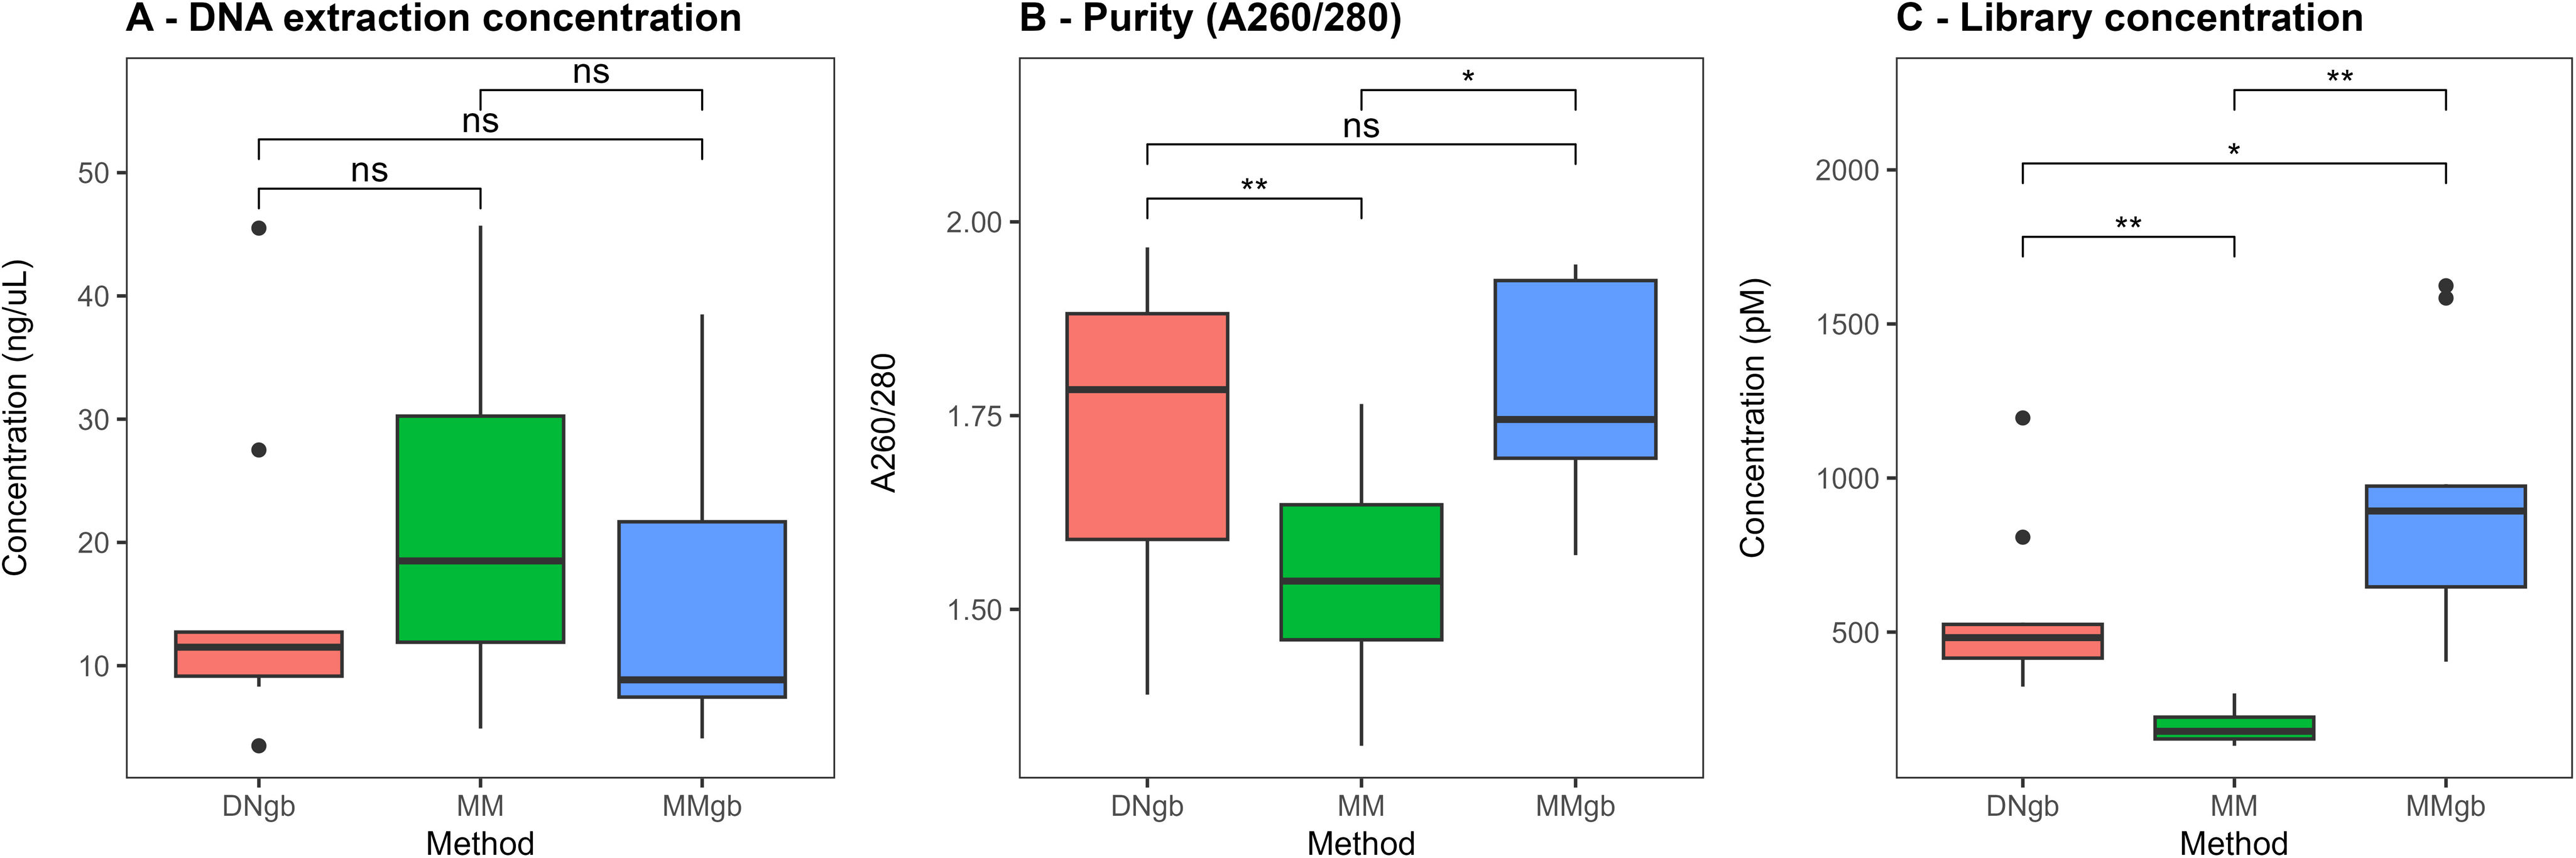
ResultsFigure 1 shows the performance of the three different DNA extraction methods assessed, evaluating the quantity and purity of the DNA recovered.
, purity measured as A260/280 (B), and library concentration expressed in pM (C), DNgb method (pink), MM method (green) and MMgb method (blue). The solid black lines indicate the medians, and the lower and upper bounds of the box represent the 25 and 75% quartiles, respectively. Outliers are indicated as black circles and represent samples falling outside the 10 and 90% quartiles (*p≤0.05, **p≤0.01, ns=no significant).")
Box plots showing DNA concentration expressed in ng/μl (A), purity measured as A260/280 (B), and library concentration expressed in pM (C), DNgb method (pink), MM method (green) and MMgb method (blue). The solid black lines indicate the medians, and the lower and upper bounds of the box represent the 25 and 75% quartiles, respectively. Outliers are indicated as black circles and represent samples falling outside the 10 and 90% quartiles (*p≤0.05, **p≤0.01, ns=no significant).
As can be seen, there are no significant differences in the DNA quantities recovered (p=0.741) (Fig. 1A). The addition of glass bead beating to the extraction protocols yielded higher purity compared to MM, which produced a ratio lower than the optimal suggested (Fig. 1B). The relative impact of these methods was then assessed with respect to the concentration of ITS 2 amplicon libraries obtained using the same starting amount of extracted DNA. Of note, the concentration of ITS2 libraries was significantly different when the three methods were compared (p=0.0002), with the highest corresponding to DNA samples obtained using MMgb (Fig. 1C). Supplementary Tables 1 and 2 show the corresponding values and statistical comparisons for each parameter analyzed.
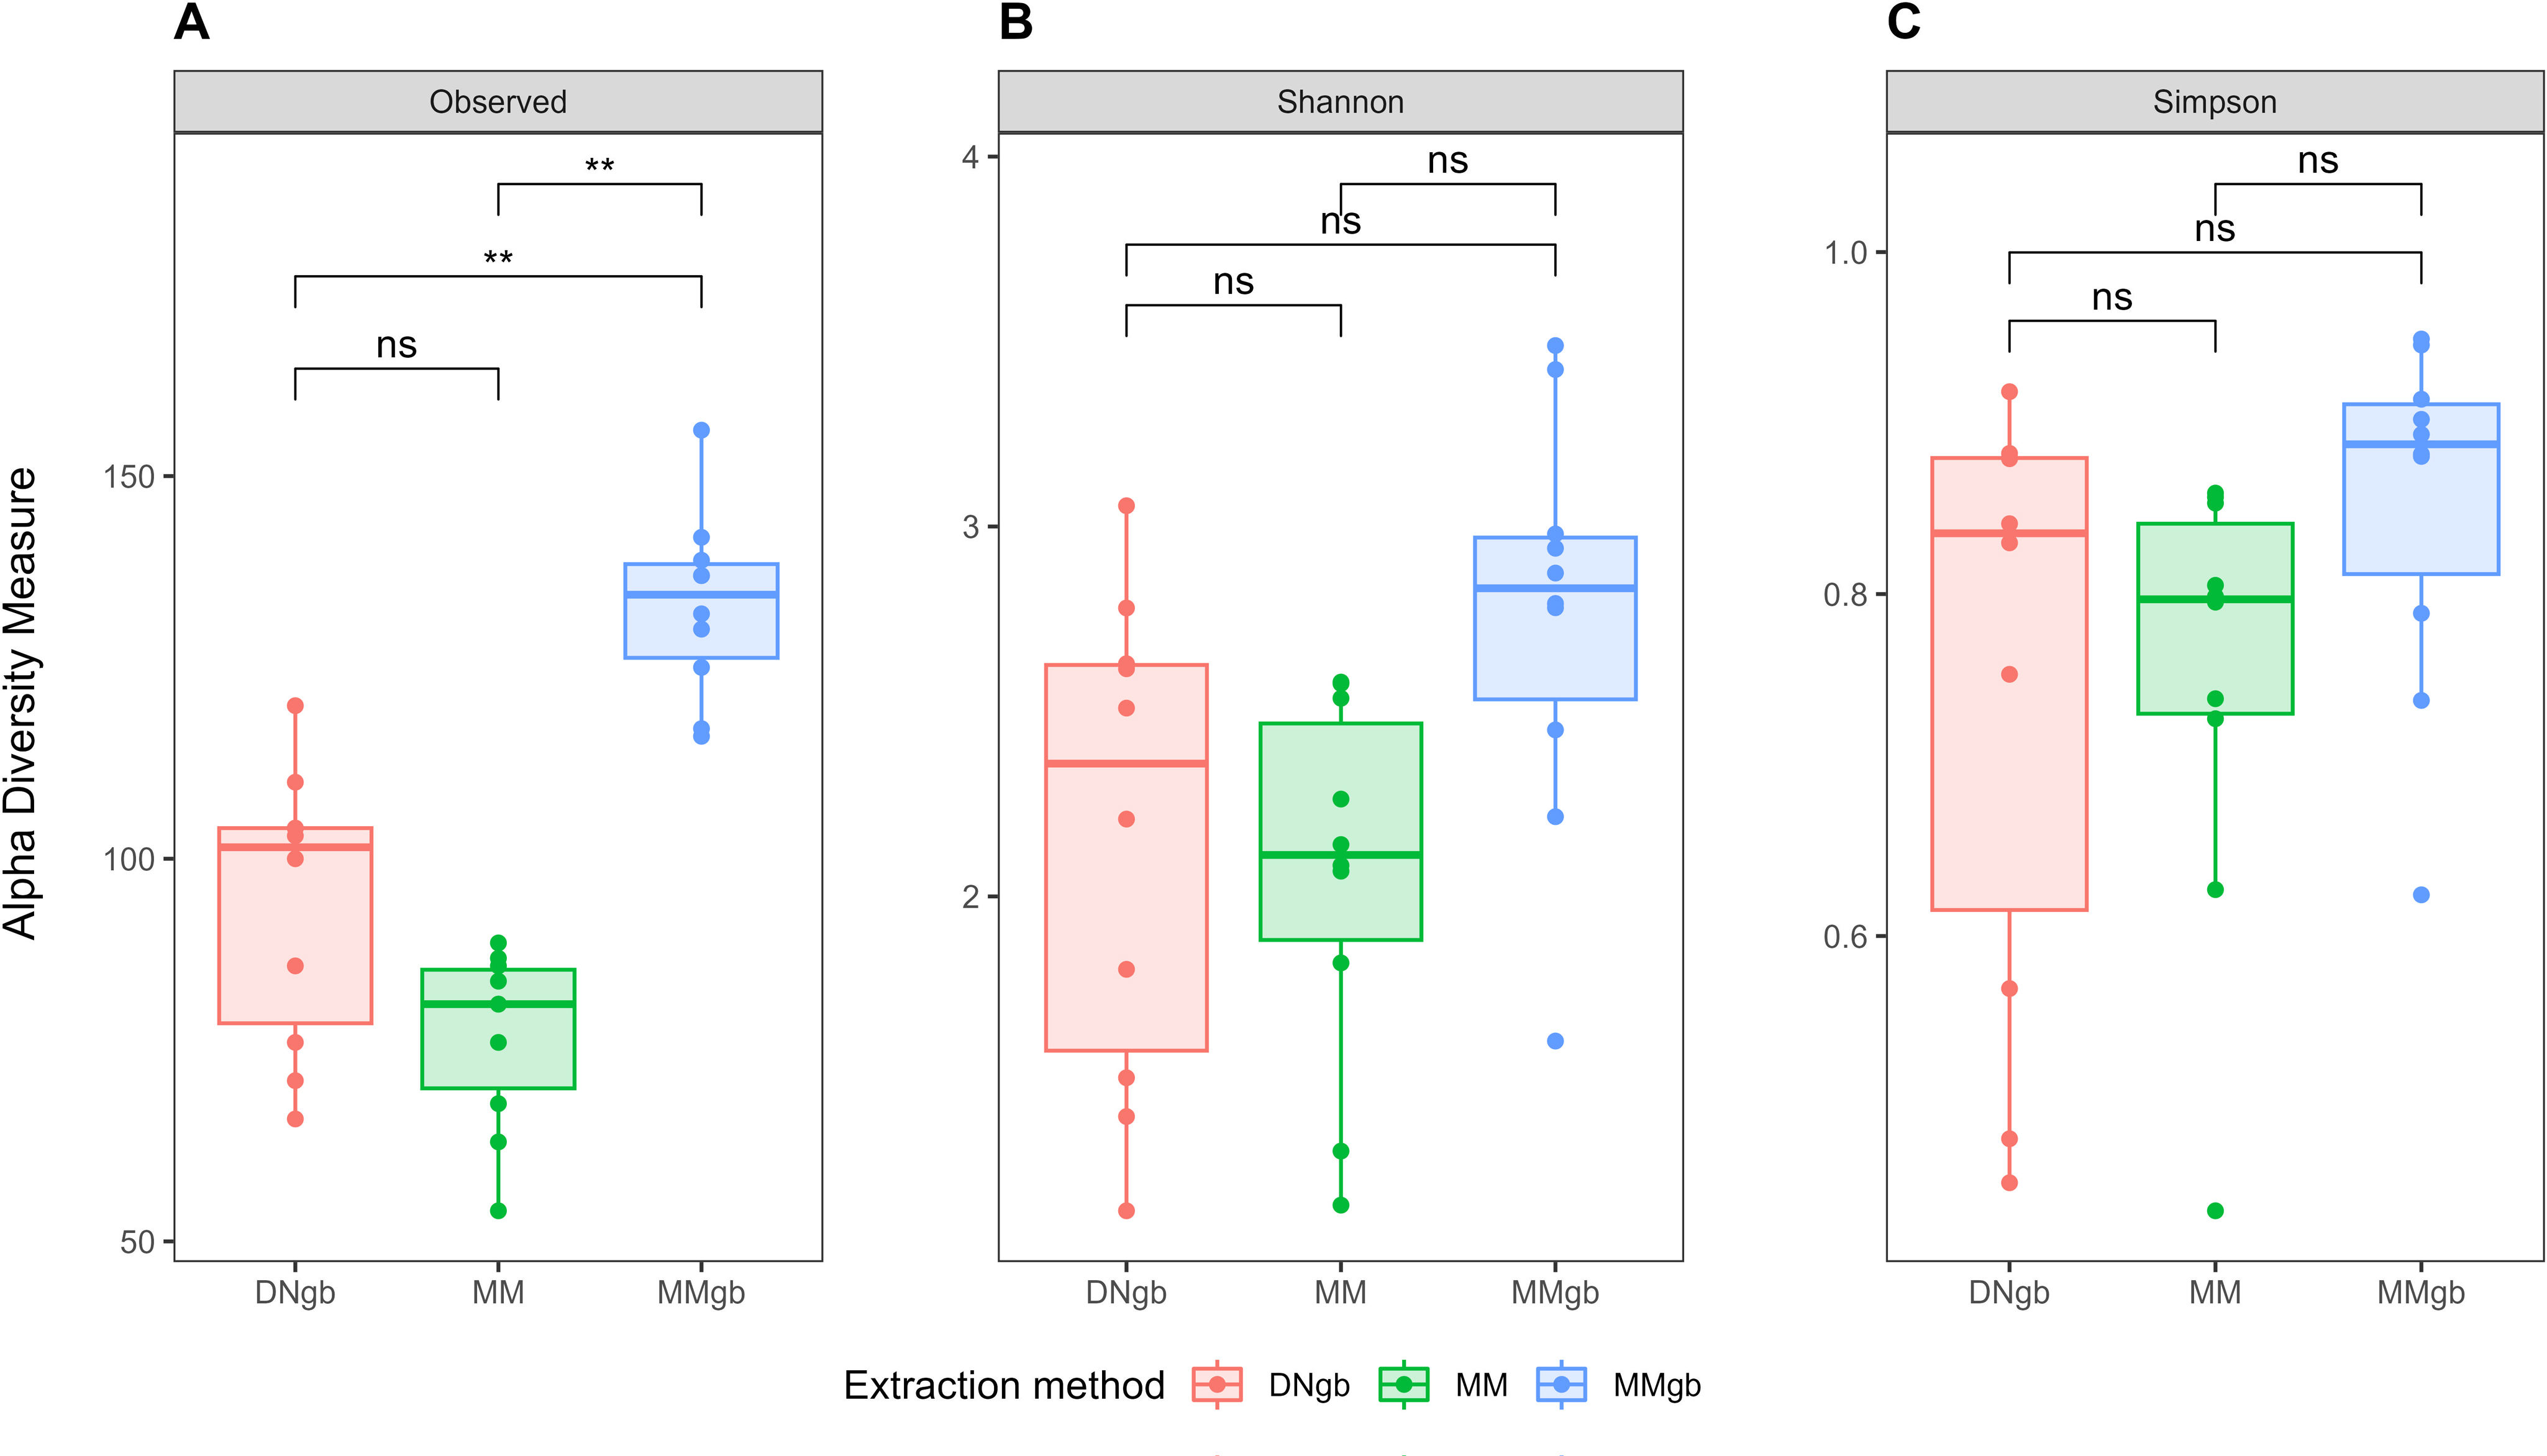
Diversity analysisThe DNA extraction method significantly affected the community assessment, resulting in significant differences in the number of ASV observed (Fig. 2A). Instead, no significant differences were found for the Simpson or Shannon indices (Figs. 2B and C). Supplementary Tables 3 and 4 show the corresponding values and statistical comparisons for each parameter analyzed.
, Shannon index (B), and Simpson index (C) of each group, DNgb method (pink), MM method (green) and MMgb method (Blue). The solid black lines indicate the medians, and the lower and upper bounds of the box represent the 25 and 75% quartiles, respectively. Outliers are indicated as circles outside the boxes and represent samples falling outside the 10 and 90% quartiles (**p≤0.05, ns=not significant).")
Analysis of alpha diversity among methods. Box plots showing observed ASV index (A), Shannon index (B), and Simpson index (C) of each group, DNgb method (pink), MM method (green) and MMgb method (Blue). The solid black lines indicate the medians, and the lower and upper bounds of the box represent the 25 and 75% quartiles, respectively. Outliers are indicated as circles outside the boxes and represent samples falling outside the 10 and 90% quartiles (**p≤0.05, ns=not significant).
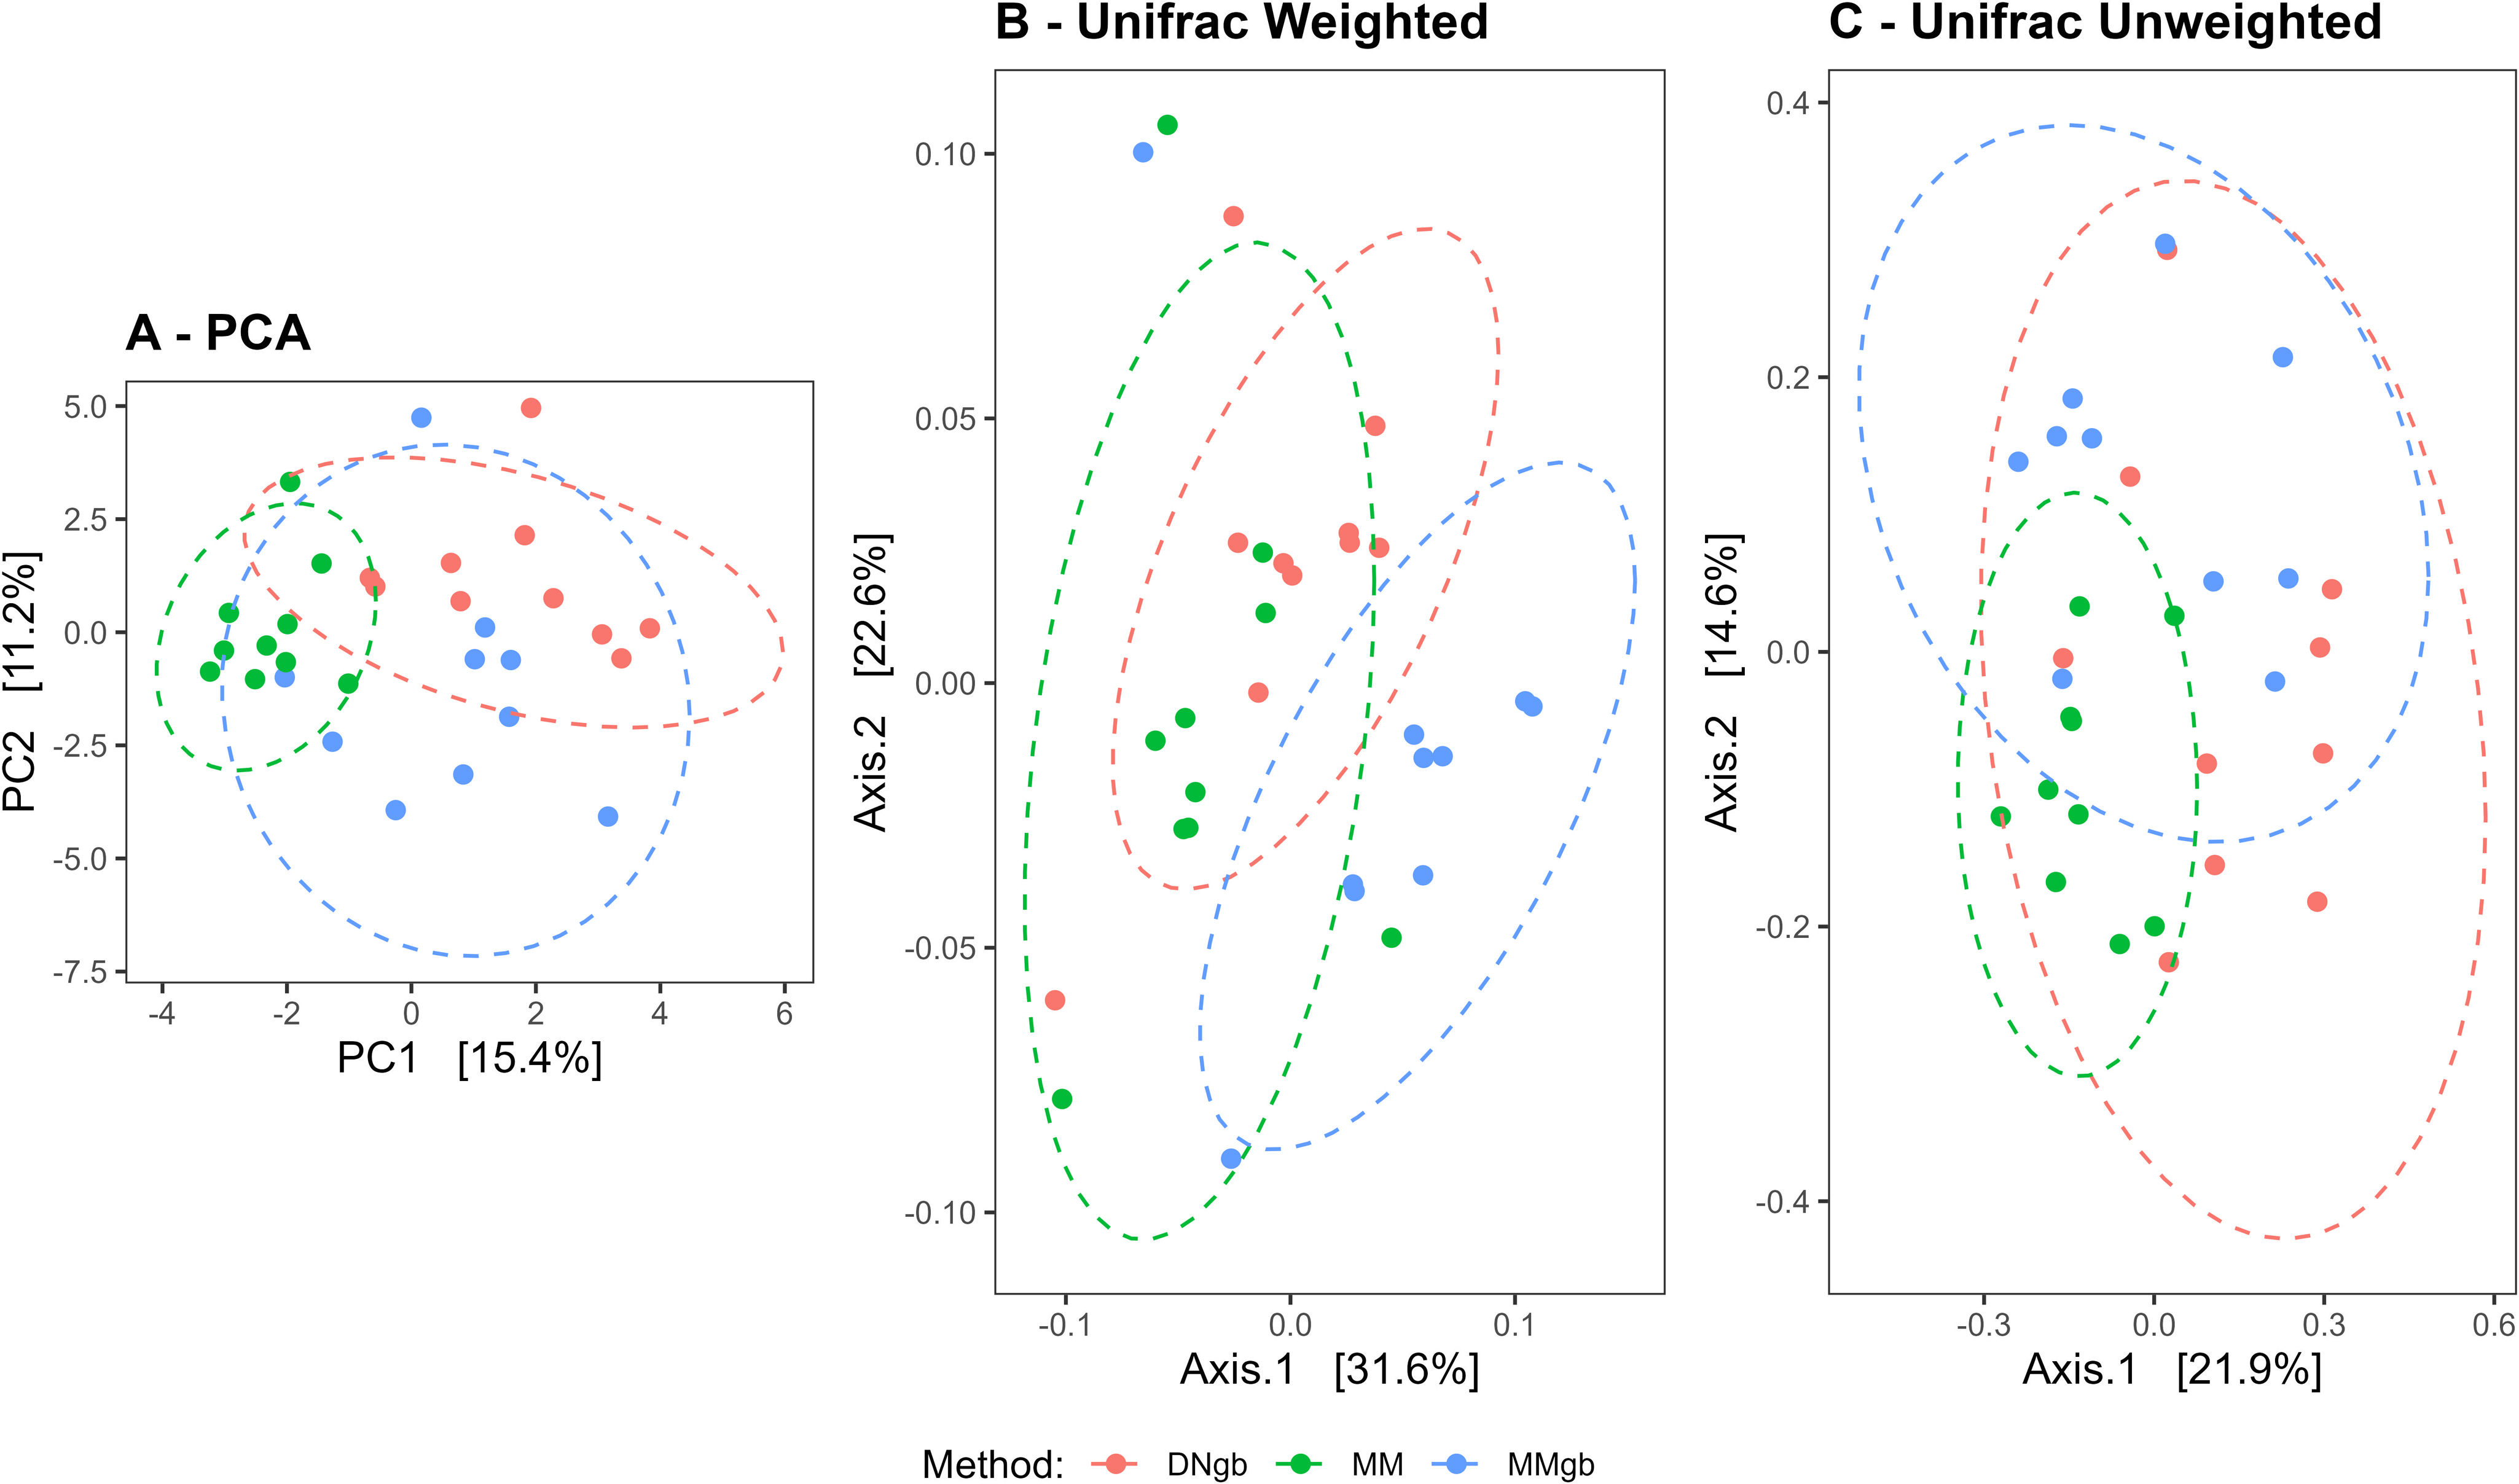
Beta diversity studied by PCA revealed three significantly different clusters according to the DNA extraction method used (Adonis: p<0.001, R2=0.3562; ANOSIN: p=0.001, R2=0.4193) (Fig. 3A). Additionally, community distance measured using UniFrac weighted and unweighted tests showed statistically significant dissimilarities among communities (ANOSIN: p=0.001, R2=0.3725; ANOSIN: p=0.001, R2=0.3140, respectively) indicating that the variation in mycobiota composition among the groups is more pronounced when considering relative taxa abundances (Figs. 3B and C).
 Comparison of the mycobiota profiles using the principal component analysis (PCA). The first two principal components, PC1 and PC2, were plotted (Adonis: p<0.001, R2=0.3562; ANOSIN: p=0.001, R2=0.4193). (B and C) Comparison based on the weighted and unweighted UniFrac distances respectively (ANOSIN: p=0.001, R2=0.3725; and p=0.001, R2=0.3140). DNgb method (pink), MM method (green) and MMgb method (blue).")
Beta diversity analysis. (A) Comparison of the mycobiota profiles using the principal component analysis (PCA). The first two principal components, PC1 and PC2, were plotted (Adonis: p<0.001, R2=0.3562; ANOSIN: p=0.001, R2=0.4193). (B and C) Comparison based on the weighted and unweighted UniFrac distances respectively (ANOSIN: p=0.001, R2=0.3725; and p=0.001, R2=0.3140). DNgb method (pink), MM method (green) and MMgb method (blue).
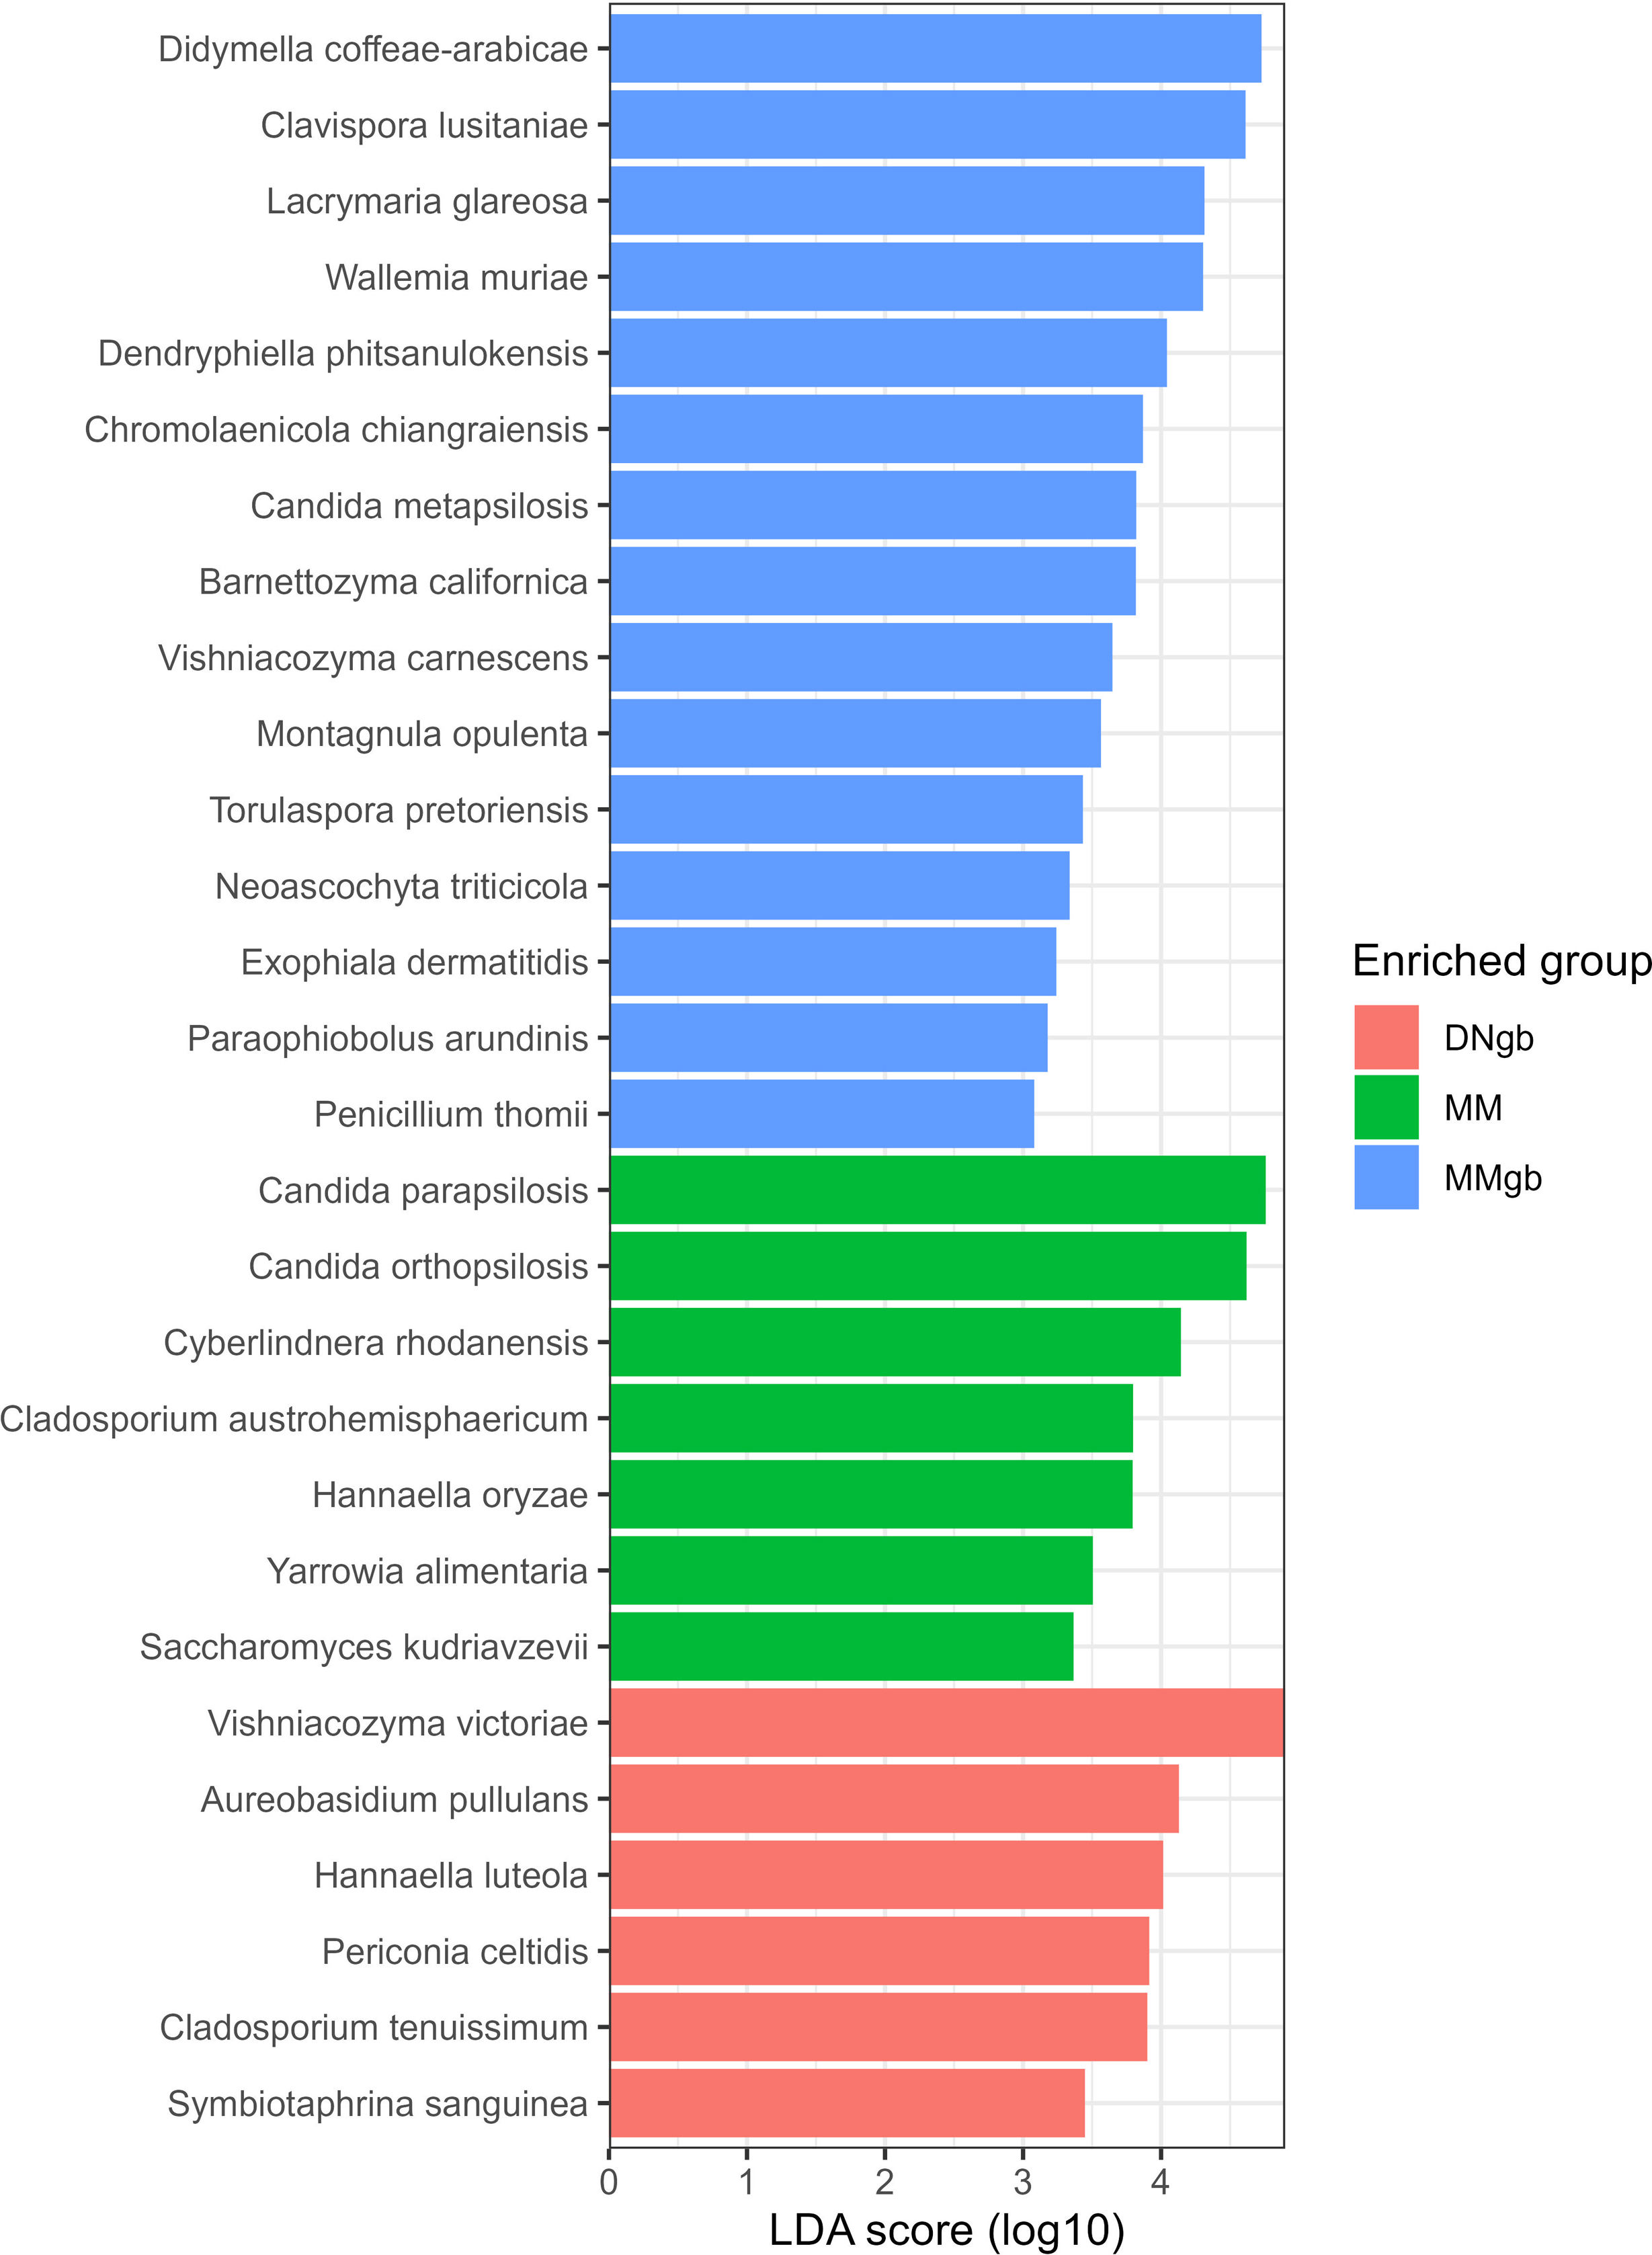
To determine which taxa were enriched in the different groups, linear discriminant analysis (LDA) coupled with effect size measurements (LEfSe) was applied. Significant differences in the abundance of 28 species were found among the groups: 6 for DNgb; 6 for MM and 16 for MMgb. Figure 4 shows the effects of differences.
 coupled with effect size measurements (LEfSe). The bar plots represent the significantly different genus among the DNgb (pink), MM (green) and MMgb (blue) methods. LDA scores >3 and p-value <0.05 were considered significant.")
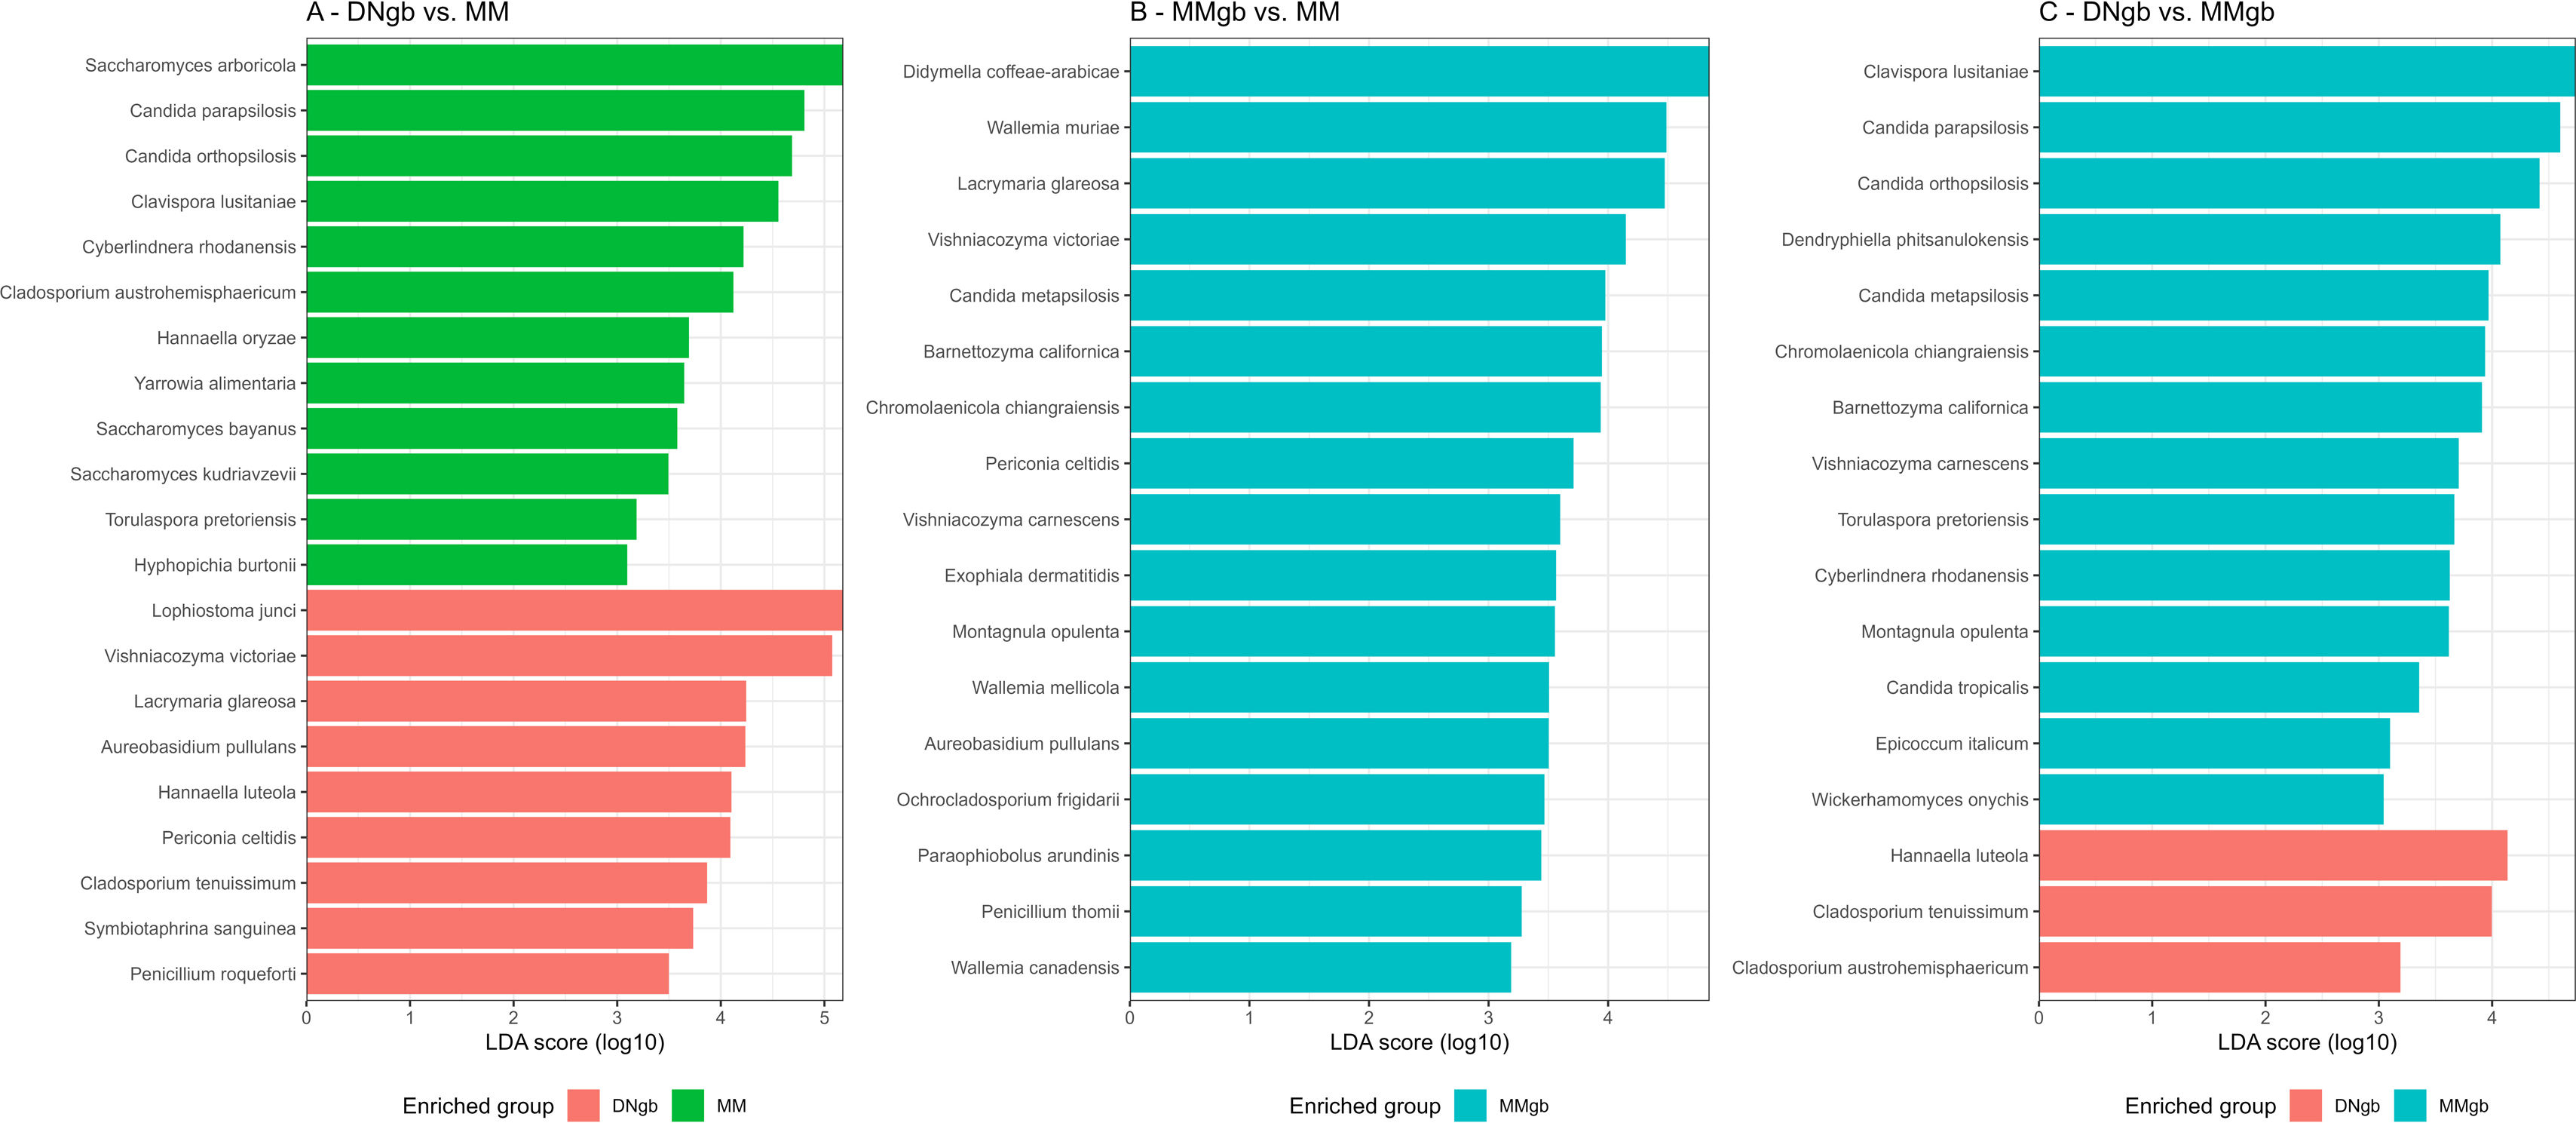
To comprehensively understand the effect of each method of DNA extraction on GM composition, LEfSe pairwise comparisons were performed (Fig. 5). Notably, MMgb exhibited the highest efficacy, recovering the majority of identified species, whereas the other two methods showed variability, retrieving some species while leaving others unidentified.
 Comparison of DNgb vs MM method. (B) Comparison of MMgb vs MM method. (C) Comparison of DNgb vs MMgb method. The bar plots represent the significantly different genera between the DNgb (pink), MM (green) and MMgb (blue) methods. LDA scores >3 and p-value <0.05 were considered significant. In (B) no bars were observed for the MM method as it did not present enriched genera when compared with MMgb.")
LEfSe pairwise comparisons between DNA extraction methods. (A) Comparison of DNgb vs MM method. (B) Comparison of MMgb vs MM method. (C) Comparison of DNgb vs MMgb method. The bar plots represent the significantly different genera between the DNgb (pink), MM (green) and MMgb (blue) methods. LDA scores >3 and p-value <0.05 were considered significant. In (B) no bars were observed for the MM method as it did not present enriched genera when compared with MMgb.
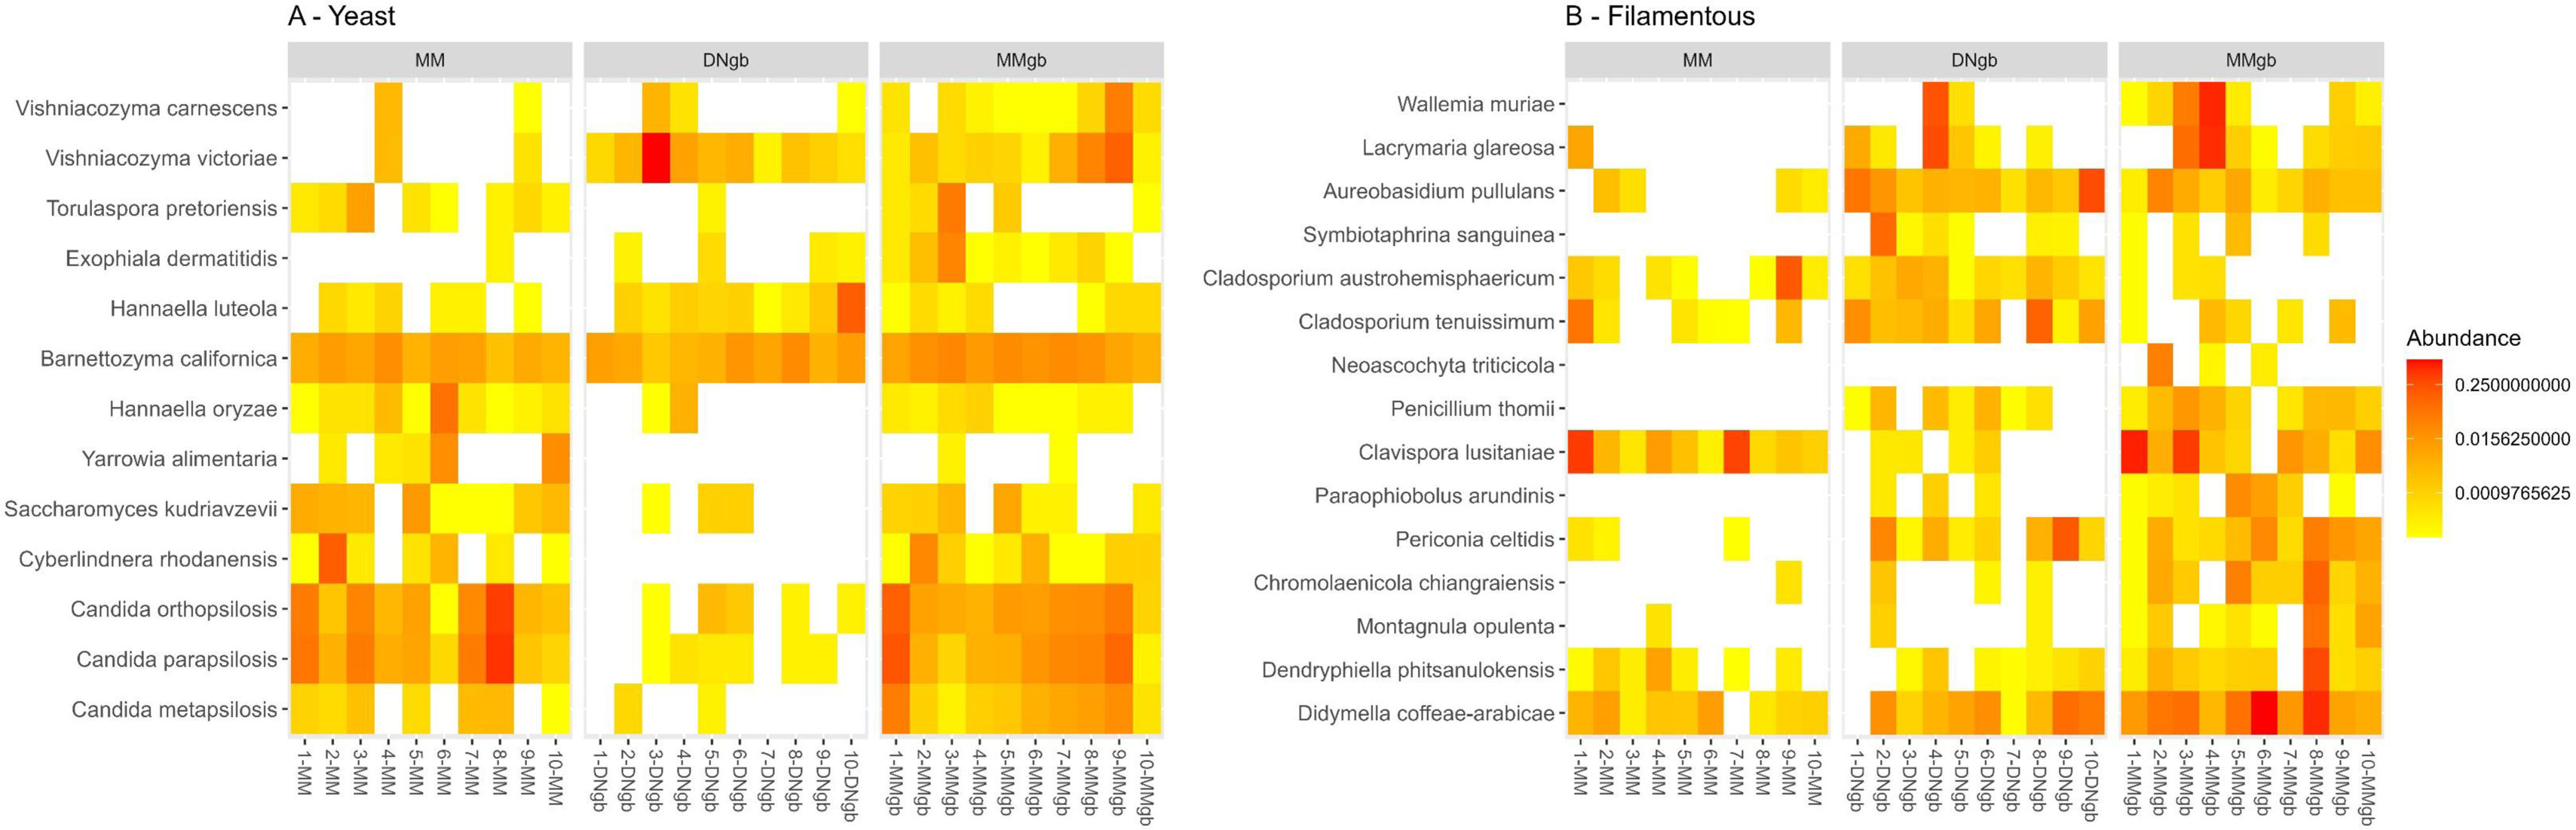
Figure 6 shows the results obtained when considering structural features of fungal species (i.e. yeast vs filamentous) identified with differential abundance by LEfSe, according to the DNA extraction method. It can be seen that the addition of the glass bead beating step favored the recovery of filamentous species in contrast to MM. On the other hand, both, MM and MMgb led to the enrichment of yeast compared to DNgb.
 and filamentous fungi (B) according to DNA extraction method. The plot shows the distribution of the relative abundance of species that presented differential abundance in the LEfSe analysis. The colors represent intensity of abundance, from low (yellow) to high (red), with missing values represented in white. Labels have been used and values have been rounded to zero for better visualization.")
Heatmap of species abundance for yeasts (A) and filamentous fungi (B) according to DNA extraction method. The plot shows the distribution of the relative abundance of species that presented differential abundance in the LEfSe analysis. The colors represent intensity of abundance, from low (yellow) to high (red), with missing values represented in white. Labels have been used and values have been rounded to zero for better visualization.
In this study, we compared the performance of three DNA extraction protocols based on quantity, purity and impact on the fungal community composition assessment.
First of all, the yield of nucleic acid did not differ significantly among the methods. With respect to the purity of extracted DNA, all of the methods yielded relatively pure nucleic acids, as assessed by the 260/280 absorbance ratio (>1.8), with the exception of the samples obtained by MM where the ratio was suboptimal; this is probably due to the fact that the addition of the glass bead beating step determines higher homogenization of the stool allowing more efficient washing. When the concentration of ITS2 amplicon libraries was compared, the samples obtained with methods using glass bead beating gave higher values than MM, showing that the addition of this step would favor the recovery of fungal DNA.
The alpha diversity analysis showed significant differences in the number of ASVs observed, however, no significant differences were found in the Shannon and Simpson indices. On the other hand, GM Beta diversity studies showed that fungal community structures varied according to the DNA extraction method, mainly when considering the low relative abundance taxa. These observations are in agreement with previous reports, demonstrating that bead beating enhanced a more precise determination of microbial diversity by enabling DNA extraction of difficult-to-lyse microorganisms6,21.
The LEfSe analysis determined that samples extracted by methods involving bead beating, were enriched in filamentous species such as Penicillium thomii and Paraophiobolus arimidinis, among others, compared to those extracted by methods without that step. In contrast, it is important to remark that yeast species, such as Yarrowia alimentaria, Saccharomyces kudriavzevii, were better recovered in the MM method, regardless of the addition of the bead beating step, this probably relates to the lysis buffer composition used. Interestingly, although DNgb is being used by many groups involved in mycobiota studies3,9,16, the expected use of this kit is the extraction of blood and tissue and not microbial DNA. Not including a bead-beating step in the DNA extraction procedure may result in higher relative abundance of yeast fungus. Furthermore, the inclusion of mechanical lysis is important to avoid losing many pathogenic species with the capacity to go through reversible morphological transition from yeast to filamentous cells. For example, numerous pathogenic Candida species have the capability to switch between yeast and filamentous forms, a process that is reversible. This morphological transition, particularly observed in Candida albicans, the most commonly isolated fungal pathogen in humans, is linked to its virulence and pathogenic potential12.
Therefore, a bead-beating step should be added to DNA extraction kits that do not include mechanical lysis steps (such as the Qiagen and ThermoFisher kits) for DNA extraction from fecal samples; considering that chitin is a main component in fungal cell walls, harsher mechanical lysis methods should be employed for fungal DNA extraction because they allow to capture all the fungal diversity in the samples11,17. In agreement with other mycobiome studies this work has shown the presence of fungi in the human gut. As research on the gut mycobiome is still nascent, it is crucial to implement and adhere to standardized methodologies. The selection of suitable DNA extraction techniques and primers, along with meticulous planning will yield clean, high quality, and amplifiable samples.
Our data shows that Thermofisher MagMax Microbiome ultra-nucleic isolation kit on a KingFisher Duo Prime purification system combined with glass beads beating is an efficient fungal DNA extraction method that provides clean, high quality and amplifiable DNA for the generation of high yield ITS2 amplicons for downstream sequencing analysis.
An appropriate DNA extraction method and primer choice, together with careful consideration on samples storage and processing will allow comparing and contrasting findings to provide novel insight into the gut mycobiota.
ConclusionsThe present study assessed and compared the effects of different DNA extraction methods with a combination of kits, bead beating and automation on the yield and purity of nucleic acids, fungus diversity and community profiles. Based on the results of this study, physical disruption with 0.1mm beads followed by DNA extraction with the KingFisher Duo Prime is the preferred method for isolation of fungal DNA from diagnostic samples.
Our results aim to contribute valuable information to the growing body of knowledge surrounding gut fungal communities, ultimately enhancing the accuracy and reliability of future investigations in this field.
It is essential to highlight that our comprehension of the human gut microbiota in both health and disease relies on the precise and consistent acquisition of microbial data.
CRediT authorship contribution statementConceptualization: N.D.P., C.M., V.L.B. and S.A.P.; Data curation: N.D.P. and C.M; Formal analysis: N.D.P., M.G.M., and C.M.; Funding acquisition: L.S.C., V.L.B., C.M. and S.A.P.; Investigation: N.D.P. and C.M.; Methodology: N.D.P., M.G.M., and C.M.; Project administration: L.S.C., V.L.B., and S.A.P.,; Resources: L.S.C. and S.A.P.; Software: N.D.P.; Supervision: L.S.C. and S.A.P.; Validation: N.D.P., C.M. and S.A.P.; Visualization: N.D.P. and S.A.P.; Writing – original draft: N.D.P. and S.A.P.; Writing – review & editing: L.S.C. and S.A.P.
All authors have read and agreed to the published version of the manuscript.
FundingThis work was supported in part by fundings: Préstamos BID, PICT 2019-04101, PICT 2021-00483. PICT-00357; SECyT-UNC 33620180100408CB and LACE Laboratories SA.
Conflicts of interestThe authors declare no conflict of interest.
AcknowledgmentsThe authors acknowledge Dr. Lizet Luque Aguada and Dr. María Florencia Spesso for providing strains included in the mock control and Dr. Eduardo Fernandez for continued support.
Data availabilitySequencing data are accessible in the National Center for Bio-technology Information (NCBI) database under BioProject accession number PRJNA1074688 (https://www.ncbi.nlm.nih.gov/bioproject/PRJNA1074688).
The following are the supplementary data to this article:
