


Y-chromosome-specific short tandem repeat (Y-STR) markers reside on the non-recombinant portion of the Y chromosome, their inheritance is paternal, they are not detectable in female DNA. These properties make Y-STRs a useful tool in forensic investigations such as sexual assault, parenting, and other violent crimes; likewise they are also useful in genealogical and evolutionary studies. The objective of the research is to expand the scientific evidence of the distribution by region or country of the Y sex chromosome haplotypes. Similar studies in Peruvian populations are scarce due to the smaller number of Y-STR polymorphisms frequently used in Forensic and Population Genetics.
Material and method: In the investigation, 141 DNA samples from the jungle of Peru were analyzed, of which comprised of 104 samples from Iquitos region (Loreto), 29 samples from Awajun (Amazonas) and 8 samples from Tambopata (Madre de Dios). The samples were processed using direct PCR with the Yfiler™ Plus PCR Amplification kit for 27 STRs, the amplified products were analyzed by capillary electrophoresis on the Applied Biosystem™ 3500XL Genetic Analyzer, and the data obtained was imported into the GeneMapper® ID-X v1.5 software to generate the genetic profiles. With the results obtained, the statistical analysis and the population structure were carried out.
Results: Of the 141 samples, 106 unique haplotypes were observed. Gene diversities for each Y-STR marker ranged from .317 to .919. The haplotype diversity for the total sample was .9906. This study supports that the Y-STR haplotypes in this population are highly polymorphic in the analyzed population and, therefore, are very useful in forensic studies of human identification, as well as in population genetics when investigating groups or individuals from Latin America.
Introducción: Los marcadores de repeticiones cortas en tándem del cromosoma Y (Y-STR) se ubican en la región no recombinante del cromosoma Y, su herencia es por vía paterna, no son detectables en el ADN femenino. Estas propiedades hacen de los Y-STR una herramienta útil en las investigaciones forenses, como las agresiones sexuales, paternidades y otros delitos violentos; asimismo son útiles en estudios genealógicos y evolutivos. El objetivo de la investigación es ampliar la evidencia científica de la distribución por regiones o país de los haplotipos del cromosoma sexual Y, estudios similares en poblaciones peruanas son escasas debido al número menor de polimorfismos Y-STR de uso frecuente en genética forense y de poblaciones.
Material y métodos: En la investigación se analizaron 141 muestras de ADN de la selva del Perú, de las que 104 muestras corresponden a la región de Iquitos (Loreto), 29 muestras son Awajun (Amazonas) y 8 muestras de Tambopata (Madre de Dios). Las muestras fueron procesadas empleando PCR directa con el kit Yfiler™ Plus PCR Amplification para 27 STR, los productos amplificados fueron analizados por electroforesis capilar en el AppliedBiosystem™ 3500XL GeneticAnalyzer y los datos obtenidos se importaron al software GeneMapper® ID-X v1.5 para generar los perfiles genéticos. Con los resultados obtenidos se realizó el análisis estadístico y la estructura poblacional.
Resultados: De las 141 muestras se obtuvieron 106 haplotipos únicos. La diversidad genética para cada marcador Y-STR estuvo entre 0,317 y 0,919. La diversidad haplotípica para la muestra total fue de 0,9906. El estudio registra que los haplotipos Y-STR estudiados presentaron elevado polimorfismo en la población analizada y, por lo tanto, son de gran utilidad en estudios forenses de identificación humana, así como en genética de poblaciones cuando se investigan grupos o individuos de América Latina.
Y-chromosomal short tandem repeat (Y-STR) markers are found in non-recombinant regions of the Y-chromosome, and are relevant in forensics because of their paternal inheritance, detection in samples with combined DNA from more than 2 male individuals or combination with female DNA, even if they are found in very low amounts in female DNA. These properties make Y-STRs a useful tool in sexual assault investigations, paternity testing and other violent crimes.1
The Americas was one of the last continents to be colonised by humans, probably by a small population 15,000 to 17,000 years ago. Today, however, it is home to great cultural and linguistic diversity.2
One of the most diverse countries in Latin America is Peru. The Amazon Region or jungle covers about 60% of the Peruvian territory. Its topography is predominantly flat. It is located to the east of the Andes Mountains and forms part of the " Hoya Amazónica.”3 The National Institute of Statistics and Information indicates that the indigenous population of the Peruvian Amazon is 332,975 inhabitants.4 There are 13 indigenous linguistic families living in the Amazon, which in turn are grouped into 60 ethnic groups. Of the 13 language families, Arawak comprises the majority of the indigenous population (38.6%) and Tacana the smallest (.2%).4 These regions are mostly inhospitable and, because of their culture, do not allow biological samples to be taken, and it is difficult to get them accepted for research studies.
In recent years, studies of autosomal STR markers in Peruvian populations have been appearing, finding studies in mestizo populations,5-8 a population from the Peruvian jungle.9 Studies have also focused on some ethnic groups in Peru such as the Aymara10 and with Y-STR in an Ashaninca (n = 54)11 and Aymara (n = 90)12 population with 27 Y-STR and other studies in which 23 Y-STR were analysed in a Chachapoyas (n = 68), Jíbaro (n = 23) and Huancas (n = 10),13 population, but no studies have been conducted in Peruvian jungle populations with a sample of more than 100 individuals and with 27 Y-STR. For this reason, the study carried out has increased the scientific evidence on the frequency distribution and behaviour of a number of Y-STR polymorphisms of consolidated use in forensic and population genetics in Peruvian populations that have been scarcely studied to date.
Material and methodsSamples and experimentsA total of 141 samples were collected from individuals living in the Peruvian jungle on FTA (Copan) cards. Of the total number of samples, 104 came from Iquitos (Department of Loreto; 3°45′19″S, 73°14′57″W), 29 from Awajun (Department of Amazonas; 4°34′59″S, 77°54 ′0″ W) and 8 from Tambopata (Department of Madre de Dios; 12°40'18.9" S 69°21.328' W) (Fig. 1). Only 8 individuals were sampled from Tambopata due to the familiarity that existed among its inhabitants, as well as its geographic isolation and difficulties in sampling. The inclusion criteria considered were: that there was no kinship between them, that they were men over 18 years of age and that they were born in the Peruvian jungle (with parents and grandparents from the jungle). Among the exclusion criteria taken into consideration were that they were immigrants from the coast or highlands of Peru, that they were related through the paternal line, with similar surnames, and that they had received a blood transfusion or bone marrow transplant in the last 6 months. Before participating in the study, individuals freely and voluntarily signed their informed consent.
, Awajun, (n = 29; Amazonas, 4°34′59″S, 77°54′0″ W) and Tambopata (n = 8; Madre de Dios, 12°40′18.9″ S 69°21.328′ W).")
A 1.2 mm punch was extracted from each card and amplified by direct PCR using the Yfiler™ Plus PCR Amplification Kit (Life Technologies) following the manufacturer's instructions. The amplified products were analysed using capillary electrophoresis on the AppliedBiosystem™ 3500XL GeneticAnalyzer (Life Technologies) following the manufacturer's recommended protocol. After capillary electrophoresis, the data were imported into GeneMapper® ID-X v1.5 software to generate genetic profiles. The data were deposited in the database (accession number of the Awajun population: YA005891 and accession number of the Iquitos population: YA004763).
Statistical analysisFor the calculation of allele frequencies of the 27 Y-STRs, PowerStats V1.2 software was used on 23 STRs; for the markers DYS385a/b and DYF387S1 the "type" frequencies were calculated by the counting method. Genetic diversity (GD) and haplotype diversity (HD) were calculated with the following formulae GD = (n/n - 1) (1 - ΣPἰ2) and HD = (n/n - 1) (1 - ΣXἰ2), where Pἰ is the frequency of the ἰ allele, n is the number of samples analysed, Xἰ represents the calculated frequency of the ἰ haplotype.14 The probability of a random match (MP) was calculated as MP = ΣXἰ2 and the discriminating ability (DC) was obtained by dividing the number of different haplotypes observed and the total sum of the number of haplotypes identified. The haploid matching probability (HMP) was calculated with the formula HMP = 1 - HD. Analysis of molecular variance (AMOVA) was used to obtain pairwise genetic distance (Rst) values between Y-STR data sets. The Rst values were then used for multidimensional scaling analysis (MDS). Rst and p-values between different populations were estimated by analysis of molecular variance (AMOVA) and visualised in a multidimensional scaling (MDS) plot (accessed through YHRD).15
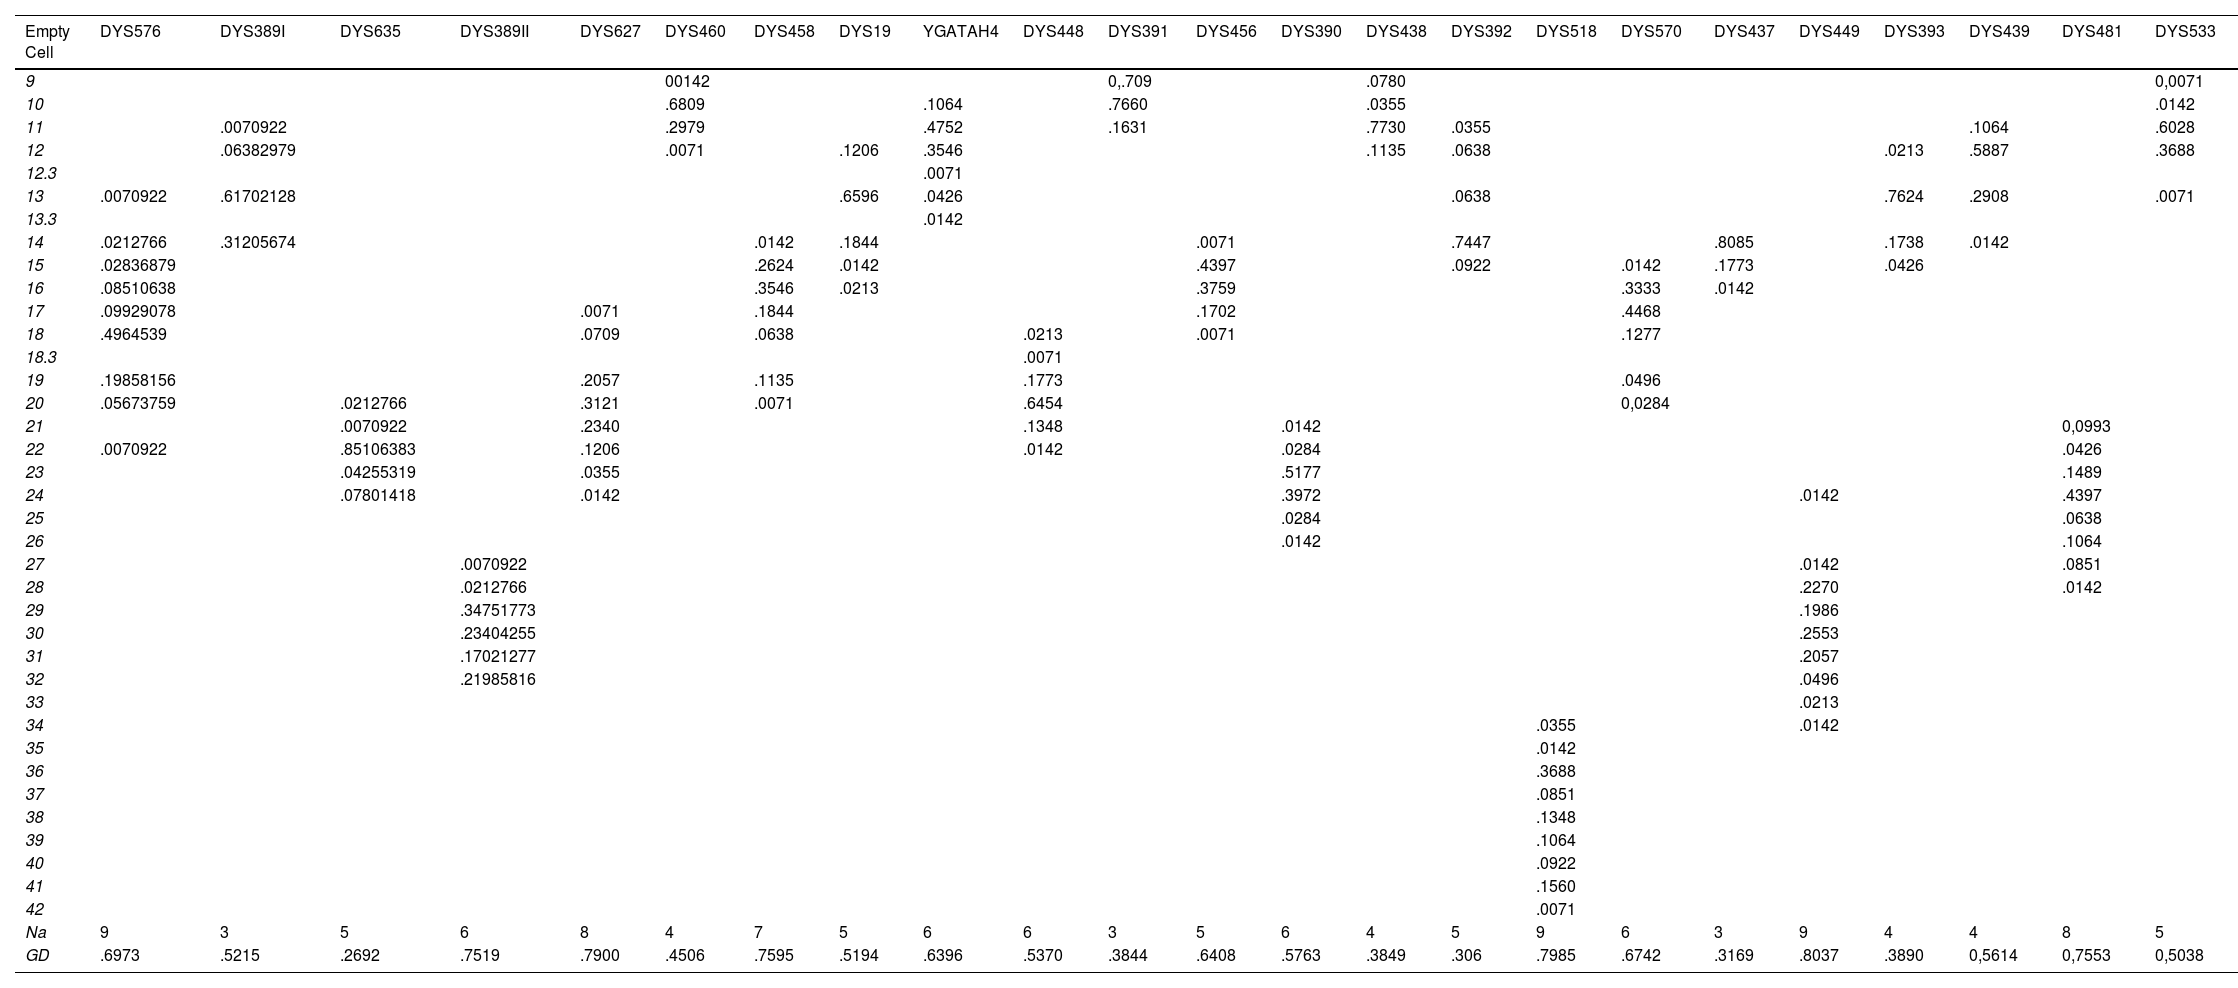
Results and discussionAllelic frequencies, genetic diversity and allelic variation for the jungle populationThis study analysed 141 samples of male individuals from the Peruvian jungle population. In all samples, all 27 Y-STRs provided typing results and no null alleles were observed. Allele frequencies (or types) for each locus in the combined dataset are shown in Table 1 and Table 2. The DYS391 and DYS437 markers had the lowest number of alleles (3 alleles), while the DYS385a/b marker had the highest number (25 types). GD values were between .3169 (DYS437) and .9192 (DYF387S1) and only 5 Y-STR loci had values below .5 (DYS437, DYS391, DYS438, DYS393 and DYS392). The 3 markers with the highest diversity, based on GD, were DYS449 (.8037), DYS385a/b (.8250) and DYF387S1 (.9192), while the lowest diversity was observed for marker DYS437 (.3169).
Allelic frequencies and genetic diversity of 23 Y-STR loci from the jungle population of Peru (n = 141).
| Empty Cell | DYS576 | DYS389I | DYS635 | DYS389II | DYS627 | DYS460 | DYS458 | DYS19 | YGATAH4 | DYS448 | DYS391 | DYS456 | DYS390 | DYS438 | DYS392 | DYS518 | DYS570 | DYS437 | DYS449 | DYS393 | DYS439 | DYS481 | DYS533 |
|---|---|---|---|---|---|---|---|---|---|---|---|---|---|---|---|---|---|---|---|---|---|---|---|
| 9 | 00142 | 0,.709 | .0780 | 0,0071 | |||||||||||||||||||
| 10 | .6809 | .1064 | .7660 | .0355 | .0142 | ||||||||||||||||||
| 11 | .0070922 | .2979 | .4752 | .1631 | .7730 | .0355 | .1064 | .6028 | |||||||||||||||
| 12 | .06382979 | .0071 | .1206 | .3546 | .1135 | .0638 | .0213 | .5887 | .3688 | ||||||||||||||
| 12.3 | .0071 | ||||||||||||||||||||||
| 13 | .0070922 | .61702128 | .6596 | .0426 | .0638 | .7624 | .2908 | .0071 | |||||||||||||||
| 13.3 | .0142 | ||||||||||||||||||||||
| 14 | .0212766 | .31205674 | .0142 | .1844 | .0071 | .7447 | .8085 | .1738 | .0142 | ||||||||||||||
| 15 | .02836879 | .2624 | .0142 | .4397 | .0922 | .0142 | .1773 | .0426 | |||||||||||||||
| 16 | .08510638 | .3546 | .0213 | .3759 | .3333 | .0142 | |||||||||||||||||
| 17 | .09929078 | .0071 | .1844 | .1702 | .4468 | ||||||||||||||||||
| 18 | .4964539 | .0709 | .0638 | .0213 | .0071 | .1277 | |||||||||||||||||
| 18.3 | .0071 | ||||||||||||||||||||||
| 19 | .19858156 | .2057 | .1135 | .1773 | .0496 | ||||||||||||||||||
| 20 | .05673759 | .0212766 | .3121 | .0071 | .6454 | 0,0284 | |||||||||||||||||
| 21 | .0070922 | .2340 | .1348 | .0142 | 0,0993 | ||||||||||||||||||
| 22 | .0070922 | .85106383 | .1206 | .0142 | .0284 | .0426 | |||||||||||||||||
| 23 | .04255319 | .0355 | .5177 | .1489 | |||||||||||||||||||
| 24 | .07801418 | .0142 | .3972 | .0142 | .4397 | ||||||||||||||||||
| 25 | .0284 | .0638 | |||||||||||||||||||||
| 26 | .0142 | .1064 | |||||||||||||||||||||
| 27 | .0070922 | .0142 | .0851 | ||||||||||||||||||||
| 28 | .0212766 | .2270 | .0142 | ||||||||||||||||||||
| 29 | .34751773 | .1986 | |||||||||||||||||||||
| 30 | .23404255 | .2553 | |||||||||||||||||||||
| 31 | .17021277 | .2057 | |||||||||||||||||||||
| 32 | .21985816 | .0496 | |||||||||||||||||||||
| 33 | .0213 | ||||||||||||||||||||||
| 34 | .0355 | .0142 | |||||||||||||||||||||
| 35 | .0142 | ||||||||||||||||||||||
| 36 | .3688 | ||||||||||||||||||||||
| 37 | .0851 | ||||||||||||||||||||||
| 38 | .1348 | ||||||||||||||||||||||
| 39 | .1064 | ||||||||||||||||||||||
| 40 | .0922 | ||||||||||||||||||||||
| 41 | .1560 | ||||||||||||||||||||||
| 42 | .0071 | ||||||||||||||||||||||
| Na | 9 | 3 | 5 | 6 | 8 | 4 | 7 | 5 | 6 | 6 | 3 | 5 | 6 | 4 | 5 | 9 | 6 | 3 | 9 | 4 | 4 | 8 | 5 |
| GD | .6973 | .5215 | .2692 | .7519 | .7900 | .4506 | .7595 | .5194 | .6396 | .5370 | .3844 | .6408 | .5763 | .3849 | .306 | .7985 | .6742 | .3169 | .8037 | .3890 | 0,5614 | 0,7553 | 0,5038 |
Na: number of alleles¸ GD: genetic diversity.
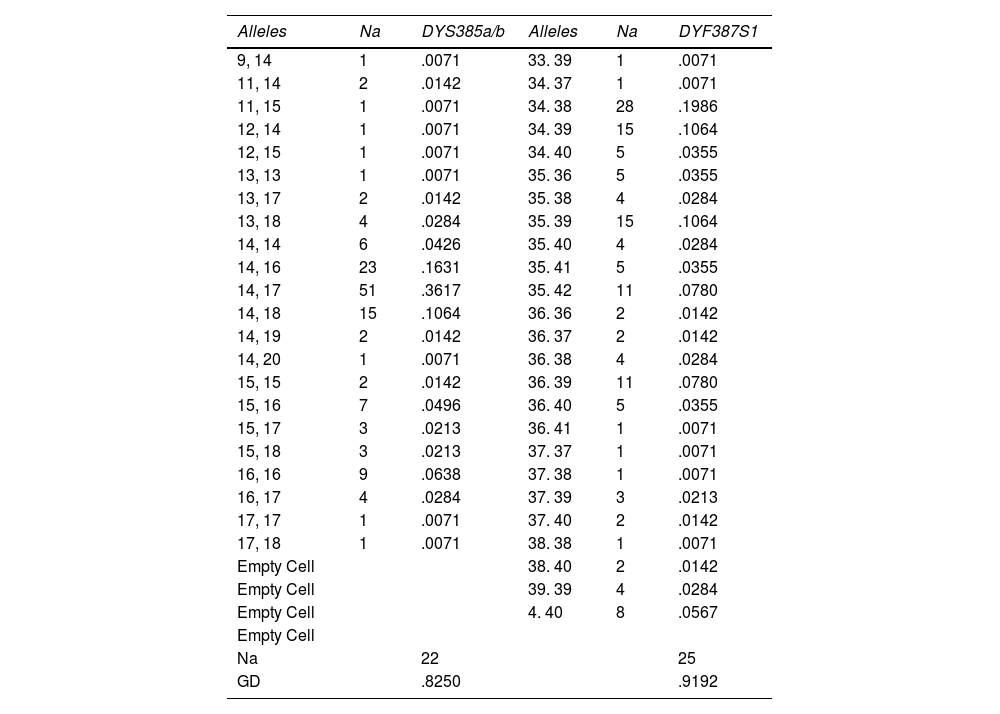
Allelic frequencies and genetic diversity of 4 Y-STR loci from the jungle population of Peru (n = 141).
| Alleles | Na | DYS385a/b | Alleles | Na | DYF387S1 |
|---|---|---|---|---|---|
| 9, 14 | 1 | .0071 | 33. 39 | 1 | .0071 |
| 11, 14 | 2 | .0142 | 34. 37 | 1 | .0071 |
| 11, 15 | 1 | .0071 | 34. 38 | 28 | .1986 |
| 12, 14 | 1 | .0071 | 34. 39 | 15 | .1064 |
| 12, 15 | 1 | .0071 | 34. 40 | 5 | .0355 |
| 13, 13 | 1 | .0071 | 35. 36 | 5 | .0355 |
| 13, 17 | 2 | .0142 | 35. 38 | 4 | .0284 |
| 13, 18 | 4 | .0284 | 35. 39 | 15 | .1064 |
| 14, 14 | 6 | .0426 | 35. 40 | 4 | .0284 |
| 14, 16 | 23 | .1631 | 35. 41 | 5 | .0355 |
| 14, 17 | 51 | .3617 | 35. 42 | 11 | .0780 |
| 14, 18 | 15 | .1064 | 36. 36 | 2 | .0142 |
| 14, 19 | 2 | .0142 | 36. 37 | 2 | .0142 |
| 14, 20 | 1 | .0071 | 36. 38 | 4 | .0284 |
| 15, 15 | 2 | .0142 | 36. 39 | 11 | .0780 |
| 15, 16 | 7 | .0496 | 36. 40 | 5 | .0355 |
| 15, 17 | 3 | .0213 | 36. 41 | 1 | .0071 |
| 15, 18 | 3 | .0213 | 37. 37 | 1 | .0071 |
| 16, 16 | 9 | .0638 | 37. 38 | 1 | .0071 |
| 16, 17 | 4 | .0284 | 37. 39 | 3 | .0213 |
| 17, 17 | 1 | .0071 | 37. 40 | 2 | .0142 |
| 17, 18 | 1 | .0071 | 38. 38 | 1 | .0071 |
| Empty Cell | 38. 40 | 2 | .0142 | ||
| Empty Cell | 39. 39 | 4 | .0284 | ||
| Empty Cell | 4. 40 | 8 | .0567 | ||
| Empty Cell | |||||
| Na | 22 | 25 | |||
| GD | .8250 | .9192 |
Na: number of alleles; GD: genetic diversity.
A total of 104 samples of male individuals from the Iquitos population were analysed. Allele frequencies (or types) are shown in Table 1. The markers DYS391 and DYS437 had the lowest number of alleles (3 alleles), while the marker DYF387S1 has the highest number of types (24 types). GD values were between .231 (DYS635) and .938 (DYF387S1) and 7 Y-STR loci had values below .5 (DYS437, DYS391, DYS393, DYS392, DYS438, DYS533 and DYS460). The 2 markers with the highest diversity, based on GD, were DYS385a/b (.8738) and DYF387S1 (.9375), while the lowest diversity was observed for marker DYS635 (.2309).
Allele frequencies, genetic diversity and allelic variation for the Awajun populationA total of 104 samples of male individuals from the Iquitos population were analysed. Allele frequencies (or types) are shown in Table 1. The markers DYS391 and DYS437 had the lowest number of alleles (3 alleles), while the marker DYF387S1 has the highest number of types (24 types). GD values were between .231 (DYS635) and .938 (DYF387S1) and 7 Y-STR loci had values below .5 (DYS437, DYS391, DYS393, DYS392, DYS438, DYS533 and DYS460). The 2 markers with the highest diversity, based on GD, were DYS385a/b (.8738) and DYF387S1 (.9375), while the lowest diversity was observed for marker DYS635 (.2309).
Allelic frequencies, genetic diversity and allelic variation for the Awajun populationTwenty-nine samples of male individuals from the Awajun population were analysed. Allele frequencies are shown in Table 2. The markers DYS635, DYS448 and DYS437 had the lowest number of alleles (one allele), while the marker DYF387S1 had the highest number of types (6 types). GD values ranged from .000 (DYS635) to .7094 (DYS449) and 12 Y-STR loci had values below .5 (DYS635, DYS448, DYS437, DYS392, DYS391, DYS576, DYS438, DYS460, DYS389I, DYS394, etc.). The marker with the highest diversity, based on GD, was DYS449 (.7094), while the lowest diversity was observed in markers DYS635, DYS448 and DYS437 (.0000).
Haloptype diversityOf the total number of samples analysed (n = 141), 106 distinct haplotypes were identified with HD and CD values of .991 and .752, respectively (Table 3). In the Iquitos population (n = 104), 87 distinct haplotypes were observed with HD and CD values of .996 and .837, respectively. In the Awajun population (n = 29), 18 distinct haplotypes were observed with HD and CD values of .904 and .621, respectively. One haplotype was observed 12 times (9 times in Awajun and 3 times in Iquitos). Sample collection was designed to avoid obtaining closely related donors. In addition, autosomal STR data in these 12 individuals were evaluated to determine if any were closely related. There was no discernible association indicating that any were first-degree related (data not shown). These 12 individuals may be related through the paternal line and autosomal STR typing lacks the power to discriminate parent-child or sibling relationships. Alternatively, these individuals may indicate a founder effect and a population substructure to consider.
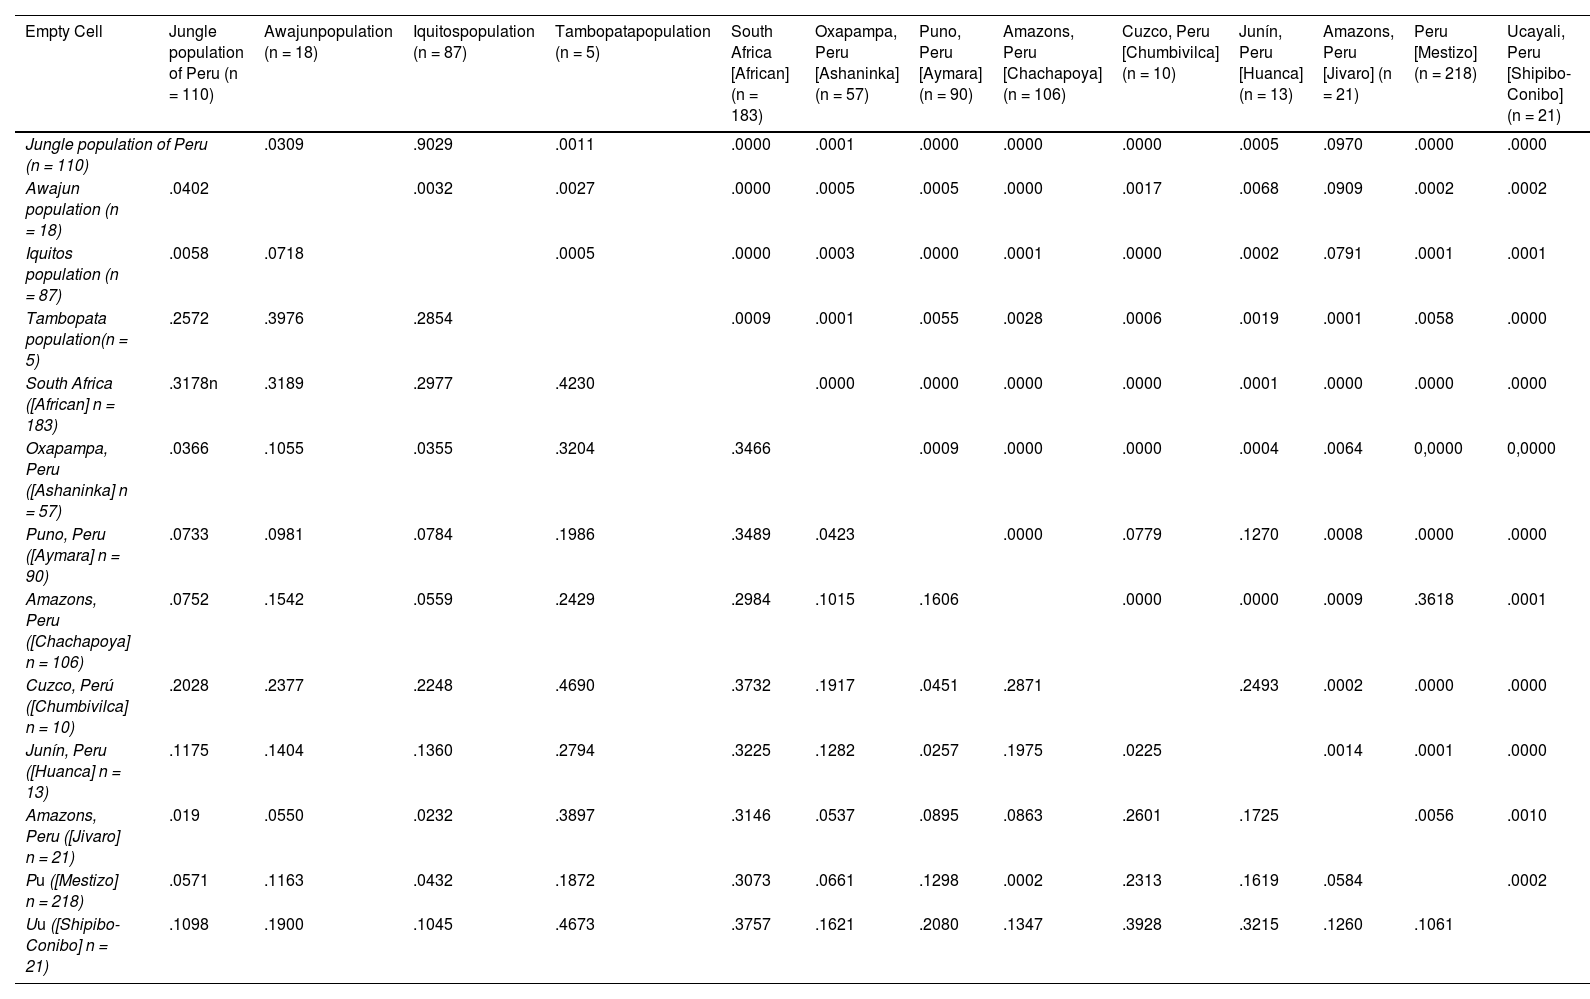
Pairwise genetic distance value estimates (below the diagonal) and corresponding p-value (above the diagonal) for the jungle population, Awajun population, Iquitos population and Tambopata population of Peru and 9 reference population data.
| Empty Cell | Jungle population of Peru (n = 110) | Awajunpopulation (n = 18) | Iquitospopulation (n = 87) | Tambopatapopulation (n = 5) | South Africa [African] (n = 183) | Oxapampa, Peru [Ashaninka](n = 57) | Puno, Peru [Aymara] (n = 90) | Amazons, Peru [Chachapoya] (n = 106) | Cuzco, Peru [Chumbivilca] (n = 10) | Junín, Peru [Huanca] (n = 13) | Amazons, Peru [Jivaro] (n = 21) | Peru [Mestizo] (n = 218) | Ucayali, Peru [Shipibo-Conibo] (n = 21) |
|---|---|---|---|---|---|---|---|---|---|---|---|---|---|
| Jungle population of Peru (n = 110) | .0309 | .9029 | .0011 | .0000 | .0001 | .0000 | .0000 | .0000 | .0005 | .0970 | .0000 | .0000 | |
| Awajun population (n = 18) | .0402 | .0032 | .0027 | .0000 | .0005 | .0005 | .0000 | .0017 | .0068 | .0909 | .0002 | .0002 | |
| Iquitos population (n = 87) | .0058 | .0718 | .0005 | .0000 | .0003 | .0000 | .0001 | .0000 | .0002 | .0791 | .0001 | .0001 | |
| Tambopata population(n = 5) | .2572 | .3976 | .2854 | .0009 | .0001 | .0055 | .0028 | .0006 | .0019 | .0001 | .0058 | .0000 | |
| South Africa ([African] n = 183) | .3178n | .3189 | .2977 | .4230 | .0000 | .0000 | .0000 | .0000 | .0001 | .0000 | .0000 | .0000 | |
| Oxapampa, Peru ([Ashaninka] n = 57) | .0366 | .1055 | .0355 | .3204 | .3466 | .0009 | .0000 | .0000 | .0004 | .0064 | 0,0000 | 0,0000 | |
| Puno, Peru ([Aymara] n = 90) | .0733 | .0981 | .0784 | .1986 | .3489 | .0423 | .0000 | .0779 | .1270 | .0008 | .0000 | .0000 | |
| Amazons, Peru ([Chachapoya] n = 106) | .0752 | .1542 | .0559 | .2429 | .2984 | .1015 | .1606 | .0000 | .0000 | .0009 | .3618 | .0001 | |
| Cuzco, Perú ([Chumbivilca] n = 10) | .2028 | .2377 | .2248 | .4690 | .3732 | .1917 | .0451 | .2871 | .2493 | .0002 | .0000 | .0000 | |
| Junín, Peru ([Huanca] n = 13) | .1175 | .1404 | .1360 | .2794 | .3225 | .1282 | .0257 | .1975 | .0225 | .0014 | .0001 | .0000 | |
| Amazons, Peru ([Jivaro] n = 21) | .019 | .0550 | .0232 | .3897 | .3146 | .0537 | .0895 | .0863 | .2601 | .1725 | .0056 | .0010 | |
| Pu ([Mestizo] n = 218) | .0571 | .1163 | .0432 | .1872 | .3073 | .0661 | .1298 | .0002 | .2313 | .1619 | .0584 | .0002 | |
| Uu ([Shipibo-Conibo] n = 21) | .1098 | .1900 | .1045 | .4673 | .3757 | .1621 | .2080 | .1347 | .3928 | .3215 | .1260 | .1061 | |
With Rst .01 no clusters were obtained.
With Rst .05 a cluster was obtained. Cluster 1: Cuzco, Peru (Chumbivilca); Puno, Peru (Aymara); Junín, Peru (Huanca).
Using an online tool (https://site.nevgen.org/nevgen-genealogy-tools-v1-1/), provisional haplogroups (main and most likely clade) were determined for the different haplotypes in the jungle. In the Peruvian jungle population, the majority (91.56%) belonged to haplogroup Q, with the remainder distributed among other haplogroups (.94% - E, G, J and C) and (3.55% R) (Table 3) In the Iquitos population, 9.8% of the haplotypes were assigned to haplogroup Q, 5.8% to haplogroup R and 1.2% were distributed among other haplogroups (E, G, J and C). In the Awajun population, 94.4% and 5.6% were assigned to haplogroup Q and E, respectively. In the Tambopata population sample, 100% of haplotypes were assigned to haplogroup Q (Table 3). These data are consistent with haplogroups of indigenous peoples in Latin America.
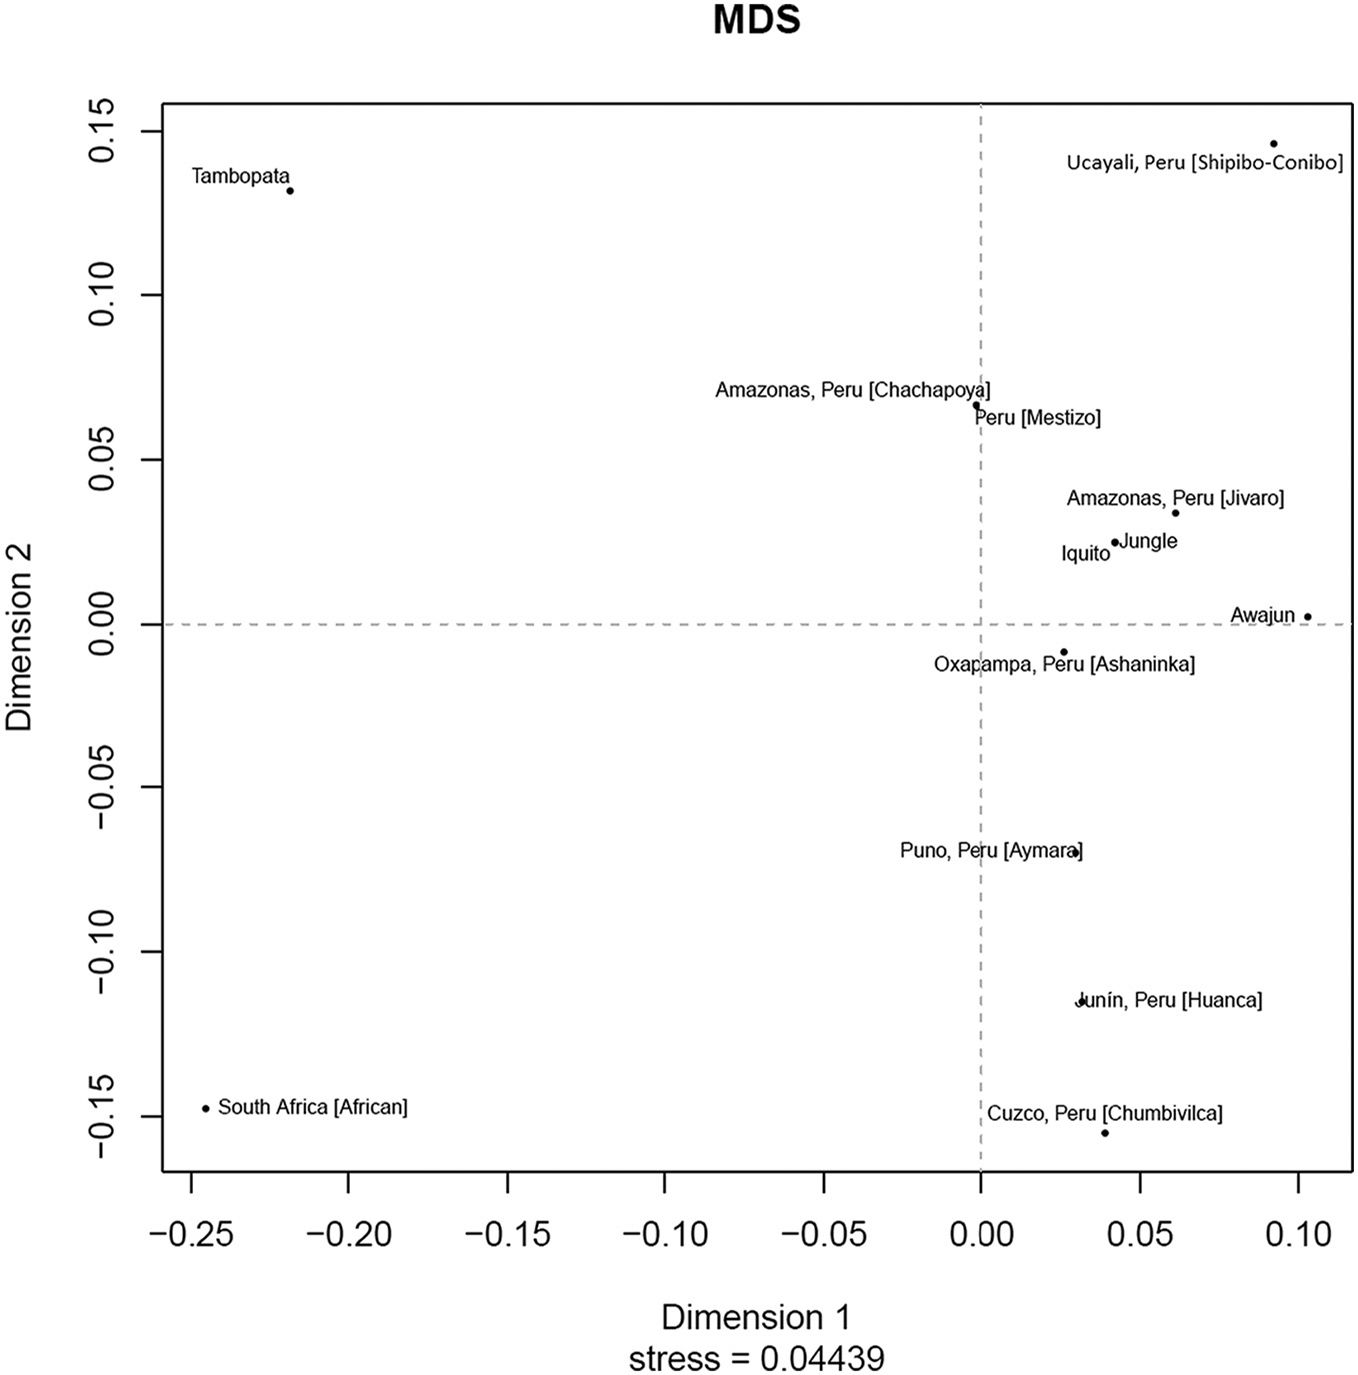
Genetic distancesRst values for genetic distances and the MDS plot for the Peruvian rainforest population or its separate samples (Iquitos, Awajun and Tambopata) and the African (South Africa),16 Ashaninca (Oxapamapa, Peru),11 Aymara (Puno, Peru),12,17 Chachapoya (Amazonas, Peru),13 Chumbivilca (Cuzco, Peru),17 Huancas (Junín, Peru),13 Jivaro (Amazonas, Peru),13 Mestizo (Peru),18,19 Shipibo-Conibo (Ucayali, Peru),17 were obtained from YHRD from 17 common Y-STR markers (DYSDYS456, DYS389I, DYS390, DYS389II, DYS458, DYS19, DYS385, DYS393, DYS391, DYS439, DYS635, DYS392, YGATAH4, DYS437, DYS438, DYS448) (Table 3 and Fig. 2) The African population (South Africa)16 was used as an outgroup.

The Rst values were used to generate an UPGMA tree using MEGA 6.0620 to show population differentiations based on these Y-STR haplogroups. The jungle population was closest to the Awajun and Jivaro (Amazon, Peru) population (Fig. 3). An Rst value ≤ .01 was used to identify which populations cluster closely but none was observed. Focusing on the jungle populations, the Awajun population was closer to the Jíbaro population (Amazonas, Peru) while the Iquitos population was closer to the Shipibo-Conibo population (Ucayali, Peru), the Chachapoya population (Amazonas, Peru) and the Mestizo population (Peru). These results suggest that there is a high genetic affinity between these populations. Additionally, the Tambopata population was distant from all the groups analysed (Fig. 3). The distance of the Tambopata population from the other populations analysed (Awajun and Iquitos) may be due in part to the geographical distance of approximately 1,000 km between the Iquitos and Tambopata populations and the approximately 1,200 km between the Awajun and Tambopata populations. However, with an Rst of ≤ .05, a cluster (cluster 1) was observed that did not include the jungle populations.
![Multidimensional scaling analysis (MDS) of the Peruvian jungle population (Jungle) (n = 141), Iquitos population (n = 104), Awajun population (n = 29), Tambopata population (n = 8) and 9 other reference populations. South Africa ([African] n = 183)a, Oxapampa, Peru ([Ashaninka] n = 57)b, Puno, Peru ([Aymara] n = 90)c, d, Amazonas, Peru ([Chachapoya] n = 106)e, Cuzco, Peru ([Chumbivilca] n = 10)f, Junín, Peru ([Huanca] n = 13)g, Amazonas, Peru ([Jivaro] n = 21)h, Peru ([Mestizo] n = 218)i, Ucayali, Peru ([Shipibo-Conibo] n = 21)j deposited in YHRD. Accession numbers: a: YA004588 b: YA005583 c: YA003824 d: YA004703 e: YA004108 f: YA003820 g: YA003822 h: YA005058 i: YP000325 j: YA003825.](https://static.elsevier.es/multimedia/24454249/0000004900000004/v1_202312051233/S2445424923000146/v1_202312051233/en/main.assets/gr3.jpeg?xkr=ue/ImdikoIMrsJoerZ+w997EogCnBdOOD93cPFbanNeZ37GK6oaKDi4Y3fykLw16yL7etfAu2mn8kUBQqeZQrLizXSUDjg8RxzbyyKV68Q/OJ4pPTbgeSDw+cypFcY9MT0h5k8GpRx4+HpudjlCpTMRBGOSE4fpxNjY/lt6dnu3kdu4GnrS3Ly+9/+4RrfbEG3TPCUPWO0RfqA6FpI8MLb0zffhCdiKzz9LndA4ooTa9Wzy+ZkuohbCfx5ngovUnSp1uyLC1IvMPKDrPD0UaWxN8Kl+r3Fe0Dkgmn9EO14UBR7vhsn2nIl3v9aPkRupW "Multidimensional scaling analysis (MDS) of the Peruvian jungle population (Jungle) (n = 141), Iquitos population (n = 104), Awajun population (n = 29), Tambopata population (n = 8) and 9 other reference populations. South Africa ([African] n = 183)a, Oxapampa, Peru ([Ashaninka] n = 57)b, Puno, Peru ([Aymara] n = 90)c, d, Amazonas, Peru ([Chachapoya] n = 106)e, Cuzco, Peru ([Chumbivilca] n = 10)f, Junín, Peru ([Huanca] n = 13)g, Amazonas, Peru ([Jivaro] n = 21)h, Peru ([Mestizo] n = 218)i, Ucayali, Peru ([Shipibo-Conibo] n = 21)j deposited in YHRD. Accession numbers: a: YA004588 b: YA005583 c: YA003824 d: YA004703 e: YA004108 f: YA003820 g: YA003822 h: YA005058 i: YP000325 j: YA003825.")
Multidimensional scaling analysis (MDS) of the Peruvian jungle population (Jungle) (n = 141), Iquitos population (n = 104), Awajun population (n = 29), Tambopata population (n = 8) and 9 other reference populations. South Africa ([African] n = 183)a, Oxapampa, Peru ([Ashaninka] n = 57)b, Puno, Peru ([Aymara] n = 90)c, d, Amazonas, Peru ([Chachapoya] n = 106)e, Cuzco, Peru ([Chumbivilca] n = 10)f, Junín, Peru ([Huanca] n = 13)g, Amazonas, Peru ([Jivaro] n = 21)h, Peru ([Mestizo] n = 218)i, Ucayali, Peru ([Shipibo-Conibo] n = 21)j deposited in YHRD.
Accession numbers:
a: YA004588
b: YA005583
c: YA003824
d: YA004703
e: YA004108
f: YA003820
g: YA003822
h: YA005058
i: YP000325
j: YA003825.
Genetic data are scarce for the populations analysed. Guevara et al.13 studied populations in the Peruvian jungle and detected haplogroup Q in only 60% of the Chachapoyas population (n = 68), while in the Jíbaro (n = 23) and Huancas (n = 10) populations it was present in 96 and 92%, respectively,14 and in the Ashanincas (Oxapampa, n = 58) haplogroup Q was present in more than 99%15 In the present study, haplogroup Q was observed in 91.56% of the population, similar to that of the Jivaro, Huancas and Ashaninca populations. This may be due to a common ancestry or the sampling strategy employed, as well as the inclusion criteria.
The 27 Y-STR loci were typed in 141 unrelated male individuals from the Peruvian jungle, providing a more consistent dataset for this population group. The data obtained have been deposited in the YHRD database (Awajun population accession number: YA005891 and Iquitos population accession number: YA004763) with the exception of the Tambopata population sample due to the number of samples collected (n = 8). These data are more extensive than other data available for the Peruvian jungle population. For example, YRHD (Yhrd.org) contains only 5 haplotypes (with the AmpFlSTRYfiler™ PCR Amplification kit, AppliedBiosystems™) for Iquitos (Loreto, Peru) (archived under accession number YA003823) and no haplotypes for the Awajun and Tambopata populations. Other published studies on Y chromosome data from Peru have a smaller sample size, such as the Aymara (n = 90),12 Aguaruna (n = 30),21 as well as other South American populations, including the Ticuna of Peru, Brazil (n = 23) and Surui of Brazil (n = 24).22 The analyses performed in this research show that the Y-STR haplotypes studied showed high polymorphism in the population analysed and, therefore, are useful in forensic studies for the identification of population groups by paternal lineage, as well as in population genetics when investigating groups or individuals from Latin America.
Ethical responsibilitiesThe study was approved by the Ethics Committee of the Institute of Tropical Medicine "Daniel Alcides Carrión" of the National University of San Marcos (Certificate of Approval CIEI-2018-015).
FundingProject financed with resources transferred by the Ministry of Education (MINEDU), year 2021 through the programme Research and Innovation Projects for the Strengthening of the Research Lines of the Research Groups of the UNMSM - National Policy of Productive Higher Technical Education (PNESTP-MINEDU).
Supplementary material
Please cite this article as: Neyra-Rivera CD, Robles Mamani CS, Delgado Ramos E, et al. Análisis de 27 marcadores STR del cromosoma Y en poblaciones de la selva del Perú. Revista Española de Medicina Legal. 2023. https://doi.org/10.1016/j.reml.2022.10.001