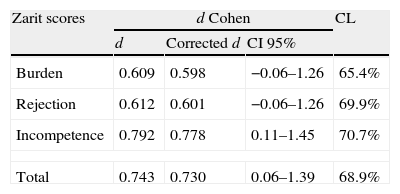
Caqueo-Urízar et al.1 recently presented their finding on the experience of burden in 2 culturally different groups (Aymara vs non-Aymara), evaluated using an effective instrument for the assessment of this psychological experience.2 Their results indicated differences between the groups compared that coincided with the literature with respect to the influence of the experience of burden on groups less influenced by Occidental culture having a poor educational level. However, their analysis emphasised only statistical methods that contrasted the null hypothesis of equality of means, concluding that some aspects of burden were valued as statistically significant. What they did not take into account was the magnitude of differences3 for the interpretation of their quantitative results. Fortunately, Caqueo-Urízar et al. reported the statistics needed to obtain the magnitude of difference estimations directly (mean and standard deviation for each group). Using this information, we have prepared Table 1, showing 2 indicators of magnitude of differences: the standardised d (Cohen, 1988), together with the corresponding intervals of confidence and the small sample size bias correction,3 and the Common Language (CL) effect size statistic,3 which indicates the degree of overlap between two distributions. The necessary assumption for interpreting these indicators appropriately is that the scores present a normal distribution.
Estimation of the magnitude of effect for the Caqueo-Urízar et al. study.
| Zarit scores | d Cohen | CL | ||
| d | Corrected d | CI 95% | ||
| Burden | 0.609 | 0.598 | −0.06–1.26 | 65.4% |
| Rejection | 0.612 | 0.601 | −0.06–1.26 | 69.9% |
| Incompetence | 0.792 | 0.778 | 0.11–1.45 | 70.7% |
| Total | 0.743 | 0.730 | 0.06–1.39 | 68.9% |
CL: Common Language estimator.
From this perspective, interpretations can be observed that are not directly suggested by the hypothesis test statistics used in the study. Firstly, even when differences that are not statistically significant (P>.05) are observed, all the standardised differences can be considered moderate according to the normal suggestions (≤.19: trivial; between .20 and .49: small; between .50 and .79: moderate, ≥.80: large3). Secondly, the variation of the differences is wide (using the interval of confidence); this suggests that standardised differences can be found between the groups ranging from d=0.0 or less (trivial effect) up to very large differences (around d=1.35), at least for the Burden and Rejection subscales. In the third place, in all of the scores, the estimated percentage of finding Aymara subjects experiencing greater burden in comparison with non-Aymara subjects varies from 65% (CL in the Burden score) to 70% (CL in the Incompetence score).
The differences that are not significant and the magnitude of the standardised differences are possibly in part a statistical artefact of the bias involved due to the small sample size used in the study,3 and this should balance the conclusions that Caqueo-Urízar et al. reached about the results that were not statistically significant.
Analysing the Caqueo-Urízar results from the estimations of the magnitude of differences highlights that the null hypothesis of equality of means constitutes insufficient quantitative information even when the results show no statistical significance.3 This method of obtaining the quantification of differences would lead to better understanding of the results when groups are compared.
Please cite this article as: Merino-Soto C, Angulo-Ramos M, Boluarte-Carbajal A. Diferencias de grupo en la sobrecarga: ¿cuánto es la diferencia? Rev Psiquiatr Salud Ment (Barc). 2014;7:97–98.


