To assess the patterns of use of 8 therapeutic drug groups for the treatment of diabetes mellitus and other cardiovascular risk factors, and to identify sociodemographic and health determinants of their use in the overall Spanish population.
MethodsA representative sample of the Spanish population within the Di@bet.es study, a cross-sectional population-based survey, was included. Study variables: sociodemographic, clinical, and lifestyle data; physical examination, and an oral glucose tolerance test in patients without known diabetes mellitus. Furthermore, patients were systematically queried about current medication use, and 8 pharmacotherapeutic groups were evaluated: lipid-lowering therapy, antihypertensives, oral hypoglycemic agents, insulin, thyroid hormone, uricosurics, psychoactive drugs, and nonsteroidal anti-inflammatory drugs.
ResultsSixty-six percent of the Spanish population was taking at least one medication. Therapeutic drug use was associated with age, independently of the higher prevalence of diabetes mellitus, hypertension, or hyperlipidemia in older patients. Sex disparities were found in the use of lipid-lowering agents, allopurinol, levothyroxine, nonsteroidal anti-inflammatory drugs, and psychoactive drugs. Use of psychoactive drugs was related to education level, work status, physical activity, smoking, and alcohol consumption. Almost 30% of patients with diabetes mellitus were taking 6 or more medications daily. Diabetes mellitus was associated with greater use of antihypertensives, lipid-lowering agents, and nonsteroidal anti-inflammatory drugs.
ConclusionsAge and sex are the most important factors determining therapeutic drug use. Lifestyle patterns and sociocultural factors have an impact only on psychoactive drug use. Diabetes mellitus is associated with greater use of antihypertensives, lipid-lowering agents, and nonsteroidal anti-inflammatory drugs.
Keywords
The prevalence of diabetes mellitus (DM) and other cardiovascular risk factors such as hypertension, dyslipidemia, and obesity is increasing1–3 and results in a considerable economic burden. Specifically, therapeutic drug use by diabetic patients for managing the disease and treating its related complications entails considerable expenditure.4–6
It is well recognized that the use of drugs is not exclusively determined by the various diseases for which they are prescribed; other factors also have an influence, such as age,7,8 sex,7 education level,8,9 employment status,8 and lifestyle.9 Most previous studies in this line have focused on a specific disease10–12 or specific age group,1–14 or have not taken into consideration other concomitant conditions.13,15 We have not encountered studies that comprehensively evaluate the use of drugs for DM and other cardiovascular risk factors, and that cover the entire population of Spain.
Thus, we present a study carried out in a representative sample of the Spanish population, in which demographic, clinical, and sociocultural data have been compiled with the following aims:
- •
To evaluate the use of 8 therapeutic drug groups related with treatment of DM and other cardiovascular risk factors in the overall Spanish population.
- •
To identify sociodemographic and health determinants that affect the use of these drugs.
- •
To compare the use of these drugs by individuals with DM, with other carbohydrate metabolism abnormalities, and without these conditions.
The Di@bet.es study is a cross-sectional population survey carried out in Spain from 2009 to 2010 and including adult patients older than 18 years. The sample size calculation was based on a 15% prevalence of DM and a sampling error of 1%. One hundred clusters were randomly selected from the total of health centers or their equivalents in all parts of Spain (the design effect was 1.5, as it was considered that the clusters would be heterogeneous with respect to the study variables). The final sample size allowed for a participation rate of 55% (data from similar studies) and included an additional 30% to compensate for losses in a future study on incidence. Of the 10 227 adult candidate participants, 5728 (56%) came to the study visit. Of these, 9.9% were excluded by protocol (institutionalization, severe disease, pregnancy, or recent delivery). Thus, 5544 patients were ultimately included in the study.2
The study was approved by the Ethics and Clinical Research Committee of Hospital Carlos Haya, and by other pertinent regional ethics and clinical research committees of Spain. All participants signed an informed consent before beginning the study.
Variables and ProceduresParticipants were invited by letter or phone contact to attend a study visit in their respective health centers. Information was collected by an interviewer using a structured questionnaire with items related to sociodemographic data, clinical variables (current diagnoses and history of hypertension, cardiovascular disease, stroke, and peripheral artery disease), and lifestyle (smoking, alcohol consumption, and level of daily physical activity). In addition, participants were queried about the therapeutic drugs they were taking, which were recorded according to their trade name or active principle. A single investigator (physician) reviewed all the answers. We analyzed the following groups of drugs because they are related to the treatment of DM and other cardiovascular risk factors: lipid-lowering drugs (statins, fibrates, anion exchange resins, and omega-3 fatty acids), antihypertensive agents (angiotensin converting enzyme inhibitors [ACEI], angiotensin receptor blockers, direct renin inhibitors, beta blockers, alpha blockers, calcium channel blockers, and diuretics), oral antidiabetic (OAD) agents (biguanides, sulfonylureas, thiazolidinediones, mitiglinide, dipeptidyl peptidase IV inhibitors, and others), insulin, uricosurics (allopurinol), thyroid hormone (sodium levothyroxine), psychoactive drugs (hypnotics, anxiolytics, antidepressants, antipsychotics, and others), and nonsteroidal anti-inflammatory drugs (NSAIDs) (salicylates, propionic acid, acetic acid and enolic acid derivatives, cyclooxygenase 2 inhibitors, and others). For each therapeutic drug group, another category was created for use when the participant could not remember the name of the drug, but knew why it had been prescribed (“does not recall the medication”).
A previously trained nurse conducted a physical examination. Weight and height were measured following standardized methods. The body mass index (BMI) was calculated as weight (kg)/height2 (m). Two blood pressure measurements separated by 1 to 2min were obtained with the patient in a sitting position, using a blood pressure monitor (Hem-703C, Omron; Barcelona, Spain) according to the manufacturer's instructions; the mean of the 2 measurements was used in the analyses.
Fasting blood samples were drawn for all participants. Patients with fasting capillary blood glucose<140mg/dL and those who were not receiving DM treatment additionally underwent oral glucose tolerance testing. Samples were immediately centrifuged and stored at −18°C (maximum 15 days) until transfer to a centralized biobank, where they were stored at −80°C until analysis.
Definition of Cardiovascular Risk FactorsObesity was defined as a BMI≥30.
Hypertension was established when a patient was receiving antihypertensive medication or when systolic pressure was ≥140mmHg and/or diastolic pressure was ≥90mmHg.
Dyslipidemia was established when a patient was under treatment with lipid-lowering drugs or when plasma low-density lipoprotein cholesterol level was ≥100mg/dL or triglyceride level was ≥150mg/dL or high-density lipoprotein cholesterol level was ≤40mg/dL for men and ≤50mg/dL for women.
The diagnosis of DM and carbohydrate metabolism abnormalities was based on the results of plasma glucose measurement, according to the 1999 World Health Organization criteria.16 Carbohydrate metabolism changes included the following categories: impaired fasting glucose (IFG), impaired glucose tolerance (IGT), IFG+IGT, known DM, and unknown DM.
Statistical AnalysisContinuous variables are expressed as the mean (standard deviation) and categorical variables as percentages. Comparison of means with variables having 3 or more categories was performed using analysis of variance, and adjusted for potential confounding variables (age, sex, BMI, hypertension, and carbohydrate metabolism abnormalities). Associations between categorical variables and calculation of odds ratios (OR) with 95% confidence intervals (95%CI) were carried out using a logistic regression model, in which the dependent variables were use or no use of each therapeutic drug group and the covariates were: age, sex, BMI, hypertension, carbohydrate metabolism abnormalities, cardiovascular disease, stroke, and peripheral artery disease. P values <.05 were considered statistically significant.
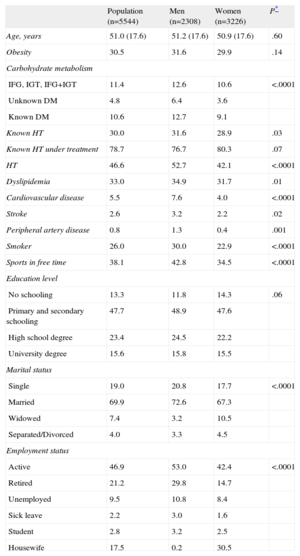
RESULTSThe sociodemographic and clinical characteristics of the study population are described in Table 1.
Clinical and Sociodemographic Characteristics of the Di@bet.es Study Population
| Population (n=5544) | Men (n=2308) | Women (n=3226) | P* | |
| Age, years | 51.0 (17.6) | 51.2 (17.6) | 50.9 (17.6) | .60 |
| Obesity | 30.5 | 31.6 | 29.9 | .14 |
| Carbohydrate metabolism | ||||
| IFG, IGT, IFG+IGT | 11.4 | 12.6 | 10.6 | <.0001 |
| Unknown DM | 4.8 | 6.4 | 3.6 | |
| Known DM | 10.6 | 12.7 | 9.1 | |
| Known HT | 30.0 | 31.6 | 28.9 | .03 |
| Known HT under treatment | 78.7 | 76.7 | 80.3 | .07 |
| HT | 46.6 | 52.7 | 42.1 | <.0001 |
| Dyslipidemia | 33.0 | 34.9 | 31.7 | .01 |
| Cardiovascular disease | 5.5 | 7.6 | 4.0 | <.0001 |
| Stroke | 2.6 | 3.2 | 2.2 | .02 |
| Peripheral artery disease | 0.8 | 1.3 | 0.4 | .001 |
| Smoker | 26.0 | 30.0 | 22.9 | <.0001 |
| Sports in free time | 38.1 | 42.8 | 34.5 | <.0001 |
| Education level | ||||
| No schooling | 13.3 | 11.8 | 14.3 | .06 |
| Primary and secondary schooling | 47.7 | 48.9 | 47.6 | |
| High school degree | 23.4 | 24.5 | 22.2 | |
| University degree | 15.6 | 15.8 | 15.5 | |
| Marital status | ||||
| Single | 19.0 | 20.8 | 17.7 | <.0001 |
| Married | 69.9 | 72.6 | 67.3 | |
| Widowed | 7.4 | 3.2 | 10.5 | |
| Separated/Divorced | 4.0 | 3.3 | 4.5 | |
| Employment status | ||||
| Active | 46.9 | 53.0 | 42.4 | <.0001 |
| Retired | 21.2 | 29.8 | 14.7 | |
| Unemployed | 9.5 | 10.8 | 8.4 | |
| Sick leave | 2.2 | 3.0 | 1.6 | |
| Student | 2.8 | 3.2 | 2.5 | |
| Housewife | 17.5 | 0.2 | 30.5 | |
DM, diabetes mellitus; HT, hypertension; IFG, impaired fasting glucose; IGT, impaired glucose tolerance.
Data are expressed as percentages or as the mean (standard deviation)
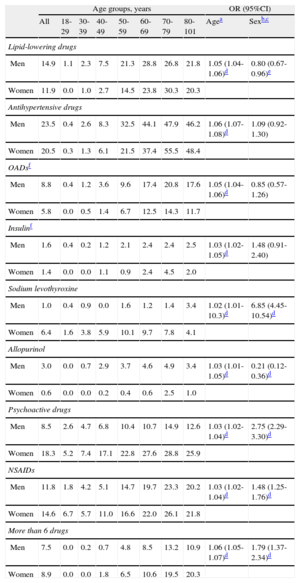
The prevalence of use of the therapeutic drug groups evaluated is shown in Table 2. The findings show that the use of any type of medication increases with age (adjusted by sex, BMI, obesity, hypertension, and carbohydrate metabolism abnormalities). Furthermore, the percentage of patients who take 6 or more drugs daily rises with increasing age. Men use lipid-lowering agents and allopurinol more frequently than women, whereas women more often take levothyroxine, psychoactive drugs, and NSAIDs.
Prevalence and Odds Ratios With 95% Confidence Intervals of Therapeutic Drug Use According to Age and Sex
| Age groups, years | OR (95%CI) | |||||||||
| All | 18-29 | 30-39 | 40-49 | 50-59 | 60-69 | 70-79 | 80-101 | Agea | Sexb,c | |
| Lipid-lowering drugs | ||||||||||
| Men | 14.9 | 1.1 | 2.3 | 7.5 | 21.3 | 28.8 | 26.8 | 21.8 | 1.05 (1.04-1.06)d | 0.80 (0.67-0.96)e |
| Women | 11.9 | 0.0 | 1.0 | 2.7 | 14.5 | 23.8 | 30.3 | 20.3 | ||
| Antihypertensive drugs | ||||||||||
| Men | 23.5 | 0.4 | 2.6 | 8.3 | 32.5 | 44.1 | 47.9 | 46.2 | 1.06 (1.07-1.08)d | 1.09 (0.92-1.30) |
| Women | 20.5 | 0.3 | 1.3 | 6.1 | 21.5 | 37.4 | 55.5 | 48.4 | ||
| OADsf | ||||||||||
| Men | 8.8 | 0.4 | 1.2 | 3.6 | 9.6 | 17.4 | 20.8 | 17.6 | 1.05 (1.04-1.06)d | 0.85 (0.57-1.26) |
| Women | 5.8 | 0.0 | 0.5 | 1.4 | 6.7 | 12.5 | 14.3 | 11.7 | ||
| Insulinf | ||||||||||
| Men | 1.6 | 0.4 | 0.2 | 1.2 | 2.1 | 2.4 | 2.4 | 2.5 | 1.03 (1.02-1.05)d | 1.48 (0.91-2.40) |
| Women | 1.4 | 0.0 | 0.0 | 1.1 | 0.9 | 2.4 | 4.5 | 2.0 | ||
| Sodium levothyroxine | ||||||||||
| Men | 1.0 | 0.4 | 0.9 | 0.0 | 1.6 | 1.2 | 1.4 | 3.4 | 1.02 (1.01-10.3)d | 6.85 (4.45-10.54)d |
| Women | 6.4 | 1.6 | 3.8 | 5.9 | 10.1 | 9.7 | 7.8 | 4.1 | ||
| Allopurinol | ||||||||||
| Men | 3.0 | 0.0 | 0.7 | 2.9 | 3.7 | 4.6 | 4.9 | 3.4 | 1.03 (1.01-1.05)d | 0.21 (0.12-0.36)d |
| Women | 0.6 | 0.0 | 0.0 | 0.2 | 0.4 | 0.6 | 2.5 | 1.0 | ||
| Psychoactive drugs | ||||||||||
| Men | 8.5 | 2.6 | 4.7 | 6.8 | 10.4 | 10.7 | 14.9 | 12.6 | 1.03 (1.02-1.04)d | 2.75 (2.29-3.30)d |
| Women | 18.3 | 5.2 | 7.4 | 17.1 | 22.8 | 27.6 | 28.8 | 25.9 | ||
| NSAIDs | ||||||||||
| Men | 11.8 | 1.8 | 4.2 | 5.1 | 14.7 | 19.7 | 23.3 | 20.2 | 1.03 (1.02-1.04)d | 1.48 (1.25-1.76)d |
| Women | 14.6 | 6.7 | 5.7 | 11.0 | 16.6 | 22.0 | 26.1 | 21.8 | ||
| More than 6 drugs | ||||||||||
| Men | 7.5 | 0.0 | 0.2 | 0.7 | 4.8 | 8.5 | 13.2 | 10.9 | 1.06 (1.05-1.07)d | 1.79 (1.37-2.34)d |
| Women | 8.9 | 0.0 | 0.0 | 1.8 | 6.5 | 10.6 | 19.5 | 20.3 | ||
95%CI, 95% confidence interval; NSAIDs, non-steroidal anti-inflammatory drugs; OADs, oral antidiabetics; OR, odds ratio
Data are expressed as percentages. In the logistic regression model, therapeutic drug use was categorized as 0=no, 1=yes.
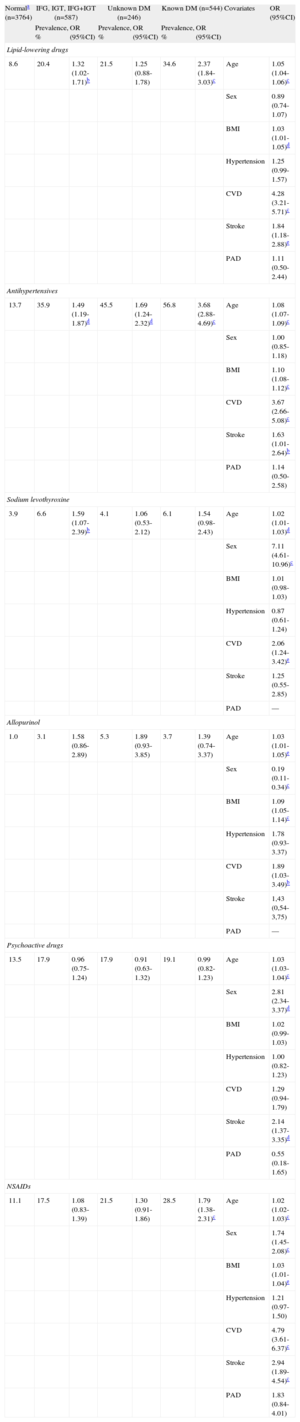
The risk of being under treatment with any lipid-lowering agent, antihypertensive drug, or NSAID was significantly higher in patients with known DM than in those with normal carbohydrate metabolism. In addition, the possibility of receiving treatment with antihypertensive drugs was higher in patients with other carbohydrate metabolism abnormalities than in healthy individuals. However, although the use of thyroid hormone, uricosurics, and psychoactive drugs was higher in patients with abnormal carbohydrate metabolism compared with healthy individuals, the differences were not statistically significant (Table 3).
Prevalence and Odds Ratios With 95% Confidence Intervals of Therapeutic Drug Use in Patients With and Without Carbohydrate Metabolism Abnormalities
| Normala (n=3764) | IFG, IGT, IFG+IGT (n=587) | Unknown DM (n=246) | Known DM (n=544) | Covariates | OR (95%CI) | |||
| Prevalence, % | OR (95%CI) | Prevalence, % | OR (95%CI) | Prevalence, % | OR (95%CI) | |||
| Lipid-lowering drugs | ||||||||
| 8.6 | 20.4 | 1.32 (1.02-1.71)b | 21.5 | 1.25 (0.88-1.78) | 34.6 | 2.37 (1.84-3.03)c | Age | 1.05 (1.04-1.06)c |
| Sex | 0.89 (0.74-1.07) | |||||||
| BMI | 1.03 (1.01-1.05)d | |||||||
| Hypertension | 1.25 (0.99-1.57) | |||||||
| CVD | 4.28 (3.21-5.71)c | |||||||
| Stroke | 1.84 (1.18-2.88)e | |||||||
| PAD | 1.11 (0.50-2.44) | |||||||
| Antihypertensives | ||||||||
| 13.7 | 35.9 | 1.49 (1.19-1.87)d | 45.5 | 1.69 (1.24-2.32)d | 56.8 | 3.68 (2.88-4.69)c | Age | 1.08 (1.07-1.09)c |
| Sex | 1.00 (0.85-1.18) | |||||||
| BMI | 1.10 (1.08-1.12)c | |||||||
| CVD | 3.67 (2.66-5.08)c | |||||||
| Stroke | 1.63 (1.01-2.64)b | |||||||
| PAD | 1.14 (0.50-2.58) | |||||||
| Sodium levothyroxine | ||||||||
| 3.9 | 6.6 | 1.59 (1.07-2.39)b | 4.1 | 1.06 (0.53-2.12) | 6.1 | 1.54 (0.98-2.43) | Age | 1.02 (1.01-1.03)d |
| Sex | 7.11 (4.61-10.96)c | |||||||
| BMI | 1.01 (0.98-1.03) | |||||||
| Hypertension | 0.87 (0.61-1.24) | |||||||
| CVD | 2.06 (1.24-3.42)e | |||||||
| Stroke | 1.25 (0.55-2.85) | |||||||
| PAD | — | |||||||
| Allopurinol | ||||||||
| 1.0 | 3.1 | 1.58 (0.86-2.89) | 5.3 | 1.89 (0.93-3.85) | 3.7 | 1.39 (0.74-3.37) | Age | 1.03 (1.01-1.05)e |
| Sex | 0.19 (0.11-0.34)c | |||||||
| BMI | 1.09 (1.05-1.14)c | |||||||
| Hypertension | 1.78 (0.93-3.37) | |||||||
| CVD | 1.89 (1.03-3.49)b | |||||||
| Stroke | 1,43 (0,54-3,75) | |||||||
| PAD | — | |||||||
| Psychoactive drugs | ||||||||
| 13.5 | 17.9 | 0.96 (0.75-1.24) | 17.9 | 0.91 (0.63-1.32) | 19.1 | 0.99 (0.82-1.23) | Age | 1.03 (1.03-1.04)c |
| Sex | 2.81 (2.34-3.37)d | |||||||
| BMI | 1.02 (0.99-1.03) | |||||||
| Hypertension | 1.00 (0.82-1.23) | |||||||
| CVD | 1.29 (0.94-1.79) | |||||||
| Stroke | 2.14 (1.37-3.35)d | |||||||
| PAD | 0.55 (0.18-1.65) | |||||||
| NSAIDs | ||||||||
| 11.1 | 17.5 | 1.08 (0.83-1.39) | 21.5 | 1.30 (0.91-1.86) | 28.5 | 1.79 (1.38-2.31)c | Age | 1.02 (1.02-1.03)c |
| Sex | 1.74 (1.45-2.08)c | |||||||
| BMI | 1.03 (1.01-1.04)e | |||||||
| Hypertension | 1.21 (0.97-1.50) | |||||||
| CVD | 4.79 (3.61-6.37)c | |||||||
| Stroke | 2.94 (1.89-4.54)c | |||||||
| PAD | 1.83 (0.84-4.01) | |||||||
95%CI, 95% confidence interval; BMI, body mass index; CVD, cardiovascular disease; DM, diabetes mellitus; IFG, impaired fasting glucose; IGT, impaired glucose tolerance; NSAIDs, nonsteroidal anti-inflammatory drugs; OR, odds ratio; PAD, peripheral artery disease.
In the logistic regression model, therapeutic drug use was categorized as 0=no; 1=yes.
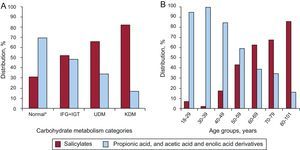
The use of lipid-lowering and antihypertensive agents did not differ between the various categories of carbohydrate metabolism abnormalities. This was not the case with NSAIDs: patients with known DM used salicylates (Fig. 1A) more commonly than other types of NSAIDs. Furthermore, the probability of being under treatment with salicylates was significantly greater in this group of individuals (OR=5.41; 95%CI, 2.89-8.97; P<.0001; adjusted by age, sex, and obesity). There were no differences in salicylate use versus other types of NSAIDs in individuals with IFG, IGT, or IFG+IGT (OR=1.50; 95%CI, 0.87-2.58; P=.08), or in patients with unknown DM (OR=1.70; 95%CI, 0.80-3.60; P=.12).
 and other nonsteroidal anti-inflammatory drugs according to age group and carbohydrate metabolism category. B: Use of salicylates (%) and other nonsteroidal anti-inflammatory drugs according to age group (years). IFG, impaired fasting glucose; IGT, impaired glucose tolerance; KDM, known diabetes mellitus; NSAID, nonsteroidal anti-inflammatory drugs; UDM, unknown diabetes mellitus. *No carbohydrate metabolism abnormalities.")
Use of salicylates and other nonsteroidal anti-inflammatory drugs according to age group and carbohydrate metabolism category. A: Use of salicylates (%) and other nonsteroidal anti-inflammatory drugs according to age group and carbohydrate metabolism category. B: Use of salicylates (%) and other nonsteroidal anti-inflammatory drugs according to age group (years). IFG, impaired fasting glucose; IGT, impaired glucose tolerance; KDM, known diabetes mellitus; NSAID, nonsteroidal anti-inflammatory drugs; UDM, unknown diabetes mellitus. *No carbohydrate metabolism abnormalities.
Two percent of the general population was receiving treatment with insulin and 7.1% with OADs. In patients with known DM, 14.9% were receiving insulin, 68.8% took OADs, and 8% combined treatment with OADs and insulin. The most commonly used OAD was metformin (72.0%), followed by sulfonylureas (14.2%) and mitiglinides. Seven percent of patients treated with OADs did not recall the name of the drug.
In patients with known DM, there were no significant differences in age, sex, obesity, or hypertension between those who were receiving OADs and those receiving insulin. Use of the different types of OADs did not differ according to age and sex.
Antihypertensive AgentsIn patients with hypertension, the most commonly used therapeutic agents were diuretics (17.4%), followed by angiotensin receptor blockers (15.1%), ACEI (14.2%), beta blockers (7.9%), calcium channel blockers (7.6%), alpha blockers (1.4%), and direct renin inhibitors (0.3%). Almost 6% of patients taking some type of antihypertensive drug could not recall the name of the medication.
Among all the subgroups of hypertensive agents, only diuretic use differed between men and women (21.2% of women and 13.3% of men; P<.0001).
In the total population taking antihypertensive drugs, 17% were receiving 2 or more of these agents, and this situation was more common in patients with known DM (OR=2.08; 95%CI, 1.58-2.75; P=.008), unknown DM (OR=1.66; 95%CI, 1.14-2.41; P<.0001), and in obese patients (OR=1.74; 95%CI, 1.39-2.78; P<.0001). Sex, education level, smoking, physical activity, and weight loss were not associated with the number of hypertensive agents used.
Antihypertensive medication use by patients who were aware of their diagnosis of hypertension increased with age in both men and women (adjusted for sex, BMI, and carbohydrate metabolism abnormalities, OR=1.07; 95%CI, 1.06-1.08; P<.0001). However, 35% of patients who were aware of the hypertension diagnosis were not taking any antihypertensive drugs. Education level, smoking, daily physical activity, and weight loss did not significantly differ between patients who used antihypertensive medication and those who did not (adjusted for age, sex, BMI, and carbohydrate metabolism abnormalities).
Antihypertensive Drug Use by Nonhypertensive PersonsAntihypertensive drug use by patients who were unaware of hypertension was 3.0% (n=116), with the following distribution: ACEI (n=29), angiotensin receptor blockers (n=24), beta blockers (n=36), calcium channel blockers (n=12), diuretics (n=46), and alpha blockers (n=4). The probability of a nonhypertensive person taking any type of antihypertensive medication was higher in patients with known DM (adjusted by age, sex, and albuminuria>30mg/dL; OR=4.38; 95%CI, 2.45-7.82; P<.0001). This greater use differed between the therapeutic subgroups. An association with ACEI occurred in cases of albuminuria>30mg/dL (adjusted by age, sex, and DM; OR=4.46; 95%CI, 1.10-18.04; P<.0001). For the remaining subgroups, there was either no significant association (beta blockers, calcium channel blockers, and alpha blockers) or the association was with known DM, whatever the level of microalbuminuria (angiotensin receptor blockers and diuretics).
Lipid-Lowering DrugsThe drugs most frequently used in patients with dyslipidemia were statins (82.4%), followed by fibrates (4.0%) and anionic exchange resins (1.3%). Combined statin and resin therapy accounted for 2.3% of lipid-lowering treatments, combined statins and fibrates for 0.7%, and statins plus omega-3 fatty acids, another 0.7%. In patients receiving lipid-lowering medication, 8.6% could not identify the drug they were taking.
Education level, smoking, daily physical activity, and weight loss did not significantly differ between persons who used lipid-lowering drugs and those who did not (adjusted for age, sex, BMI, and carbohydrate metabolism abnormalities).
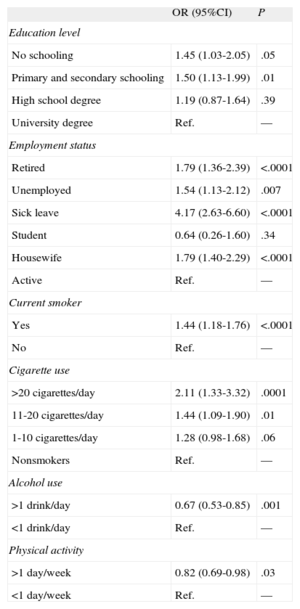
Psychoactive DrugsAnxiolytics (54.4%) were the most commonly used psychoactive drugs, followed by antidepressants (27.1%) and hypnotics (3.0%). Three percent of patients taking some type of psychoactive drug could not recall the name of the medication. As to the type of psychoactive drug, women used hypnotic agents more often than men (62.5% vs 37.5%; P<.0001), as well as anxiolytics (80.1% vs 19.9%; P<.0001) and antidepressants (79.8% vs 20.2%; P<.0001).
The use of psychoactive drugs by education level, employment status, physical activity, smoking, and alcohol consumption is depicted in Table 4.
Odds Ratios Adjusted by Age and Sex for Psychoactive Drug Use According to Education Level, Employment Status, Smoking, Alcohol Consumption, and Daily Physical Activity
| OR (95%CI) | P | |
| Education level | ||
| No schooling | 1.45 (1.03-2.05) | .05 |
| Primary and secondary schooling | 1.50 (1.13-1.99) | .01 |
| High school degree | 1.19 (0.87-1.64) | .39 |
| University degree | Ref. | — |
| Employment status | ||
| Retired | 1.79 (1.36-2.39) | <.0001 |
| Unemployed | 1.54 (1.13-2.12) | .007 |
| Sick leave | 4.17 (2.63-6.60) | <.0001 |
| Student | 0.64 (0.26-1.60) | .34 |
| Housewife | 1.79 (1.40-2.29) | <.0001 |
| Active | Ref. | — |
| Current smoker | ||
| Yes | 1.44 (1.18-1.76) | <.0001 |
| No | Ref. | — |
| Cigarette use | ||
| >20 cigarettes/day | 2.11 (1.33-3.32) | .0001 |
| 11-20 cigarettes/day | 1.44 (1.09-1.90) | .01 |
| 1-10 cigarettes/day | 1.28 (0.98-1.68) | .06 |
| Nonsmokers | Ref. | — |
| Alcohol use | ||
| >1 drink/day | 0.67 (0.53-0.85) | .001 |
| <1 drink/day | Ref. | — |
| Physical activity | ||
| >1 day/week | 0.82 (0.69-0.98) | .03 |
| <1 day/week | Ref. | — |
95%CI, 95% confidence interval; OR, odds ratio; Ref., reference criterion.
In the logistic regression model, therapeutic drug use was categorized as 0=no; 1=yes.
Propionic acid and derivatives of acetic acid and enolic acid (44.8%), salicylates (44.8%), and cyclooxygenase 2 inhibitors (2.7%) were the most commonly used NSAIDs. Among individuals taking these medications, 5% could not recall the name of the drug.
Women used propionic acid and derivatives of acetic acid and enolic acid (77.1% vs 22.9%; P<.0001) and cyclooxygenase 2 inhibitors (84.2% vs 15.5%; P<.0001) more frequently than men, and salicylates less frequently (44.0% vs 56.1%; P<.0001). Salicylate use increased with age, whereas use of other NSAIDs decreased (Fig. 1B).
Education level, smoking, daily physical activity, and weight loss did not significantly differ between patients who used NSAIDs and those who did not (adjusted for age, sex, BMI, and carbohydrate metabolism abnormalities).
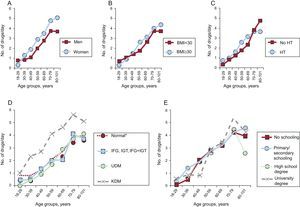
Number of Medications Taken and Concomitant Drug Use in the General PopulationAmong the total population, 66% were taking at least one of the therapeutic drugs studied, with a median of 2 drugs per day. In general, the number of drugs used daily increased with age (P<.0001), and was higher in women (P<.0001) (Fig. 2A), obese individuals (P=.005) (Fig. 2B), and patients with known DM (P<.0001) (Fig. 2D). In contrast, hypertension diagnosis (Fig. 2C), and education level (Fig. 2E) were not associated with use of a larger number of drugs.

Number of drugs used daily according to age groups, sex, body mass index, hypertension, carbohydrate metabolism categories, and education level. A: Number of drugs used daily according to age group and sex. B: Number of drugs used daily according to age group and body mass index. C: Number of drugs used daily according to age group and hypertension diagnosis. D: Number of drugs used daily according to age group and carbohydrate metabolism category. E: Number of drugs used daily according to age group and education level. BMI, body mass index; HT, hypertension; IFG, impaired fasting glucose; IGT, impaired glucose tolerance; KDM, known diabetes mellitus; UDM, unknown diabetes mellitus. *No carbohydrate metabolism abnormalities.
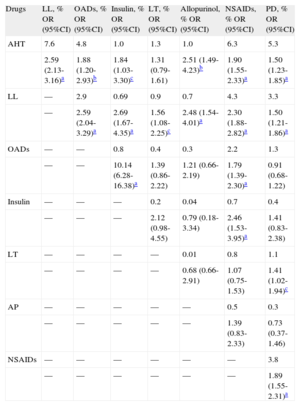
Concomitant use of the therapeutic drug groups studied is summarized in Table 5.
Prevalence, With Odds Ratios and 95% Confidence Intervals of the Concomitant Drug Use
| Drugs | LL, % OR (95%CI) | OADs, % OR (95%CI) | Insulin, % OR (95%CI) | LT, % OR (95%CI) | Allopurinol, % OR (95%CI) | NSAIDs, % OR (95%CI) | PD, % OR (95%CI) |
| AHT | 7.6 | 4.8 | 1.0 | 1.3 | 1.0 | 6.3 | 5.3 |
| 2.59 (2.13-3.16)a | 1.88 (1.20-2.93)b | 1.84 (1.03-3.30)c | 1.31 (0.79-1.61) | 2.51 (1.49-4.23)b | 1.90 (1.55-2.33)a | 1.50 (1.23-1.85)a | |
| LL | — | 2.9 | 0.69 | 0.9 | 0.7 | 4.3 | 3.3 |
| — | 2.59 (2.04-3.29)a | 2.69 (1.67-4.35)a | 1.56 (1.08-2.25)c | 2.48 (1.54-4.01)a | 2.30 (1.88-2.82)a | 1.50 (1.21-1.86)a | |
| OADs | — | — | 0.8 | 0.4 | 0.3 | 2.2 | 1.3 |
| — | — | 10.14 (6.28-16.38)a | 1.39 (0.86-2.22) | 1.21 (0.66-2.19) | 1.79 (1.39-2.30)a | 0.91 (0.68-1.22) | |
| Insulin | — | — | — | 0.2 | 0.04 | 0.7 | 0.4 |
| — | — | — | 2.12 (0.98-4.55) | 0.79 (0.18-3.34) | 2.46 (1.53-3.95)a | 1.41 (0.83-2.38) | |
| LT | — | — | — | — | 0.01 | 0.8 | 1.1 |
| — | — | — | — | 0.68 (0.66-2.91) | 1.07 (0.75-1.53) | 1.41 (1.02-1.94)c | |
| AP | — | — | — | — | — | 0.5 | 0.3 |
| — | — | — | — | — | 1.39 (0.83-2.33) | 0.73 (0.37-1.46) | |
| NSAIDs | — | — | — | — | — | — | 3.8 |
| — | — | — | — | — | — | 1.89 (1.55-2.31)a |
95% CI, 95% confidence interval; AHT, antihypertensives; AP, allopurinol; LL, lipid-lowering drugs; LT, sodium levothyroxine; NSAIDs, non-steroidal anti-inflammatory drugs; OADs, oral antidiabetics; OR, odds ratio; PD, psychoactive drugs.
In the regression model, therapeutic drug use was categorized as 0=no; 1=yes. Data were adjusted by age, sex, obesity, and diabetes mellitus.
To our knowledge, this is the first study describing the epidemiology of the use of certain drugs associated with the treatment of DM and other cardiovascular risk factors in the overall Spanish population. It shows that almost 70% of the population takes at least one of the drugs studied and that many of these drugs are taken concomitantly (eg, antihypertensive agents and statins).
It is known that women take more medications than men.8,10,11 The results of our study additionally show that women use a larger number of therapeutic drugs daily, regardless of age, BMI, carbohydrate metabolism abnormalities, or hypertension. It is interesting that this greater therapy use was not observed for all the drug groups studied, but only for thyroid hormone, psychoactive agents, and NSAIDs. In fact, women received treatment with lipid-lowering drugs and allopurinol less often than men. Similar results were reported by Roe et al.7 and Vimalananda et al.17 Nonetheless, although other authors have found that men use antihypertensive agents11,18 and OADs11 more often than women, we did not find sex-based differences in the use of antihypertensives, OADs, or insulin.
As in some previous studies,7,19 we observed that age was strongly associated with therapeutic drug use, even independently of the high prevalence of certain conditions such as hypertension, DM, and dyslipidemia in older persons. Thus, only 1.1% of the population aged 30 to 39 years used 6 or more drugs daily, versus 35.8% of persons 70 to 79 years of age (OR=25.39; 95%CI, 13.40-48.12; P<.05). A recent study carried out in Germany reported that 25% of the elderly population of that country was receiving 5 or more drugs daily.20 In our study, an increase in antihypertensive drug use with age was observed, regardless of whether the patients knew about the condition. Furthermore, younger patients were less likely to be taking antihypertensive medication even when they knew they had hypertension. A recent meta-analysis9 showed that age is related to treatment adherence, such that young and middle-aged patients less frequently took the drugs they were prescribed and adherence was better among older patients.
As this is a general population study in which 30.2% of participants were younger than 40 years, the prevalence of cardiovascular disease, stroke, and peripheral artery disease is low, although it is similar to the values reported in other studies.6 We found that the use of antihypertensives, lipid-lowering drugs, and NSAIDs is strongly associated with the presence of cardiovascular disease and stroke. Nonetheless, inclusion of these comorbidities in the risk models did not change the strength of the association between drug use and the remaining clinical and sociological variables studied.
The results of therapeutic drug use by individuals with known DM or other carbohydrate metabolism abnormalities are of special interest because few studies have addressed this issue. In general, patients with DM use a larger number of drugs, mainly antihypertensives, lipid-lowering drugs, and NSAIDs, than those with other carbohydrate metabolism abnormalities or healthy individuals. Almost 30% of patients with known DM take 6 or more drugs daily. This may be explained by the higher prevalence of hypertension and dyslipidemia in patients with known DM, although in the present study, the prevalence of these diseases was also high in patients with other carbohydrate metabolism abnormalities. In fact, the use of lipid-lowering drugs and NSAIDs did not significantly differ between patients without carbohydrate metabolism abnormalities and those with IFG, IGT, or IFG+IGT. This indicates more exhaustive screening and treatment for cardiovascular risk factors in patients with known DM, as recommended in international guidelines for the management of DM.21 In addition, persons with clinical DM without known hypertension were taking antihypertensive medication more frequently than the remainder of the population, mainly ACEI and in relation to albuminuria values>30mg/dL, a well-recognized indication for the prevention of diabetic nephropathy.21
We found notable differences in the use of the main NSAID groups. Salicylate use increased significantly with age and was more common in men, whereas younger individuals and women showed greater use of propionic acid and derivatives of acetic acid and enolic acid. The reason for these differences may reside in the fact that salicylates are included in international guidelines for DM management20 as antiplatelet agents; however, propionic acid and derivatives of acetic acid and enolic acid are mainly used as analgesics or anti-inflammatory agents.8
With regard to psychoactive drugs, we observed a higher use among women and according to increasing age, independently of obesity, DM, and hypertension. Furthermore, the use of psychotropic drugs was associated with sociodemographic factors and lifestyle, such as education level, employment status, daily physical activity, smoking, and alcohol consumption. It is worthy of note that use of the remaining drugs studied was independent of these sociodemographic and lifestyle factors. Lastly, although a higher prevalence of depression and other psychiatric disorders is reported in individuals with known DM22,23 and it is recommended to diagnose and adequately treat them,21 we did not find statistically significant differences in the use of psychoactive drugs between persons with known DM and the remaining population.
Strengths and LimitationsWith regard to the limitations of this study, we highlight its cross-sectional design, the fact that only 8 drug groups were analyzed, and the lack of information on dose, treatment duration, treatment adherence, and correct prescription; in addition, the information given by the participants was not confirmed with medical or pharmaceutical registries. Nonetheless, the results obtained in the evaluation of allopurinol and levothyroxine use, which showed a clear, known distribution by sex, are in keeping with the data from other studies,7 which could indicate that bias was not produced during the data collection and analysis.
The study also has some strengths. It is a population study with a representative sample of the Spanish population large enough to detect prevalence differences of around 10% (a value similar or superior to the prevalence of use of the majority of the drugs evaluated). Systematic analysis of the medication, together with the information collected about other diseases and lifestyle, can enable assessment of the determinants of therapeutic drug use in our population.
CONCLUSIONSAlmost 70% of the population takes one or more of the drugs studied. Age and sex are the most important factors that determine drug use in the Spanish population. Psychoactive drugs were the only drug group whose use was related with education level, employment status, and lifestyle. Patients with known DM used a larger number of medications, and not only insulin or OADs, but also antihypertensive agents, lipid-lowering drugs, and NSAIDs.
FUNDINGLifeScan Spain (Madrid) donated the glucose meters and blood glucose strips for the capillary blood glucose determinations. This study was funded by CIBER de Diabetes y Enfermedades Metabólicas Asociadas-CIBERDEM (Instituto de Salud Carlos III, Spanish Ministry of Science and Innovation), the Spanish Ministry of Health and Consumer Affairs, and the Spanish Ministry Diabetes Society.
CONFLICTS OF INTERESTNone declared.
The authors are grateful for the collaboration of the Spanish Diabetes Society, the Spanish Diabetes Federation, and the Spanish Ministry of Health and Consumer Affairs. Our deepest appreciation to the participating directors and staff of the health centers, to I. Alonso, A. Arocas, R. Badia, C.M. Bixquert, N. Brito, D. Chaves, A. Cobo, L. Esquius, I. Guillén, E. Mañas, A.M. Megido, N. Ojeda, R.M. Suárez, and M.D. Zomeño, without whose work this study would not have been possible, to David Fernández, Rosario Fernández, and M. José Tapia, and to all those who voluntarily participated in the study.