


The vicious circle model of obesity proposes that the hippocampus plays a crucial role in food reward processing and obesity. However, few studies focused on whether and how pediatric obesity influences the potential direction of information exchange between the hippocampus and key regions, as well as whether these alterations in neural interaction could predict future BMI and eating behaviors.
MethodsIn this longitudinal study, a total of 39 children with excess weight (overweight/obesity) and 51 children with normal weight, aged 8 to 12, underwent resting-state fMRI. One year later, we conducted follow-up assessments of eating behaviors and BMI. Resting-state functional connectivity and spectral dynamic casual modeling (spDCM) technique were used to examine altered functional and effective connectivity (EC) of the hippocampus in children with overweight/obesity. Linear support vector regression, a machine learning method, was employed to further investigate whether these sensitive hippocampal connections at baseline could predict future BMI and eating behaviors.
ResultsCompared to controls, children with excess weight displayed abnormal bidirectional inhibitory effects between the right hippocampus and left postcentral gyrus (PoCG), that is, stronger inhibitory hippocampus→PoCG EC but weaker inhibitory PoCG→hippocampus EC, which further predicted BMI and food approach behavior one year later.
ConclusionThese findings point to a particularly important role of abnormal information exchange between the hippocampus and somatosensory cortex in pediatric obesity and future food approach behavior, which provide novel insights into the neural hierarchical mechanisms underlying childhood obesity and further expand the spDCM model of adult obesity by identifying the directionality of abnormal influences between crucial circuits associated with appetitive regulation.
Overweight and obesity have high morbidity and mortality throughout the life course, which is closely linked to diabetes, cardiovascular diseases, and psychological disorders. It is becoming the greatest threat to public health in the 21st century (Lowe et al., 2020). As of 2022, more than one billion people globally are suffering from obesity, with children and adolescents accounting for 159 million (Phelps et al., 2024). Although the influence of obesity development is multifaced, food consumption beyond daily caloric needs is the main diver of excess weight in school-age children in obesogenic environments (Zhang et al., 2024), suggesting the critical role of eating behavior and related neural substrates in childhood obesity.
Hippocampus has been closely implicated in regulating human food intake and obesity (Kanoski & Grill, 2017; Stevenson & Francis, 2017; Tracy et al., 2001; Webber et al., 2009). Obesity and high-caloric diets have also been found to increase hippocampal neuroinflammation (Schmitt & Gaspar, 2023). The vicious circle model of obesity has proposed that Western diet (e.g., saturated fat and carbohydrate food) would contribute to obesity, in part, by damaging the appetite regulation function of the hippocampus which ultimately induces further over-consumption of unhealthy food, weight gain, and obesity (Davidson & Stevenson, 2022; Kanoski & Davidson, 2011). Crucially, the appetite processing of hippocampus needs to integrate external food sensory information and internal energy-relevant signals from somatosensory cortex (e.g., postcentral gyrus [PoCG], frontal operculum, insula, and hypothalamus) to evaluate when, what and how much to eat (Clasen et al., 2020; Eichenbaum, 2000; Kanoski & Grill, 2017; Quigley et al., 2021). Hippocampus and somatosensory cortex were activated simultaneously in response to visual, olfactory and taste food stimuli (for a review, see Huerta et al., 2014).
Accumulating evidence has also demonstrated that structural impairments and functional alterations in the hippocampus may be a neural vulnerability factor for excess weight and future food approach behaviors (e.g., food responsiveness and overeating). Cross-sectional and two-year follow-up studies have consistently found that children with obesity exhibited hippocampal atrophy (Bauer et al., 2015; Jiang et al., 2023; Mestre et al., 2017). Moreover, disrupted hippocampus activation in response to food stimuli has been shown to underlie childhood obesity (Bruce et al., 2010; Davids et al., 2010; Mestre et al., 2017; Samara et al., 2018). Such abnormal reactivity to food in the hippocampus was related to its changed resting-state activity (G. Li et al., 2021). Regarding resting-state functional synchrony, adults with obesity exhibited disrupted functional connectivity (FC) in the hippocampus and somatosensory cortex (PoCG and frontal operculum), which was linked with 12-month changes of eating behaviors and weight after bariatric surgery (Cerit et al., 2019; Geha et al., 2017; Lee et al., 2022). Notably, children with risk for obesity who exposed to gestational diabetes mellitus in utero displayed stronger FC between hippocampus and insula and striatum compare to unexposed children (Zhao et al., 2024). Birth weight of children with overweight/obesity has also been linked to the FC between hippocampus and PoCG (Solis‐Urra et al., 2023). Despite increasing knowledge on the aberrant neurobiology of hippocampus in individuals with obesity by using rs-fMRI data, the hippocampal functional circuits underlying pediatric obesity are not yet sufficiently defined (Syan et al., 2021).
At rest, the brain is traversed by spontaneous FC patterns (Barttfeld et al., 2015), and abnormal effective connectivity (EC) between brain regions may act as the basis for FC (Friston et al., 2014). Relative to Granger causal analyses, spectral DCM (spDCM) is a powerful tool for testing the directionality of information flow (bottom-up or top-down influences) between key regions and estimating the valence of connections (excitatory or inhibitory influences) (Razi et al., 2015). This novel approach for mapping neural hierarchical model has been widely applied to reveal directed links underlying emotion intelligence, disordered eating, and bipolar disorder (Bajaj & Killgore, 2021; Chen et al., 2023; Li et al., 2024; Zhang et al., 2022). However, this technique remains to be used in the identification of directional interaction patterns of childhood obesity. Only one study used the spDCM method to examine adults’ obesity-related changes in the direction and valence of connections between key areas, and revealed that excess weight was associated with persistent top-down excitation of the hypothalamus, regardless of homeostatic state, which were compatible with the eating in the absent hunger and impaired self-regulation views of obesity (Voigt et al., 2021). Because childhood obesity is a robust predictor of adult obesity (Lister et al., 2023), and because understanding the relationship between pediatric obesity and particular neural circuits may provide a foundation for developing more targeted and effective prevention strategies, it is of critical importance to determine whether and how obesity influences the potential information exchange between key regions involved in appetite regulation during such a critical developmental period.
By focusing on the directional architecture in the appetitive regulation circuitry through more advanced brain connectivity technique (i.e., spDCM), the current study sought to characterize the directionality of abnormal influences of one region on another in children with overweight/obesity, with the hippocampus as the region of interest (ROI). Based on previous findings of lower FC of hippocampus with somatosensory cortex and abnormal top-down EC from hippocampus to somatosensory cortex in adults with obesity (Sun et al., 2018), we hypothesized that children with excess weight might show lower functional synchrony between hippocampus and somatosensory cortex, as well as disrupted top-down information flow from the hippocampus to somatosensory cortex. According to the vicious circle model of obesity, we further hypothesized that abnormal hippocampal connections in children with obesity might be a prominent predictor for future eating behaviors and BMI. Finally, this study additionally investigated whether the spDCM model for adult obesity from Voigt et al. (2021) could be applied to the current sample of children (Voigt et al., 2021).
MethodParticipantsAll participants were recruited from two primary school in Chongqing (southwest of China) via posters and flyers. A total of 130 children (8–12 years old) participated in this study, each participant completed a series of self-reported measures and behavioral tasks, and underwent neuroimaging scanning in the first year. One year later, we conducted follow-up assessments of their behavioral measures and BMI. Participants met the following inclusion criteria, which were assessed via parental self-report: right-handed; no history of psychiatric or neurological illnesses; no use of psychoactive medications (binary variables indicating the presence or absence of particular disorders); and Chinese as the primary language. After quality control of structural neuroimaging data, a total of 21 participants were excluded due to excessive head motion, defined as a mean framewise displacement (FD) larger than 0.5 mm. Based on the BMI recorded in the first year, a total of 19 underweight participants were further excluded according to WHO growth reference (Onis et al., 2007). The final sample comprised 51 children with normal weight (i.e., NW group) and 39 children with overweight/obesity (i.e., excess weight group; EW group) (for details, see Table 1 and section 2.3.1). All participants and their parents signed an informed consent document prior to enrollment, and each subject received a set of stationery as a reward at the end of the study. The research protocol was reviewed and approved by the Ethics Committee of the Southwest University (IRB No H22003). All procedures in this study complied the 6th revision of the Declaratifon of Helsinki.
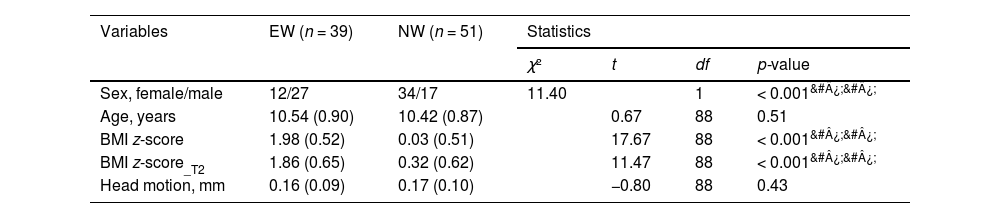
Demographic characteristics of the samples.
Notes: Variables are expressed as mean (standard deviation), or n/n, as appropriate. &#¿;&#¿;p < 0.001.
Abbreviation: EW = excess weight group; NW = normal weight group; BMI = body mass index; T2 = one year later.
Information regarding participants’ age, sex, height and weight was measured by trained researchers at Southwest University. BMI was calculated by dividing an individual's weight (kg) by the square of their height (m). According to the WHO growth reference, BMI percentiles were measured and adjusted for age and sex for each child. The WHO reference were used to classify children's BMI percentiles into normal weight (15th percentile to less than the 85th percentile), overweight (85th percentile to less than the 97th percentile), obesity (97th percentile or greater), and thinness (less than the 15th percentile) (Onis et al., 2007; World Health Organization, 2006). Nineteen children with thinness were excluded. Finally, 51 participants were selected in the NW group, and 39 (overweight, 18; obesity, 21) were selected in the EW group. Since BMI percentiles are non-linear, age- and sex-specific BMI z-scores were calculated for statistical analyses (Bhutani et al., 2021; Wang & Chen, 2012).
Behavioral task and self-report measurementsIn order to measure the scores of eating behaviors, all participants were completed the food choice task (Hare et al., 2009), Children's Eating Behaviour Questionnaire (CEBQ) (Wardle et al., 2001), Chinese version of Child Feeding Questionnaire (CFQ) (Zheng et al., 2016) and Eating Disorder Inventory-Child (EDI-C) (Eklund et al., 2005) (Supplementary material 1).
Neuroimaging data acquisition and preprocessingFor each participant, an 8 min resting-state fMRI and 5 min T1-weighted structural MRI scans were performed in a 3T Trio scanner (Siemens Medical, Erlangen, Germany). We used a gradient echo planar imaging sequence to obtain resting-state functional images. Scanning parameters were as follows: repetition time (TR) = 2000 ms, echo time (TE) = 30 ms, slices = 33, slice thickness = 3.5 mm, field of view (FOV) = 224 × 224 mm2, flip angle = 90°, resolution matrix = 64 × 64, voxel size = 3.5 × 3.5 × 3.5 mm3, phase encoding direction = PC >> AC. Each section contained 180 vol. High-resolution T1-weighted structural images were acquired for coregistration purposes. The magnetization prepared rapid acquisition gradient echo sequence employed the following parameters: TR = 2530 ms, TE = 3.48 ms, FOV = 256 × 256 mm2, flip angle = 7°, base resolution = 256 × 256, voxel size = 1 × 1 × 1 mm3, phase encoding direction = AC >> PC. Prior to the brain scanning, each participant underwent a 5-min simulated scanning training to adapt the real scanning environment. During formal scanning, participants were instructed to remain still and relaxed, keep their eyes closed, and avoid thinking of anything deliberately. Foam pads and earplugs were employed to reduce head motion and scanning noise.
The publicly available Data Processing Assistant for Resting-State fMRI (DPARSF) toolbox (http://www.restfmri.net) was used to preprocess neuroimaging data. Preprocessing was conducted as follows: the first 10 time points were removed to minimize the instability of initial scanning. The remaining 170 vol were slice timing-corrected, realigned. Functional volumes were then spatially normalized to the Montreal Neurological Institute (MNI) 152-brain template with a resolution voxel size of 3 × 3 × 3 mm3 by Diffeomorphic Anatomical Registration through Exponentiated Lie Algebra (DARTEL). All functional images were smoothed using a Gaussian kernel of 6 mm full width at half-maximum and further denoised by regressing out several nuisance signals, including the Friston-24 head motion parameters and signals from white matter and cerebrospinal fluid, before temporal band-pass filtering (0.01–0.08 Hz). This study adopted a widely used criterion of head motion to exclude participants if the mean FD was larger than 0.5 mm (Ekhtiari et al., 2019; Hodgson et al., 2017). After preprocessing, a total of 21 participants were deleted due to the head movements (i.e., mean FD values) greater than 0.50 mm (Jenkinson et al., 2002; Yan et al., 2013).
Seed-based functional connectivityThe seed regions of bilateral hippocampus were derived from the Automated Anatomical Labelling Atlas 3 (AAL3) (https://www.gin.cnrs.fr/en/tools/aal/) (Rolls et al., 2020). We generated spherical seeds with a radius of 5 mm by using more precise ROI barycentric coordinates (center of mass MNI coordinate: left hippocampus: x = –24.76, y = –22.46, z = –11.88; right hippocampus: x = 29.45, y = –21.49, z = –12.08). The mean BOLD signal time series from each ROI was extracted and correlated with the time series of all other voxels within the brain to create whole-brain Pearson's correlation coefficient maps. Fisher's r-to-z transformation was then applied in these maps to improve the normality of the correlation coefficients.
Effective connectivityBased on the FC results, we further calculated the EC and examined the group differences using the spDCM method. We briefly explain each step as follows. For a detailed description of the spDCM technique, refer to Razi et al. (2015) (Razi et al., 2015).
ROI time series extraction: Two nodes of FC results were considered as ROI in EC analysis. To extract ROI time series, a general linear model was built for preprocessed (slice timing, realigned, normalized, and smoothed) rs-fMRI data with six head-motion parameters, cerebrospinal fluid, and white matter as nuisance regressors. Low-frequency signal drifts were filtered using a 128-s high-pass filter. ROI times series were extracted by performing a principal components analysis to retain the first principal eigenvariate across a sphere of 8 mm radius centered on the peak coordinates, as in previous studies (Bajaj & Killgore, 2021; Preller et al., 2019).
First level analysis: Specification and estimation of DCM. The spDCM analyses were conducted using DCM12 implemented in the SPM12 (revision 7771, www.fil.ion.ucl.ac. uk/spm). We build a fully-connected DCM for significant FC at subject level, which assumed each node to be connected to all other nodes (22 connectivity parameters, including 2 intrinsic self-connections) and fits the complex cross spectral density using a power-law model of endogenous neuronal fluctuations. Then we estimated each participant's DCM with Bayesian model, finding the posterior density over parameters and offering the best trade-off between explaining the data and minimizing complexity of model. For details, see Friston et al. (2014) (Friston et al., 2014).
Second level analysis: Parametric empirical Bayes. Second-level analysis with the Parametric Empirical Bayes (PEB) framework examined the between-group differences in EC. The PEB framework specifies a hierarchical statistical model of connectivity parameters. We built a PEB model to partition the variability in connectivity parameters across subjects into hypothesized group-level effects and uninteresting between-subject variability. Two covariates were specified (overall group mean and between-group difference) in the design matrix. The parameters of the PEB model are estimated using the standard variational Laplace procedures at second-level. Then, Bayesian model averaging was performed on the second-level PEB model to investigate which the direction of connection best described the between-group differences. Under the PEB framework, parameters best describing between-group effects were reported not in terms of p value but instead in terms of posterior probability (PP). PP values > 0.95 were considered “strong evidence” for significant effects (Blain et al., 2023; Preller et al., 2019; Randeniya et al., 2023; Zeidman et al., 2019).
Longitudinal predictive analysisThe machine learning approach allows for the prediction of unseen participants, offering information at the individual level rather than group level (Cui et al., 2018; Shen et al., 2017; Yarkoni & Westfall, 2017). As in previous obesity studies (Augustijn et al., 2019; Moreno-Lopez et al., 2016), this study further examined whether these sensitive brain connections were effectively predictive of future health outcomes (e.g., eating behaviors and BMI) of children with high susceptibility to obesity (i.e., the EW group). A machine learning method named linear support vector regression (SVR) and leave-one-out cross-validation (LOOCV) procedure (Beaty et al., 2018; Supekar et al., 2013) was performed to test the predictive performance of the brain connectivity indices that differed in the two groups (baseline) on future individual-level behavioral variables (one year later), that is, eating behaviors and BMI z-score. Behavioral variables were taken as the dependent variables, and connectivity strength indices (e.g., the hippocampus→PoCG connection) were taken as independent variables in the linear regression algorithm. The predictive model of the EW group was trained on n − 1 participants’ neural indexes and eating behaviors, and subsequently tested on the left-out participant. After all the LOOCV folds were completed, we obtained the predicted scores of each participant. The predictive power of the model was assessed by the magnitude and statistical significance of Pearson's correlation between observed and predicted values. If the observed and predicted eating behavior scores were significantly positively related, this would suggest that the model was successful in its prediction. We randomly shuffled the label between observed eating behaviors scores and neural indexes each time and reran the above LOOCV prediction procedure. The 1000 Pearson's correlations between observed and predicted scores composed null distributions of r values. The number of null r values was greater than or equal to the r(observed, predicted) value and was then divided by 1000, providing an estimated pperm value.
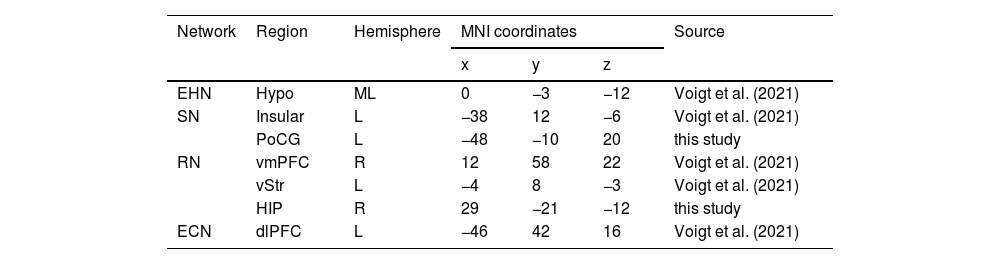
Extension of adult obesity spDCM modelTo extend the neural model of Voigt et al. (2021), a total of seven ROIs (see Table 2) from Voigt et al. and this study was included in a fully-connected model. The spDCM analysis followed the same procedures as described in Section 2.5. Given the larger number of ROI suitable for summarizing the connections from the network perspective, we computed the average within- and between-network EC strength, as in previous spDCM work (Chen et al., 2023; Zhou et al., 2018). Bayesian contrasts were further used to verify the difference in within- and between-network connections between groups by estimating whether the PP of the averaged connections from one network to another differed by 0. Similarly, a PP value greater than 0.95 indicates “strong evidence” for the existence of differences in within- and between-network connections between groups.
Regions of interest.
| Network | Region | Hemisphere | MNI coordinates | Source | ||
|---|---|---|---|---|---|---|
| x | y | z | ||||
| EHN | Hypo | ML | 0 | −3 | −12 | Voigt et al. (2021) |
| SN | Insular | L | −38 | 12 | −6 | Voigt et al. (2021) |
| PoCG | L | −48 | −10 | 20 | this study | |
| RN | vmPFC | R | 12 | 58 | 22 | Voigt et al. (2021) |
| vStr | L | −4 | 8 | −3 | Voigt et al. (2021) | |
| HIP | R | 29 | −21 | −12 | this study | |
| ECN | dlPFC | L | −46 | 42 | 16 | Voigt et al. (2021) |
Abbreviation: EHN = energy homeostatic network; SN = somatosensory network; RN = reward network; ECN = executive control network; Hypo = hypothalamus; vmPFC = ventromedial prefrontal cortex; vStr = ventral striatum; dlPFC = dorsolateral prefrontal cortex; HIP = hippocampus; PoCG = postcentral gyrus; L = left; R = right; ML = midline; MNI = Montreal Neurological Institute.
A χ2 test was conducted to test group differences in sex. A t-test was applied to test group differences in demographic characteristics. An analysis of covariance (ANCOVA) model was implemented to examine group differences in eating behaviors and food choice task, with age and sex as covariates.
In neuroimaging data analyses, the ANCOVA was used to examine the differences in hippocampus-based FC values based on their z-maps between groups, which was implemented in the CONN toolbox (https://web.conn-toolbox.org). The model used random field theory parametric analyses, with statistical significance set at a voxel height threshold of p < 0.001, and the false discovery rate (FDR)-corrected cluster-size threshold of p < 0.05. To assess the effects of possible confounding factors, we controlled for the effects of age, sex, and head motion. Based on the FC results, we further used the spDCM approach to examine the directionality of connections, with statistical significance set at PP values > 0.95 (see 2.6. Effective connectivity for more details).
We treated sex, age, and eating behaviors (baseline, e.g., food enjoyment) as control measures and regressed the effect of these confounding factors (baseline) on eating behavior scores (one year later, e.g., food enjoyment) to ensure that the remaining variance was specific to the corresponding variables one year later, as suggested by Daker et al. (2020). We used the resultant residualized eating behavior scores in the longitudinal analyses. To identify the neural vulnerability factors for future eating behaviors and BMI, this study used Pearson's correlation analysis to test the potential correlational patterns between brain connections (baseline) and eating behaviors (one year later). We employed a machine learning method named SVR and LOOCV procedure to further examine whether baseline brain connectivity indexes could predict individual-level eating behaviors one year later. Permutation test was used to assess the significance of the prediction models. Finally, hierarchy multiple regression modeling was carried out to validate the prediction results (see supplementary materials 2 and Table S2).
ResultsDemographic and behavioral resultsDemographic characteristics are presented in Table 1. No group differences were observed in age and head motion. Significant differences were observed in BMI z-score (t(88) = 17.67, p < 0.001) and sex (χ(1)2= 11.40, p < 0.001) between EW and NW groups. We further tested the group differences in different eating behaviors (i.e., the CEBQ sub-scales). We observed that the EW group showed lower scores in satiety responsiveness (F(1,86) = −4.70, p = 0.033), and slowness in eating (F(1,86) = −14.83, p < 0.001) sub-scales, relative to the NW group. See details in supplementary Table S1.
Group comparison of seed-based functional connectivityCompared to the NW group, the EW group exhibited lower connectivity strength between the right hippocampus and left PoCG (t = −4.80, cluster size = 219, MNI coordinates: x = −48, y = −10, z = 20).
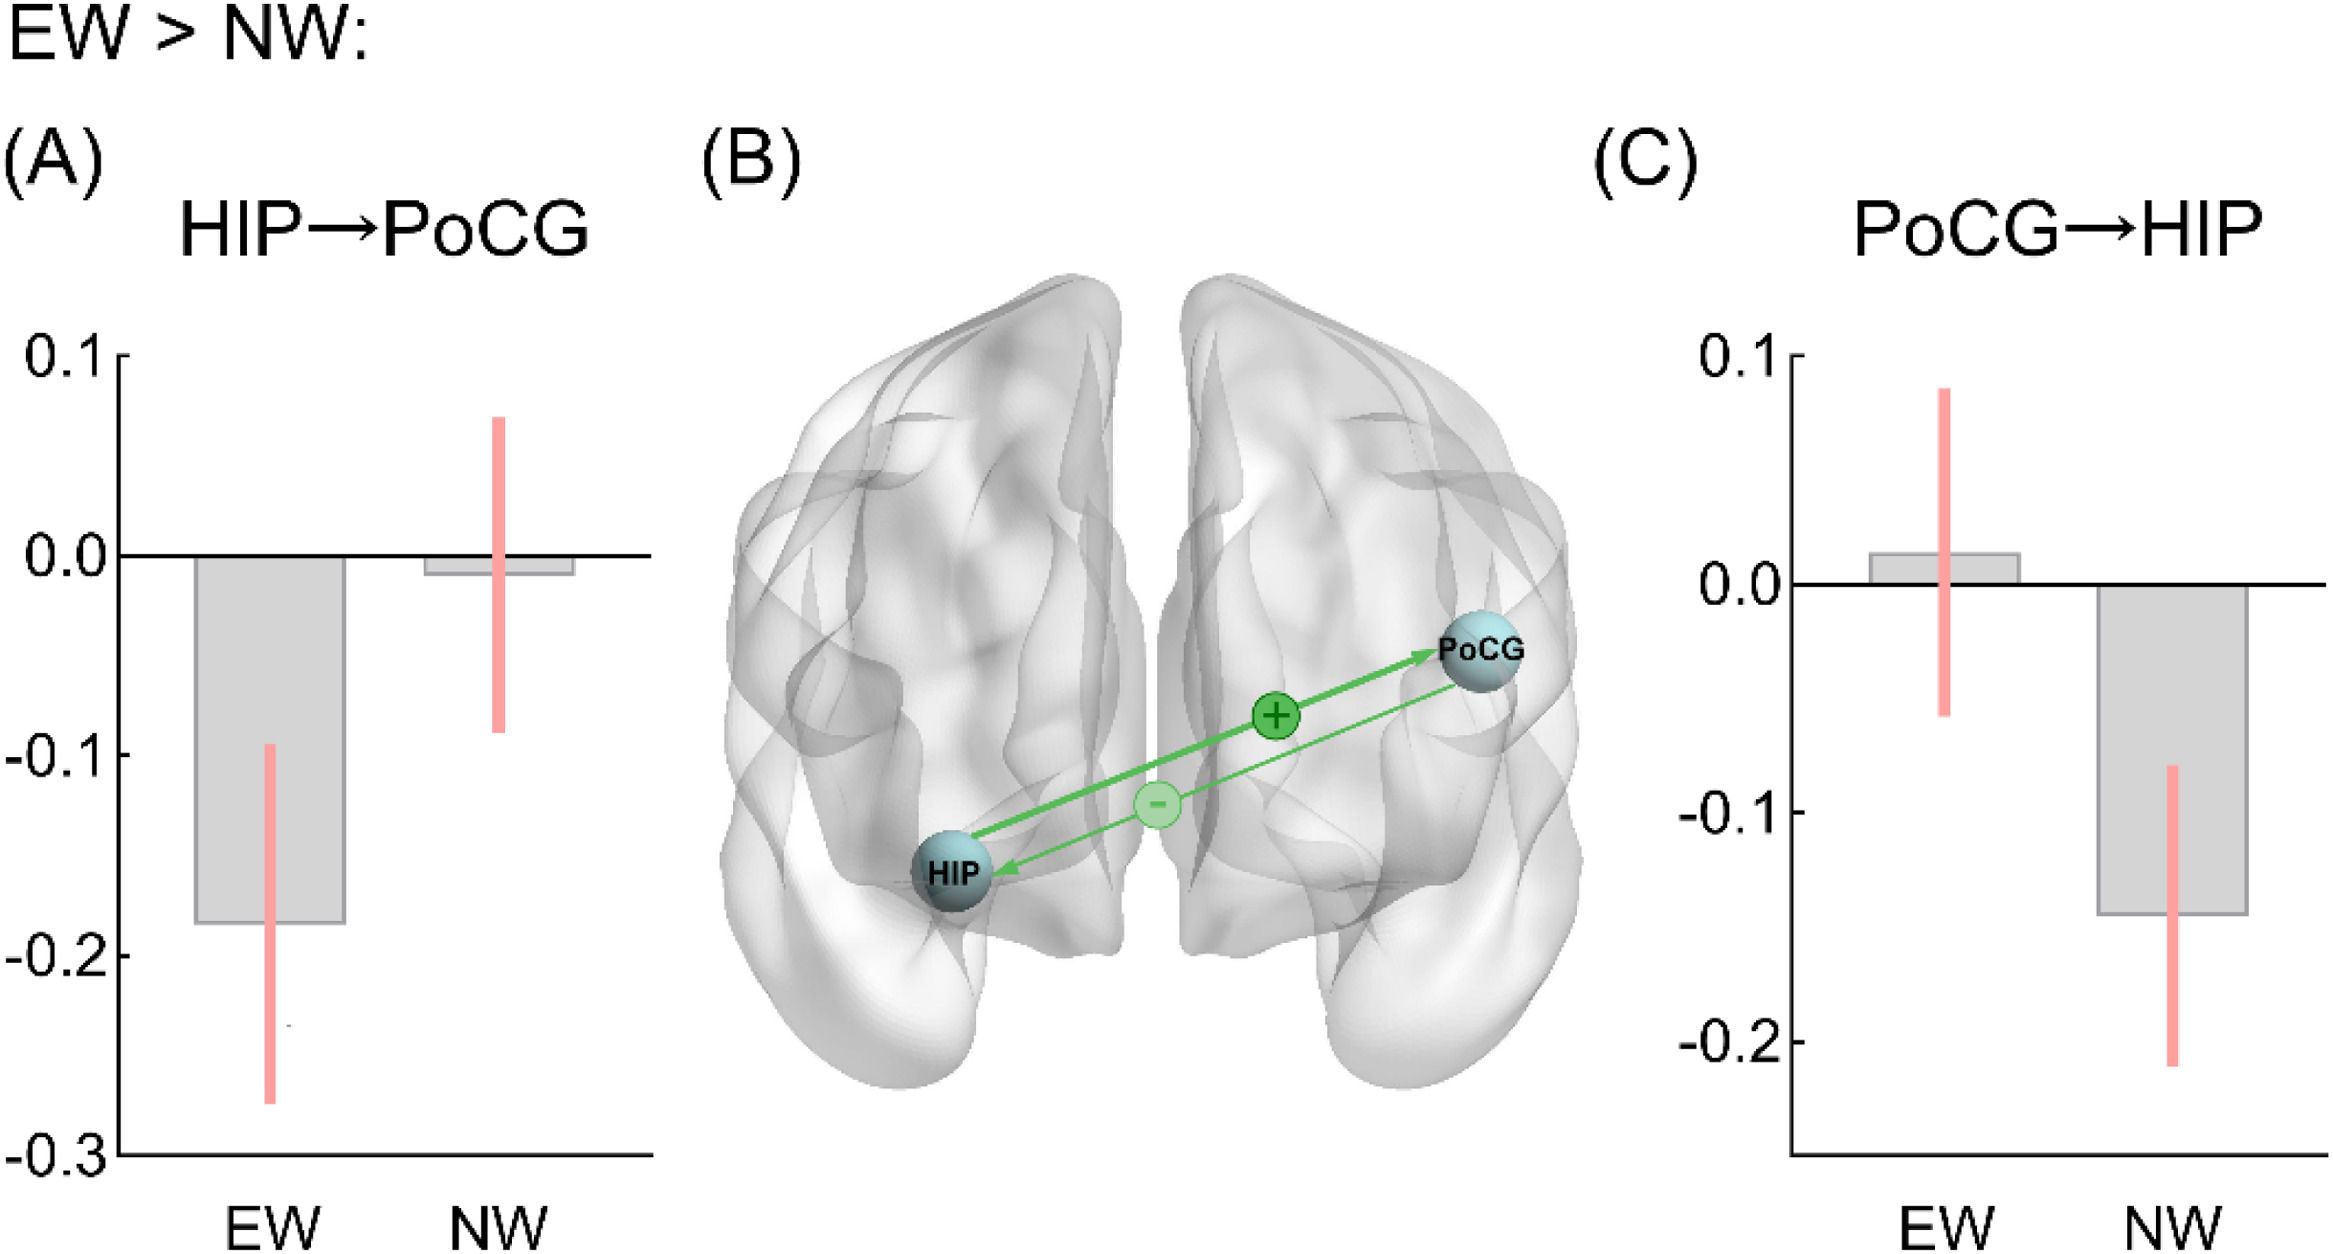
Group comparison of effective connectivityCompared to the NW group, the EW group showed higher inhibitory effect from the right hippocampus to left PoCG (EC_EW = −0.338, EC_NW = −0.129, PP > 0.95), and lower inhibitory effect from the left PoCG to right hippocampus (EC_EW = −0.04, EC_NW = −0.266, PP > 0.95) (Fig. 1).
 and light minus (–) signs indicate the stronger and weaker connectivity effect (strength) in the EW group (compared to NW group), respectively. In panel C, the bar graphs show the group-level values of the PoCG→HIP connection. All displayed connections are for posterior probability > 0.95. Abbreviation: HIP = hippocampus; PoCG = postcentral gyrus; EW = excess weight group; NW = normal weight group.")
Different effective connectivity between groups.
In panel A, the bar graphs show the group-level values of the HIP→PoCG connection. In panel B, the green lines represent inhibitory effects between regions. The dark plus (+) and light minus (–) signs indicate the stronger and weaker connectivity effect (strength) in the EW group (compared to NW group), respectively. In panel C, the bar graphs show the group-level values of the PoCG→HIP connection. All displayed connections are for posterior probability > 0.95.
Abbreviation: HIP = hippocampus; PoCG = postcentral gyrus; EW = excess weight group; NW = normal weight group.
Additional ANCOVA analysis showed that the interaction effects of sex and group on the FC and ECs were not significant after adjusting for age and head motion (F_FC (1,84) = 3.77, p = 0.056; F_HIP→PoCG (1,84) = 2.51, p = 0.117; F_PoCG→HIP (1,84) = 3.23, p = 0.076), suggesting that sex did not affect the results.
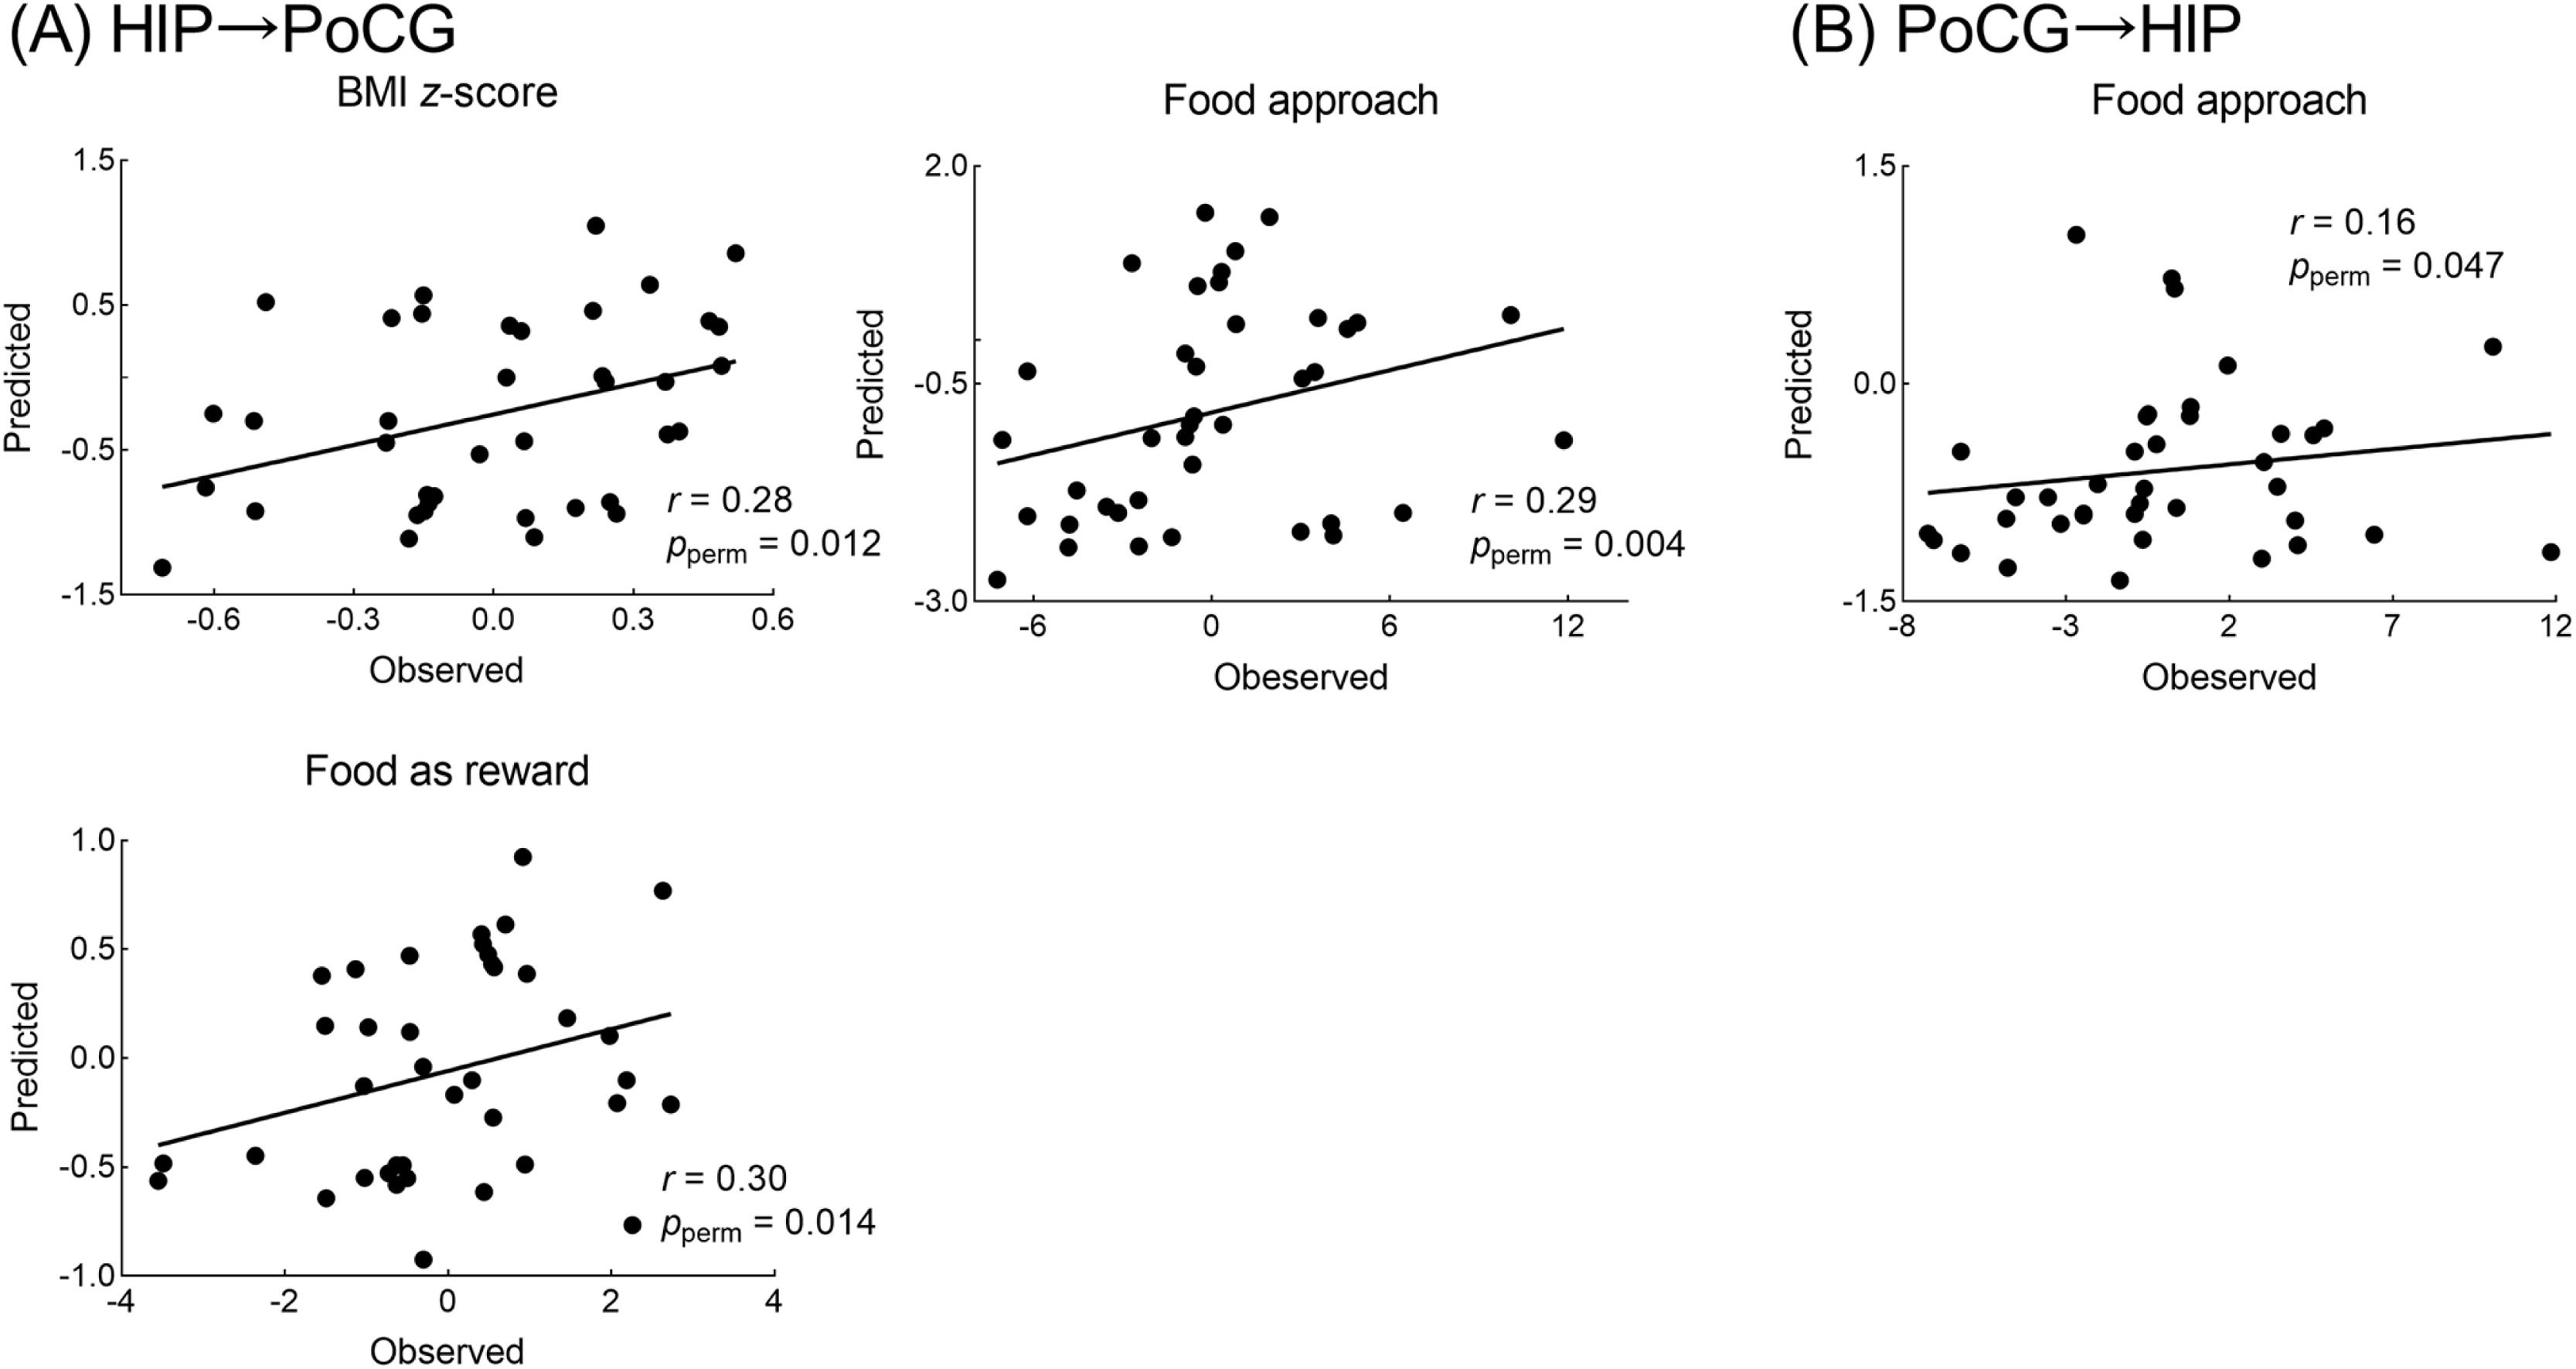
Hippocampus connectivity predicts future BMI and eating behaviorsMachine learning analyses showed that the baseline hippocampus→PoCG EC successfully predicted individual-level BMI z-score (r(observed, predicted) = 0.28, pperm = 0.012), food approach (r(observed, predicted) = 0.29, pperm = 0.004), and food as a reward (r(observed, predicted) = 0.30, pperm = 0.014) one year later. The baseline PoCG→hippocampus EC also effectively predicted individual-level food approach (r(observed, predicted) = 0.16, pperm = 0.047) one year later (Fig. 2). Interestingly, we further observed the opposite pattern of the relationship of effective connectivity with future eating behaviors and BMI (Fig. 3 and supplementary Fig. S2).

Results of effective connectivity predicting longitudinal variables in the excess weight group.
In panel A, the plot showed that the baseline HIP→PoCG connection significantly predicted BMI z-score, food approach, and food as reward one year later, using support vector regression with LOOCV. In panel B, the baseline PoCG→HIP connection significantly predicted food approach one year later, using support vector regression with LOOCV. The pperm values were based on 1000 times permutation tests.
Abbreviation: HIP = hippocampus; PoCG = postcentral gyrus; LOOCV = leave-one-out cross-validation.

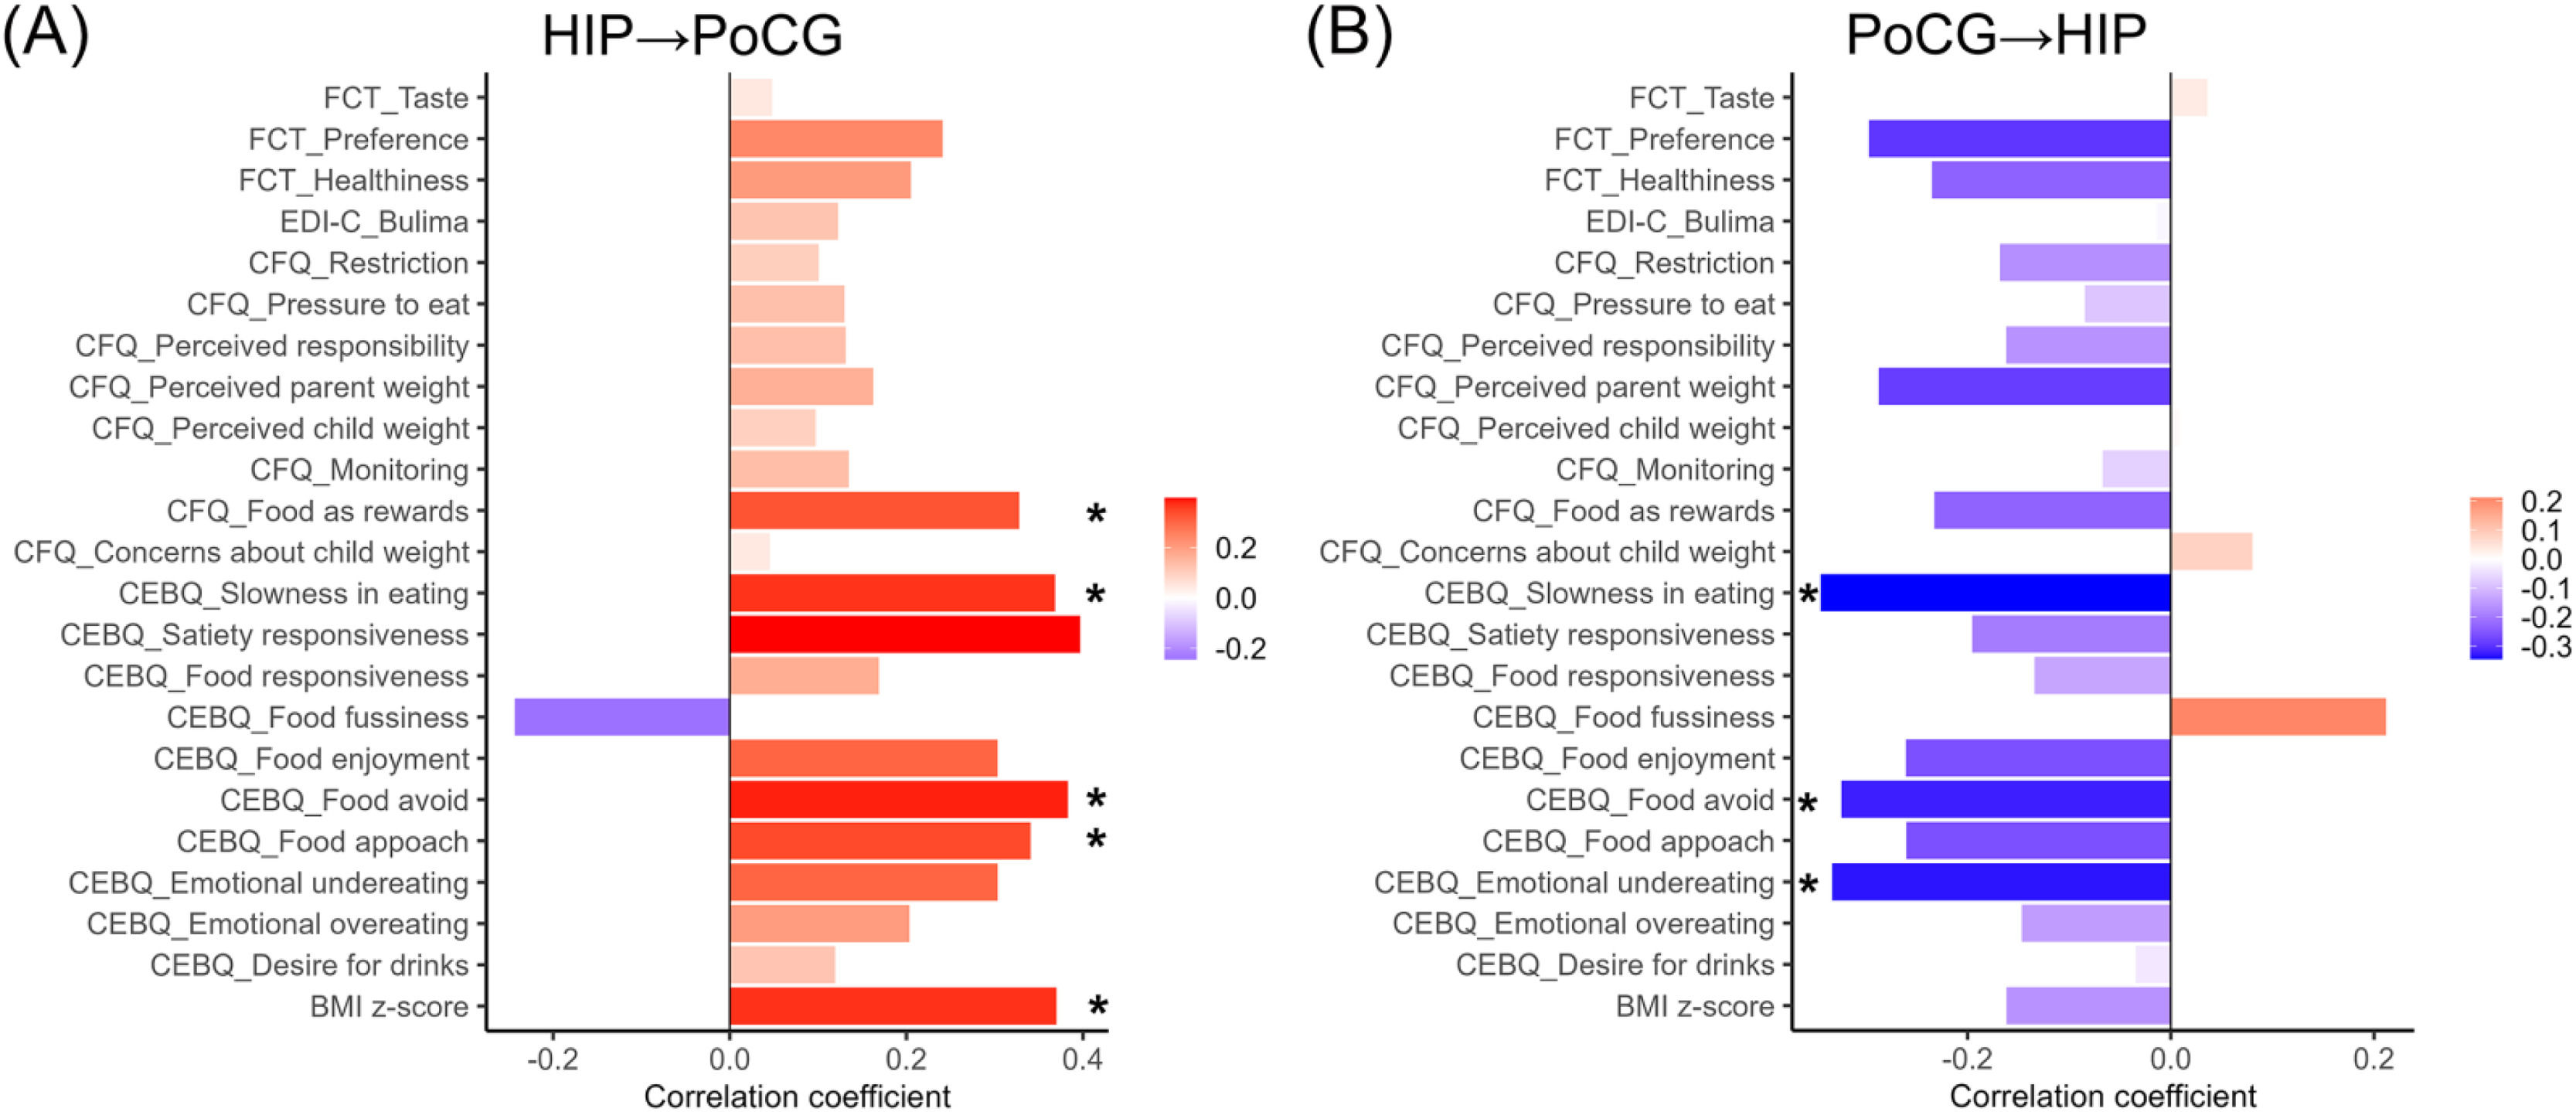
Opposite patterns of the relationship of effective connectivity with eating behaviors and BMI one year later.
In panel A, the HIP→PoCG connection was inversely associated with food responsiveness and BMI z-score, while in panel B, the PoCG→HIP connection was positively associated with food responsiveness and BMI z-score. * p < 0.05.
Abbreviation: HIP = hippocampus; PoCG = postcentral gyrus; CEBQ = children's eating behaviour questionnaire; CFQ = child feeding qestionnaire; EDI-C = eating disorder inventory-child; FCT = food choice task; BMI = body mass index.
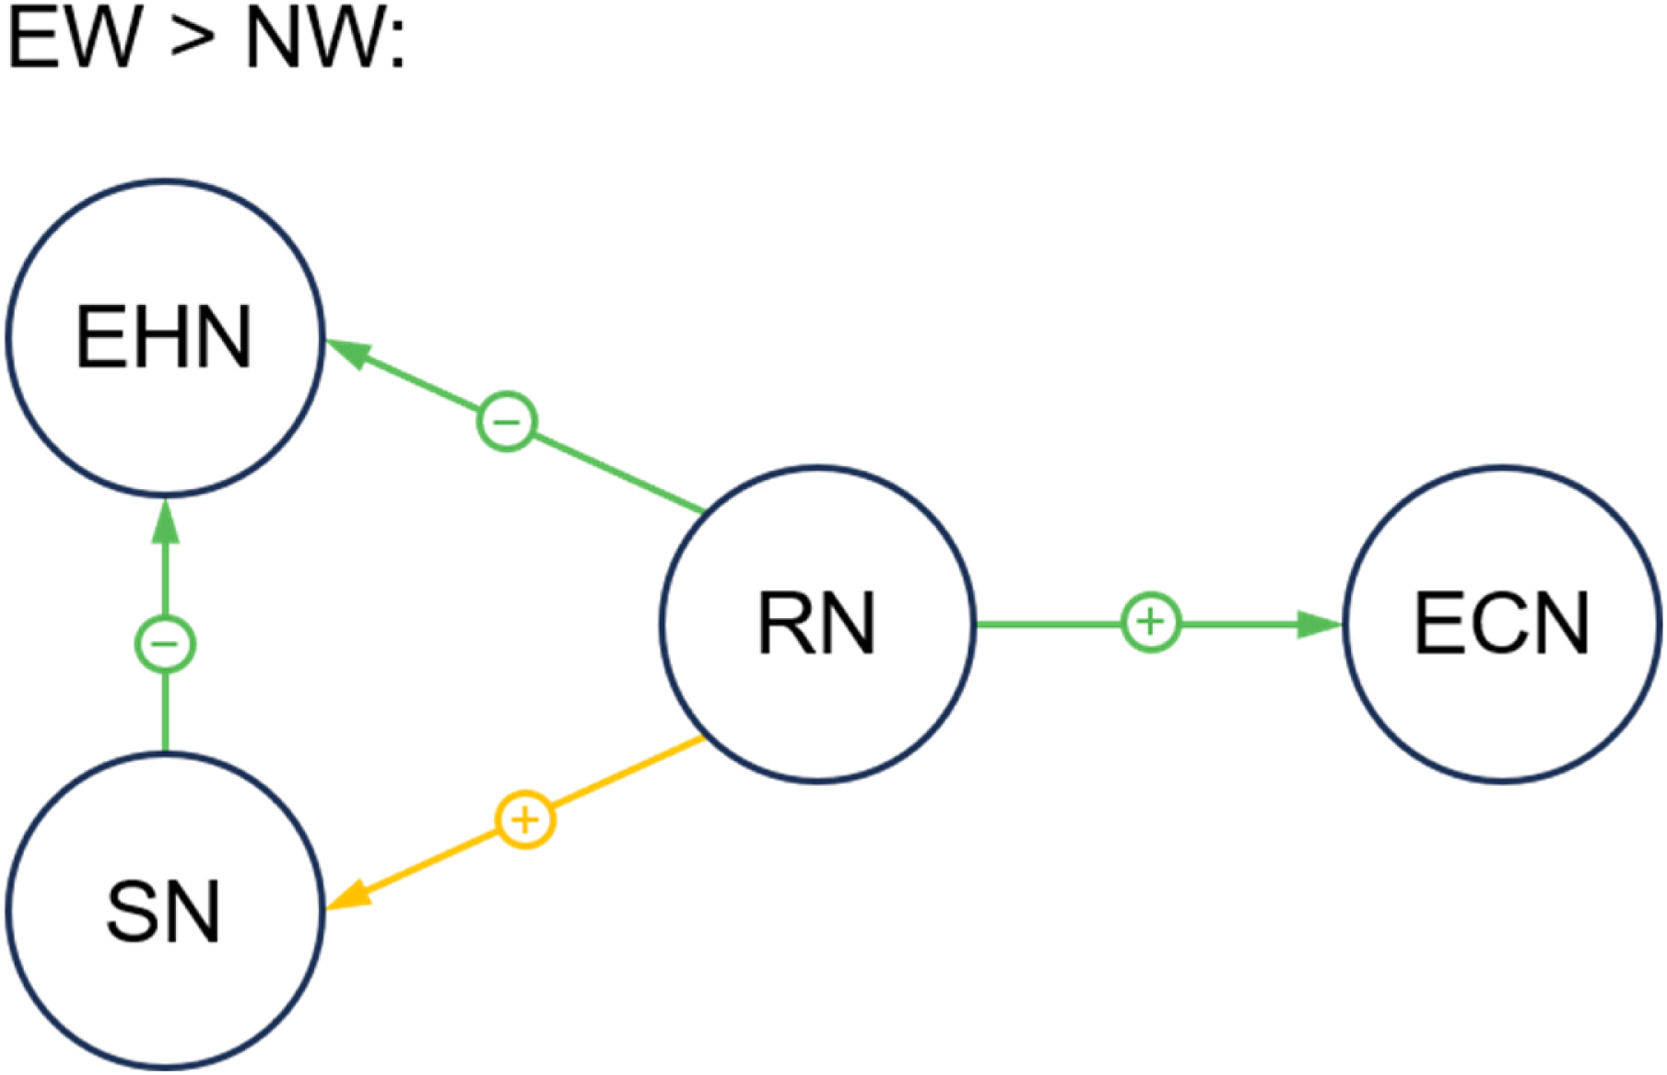
After Bayesian contrasts, compared with NW, the EW group showed: (1) stronger inhibitory ECs from the RN to ECN (averaged connectivity values: EW = −0.38, NW = −0.18, PP = 0.999); (2) weaker inhibitory ECs from the RN to EHN (averaged connectivity values: EW = −0.12, NW = −0.18, PP = 0.970); (3) weaker excitatory ECs from the RN to SN (averaged connectivity values: EW = −0.18, NW = 0.06, PP = 0.997); (4) weaker inhibitory ECs from the SN to EHN (averaged connectivity values: EW = −0.15, NW = −0.22, PP = 0.963) (see Fig. 4).
 and minus (–) signs indicate the stronger and weaker connectivity effect (strength) in the EW group (compared to NW group), respectively. All displayed connections are for posterior probability > 0.95. Abbreviation: EHN = energy homeostatic network; SN = somatosensory network; RN = reward network; ECN = executive control network; EW = excess weight group; NW = normal weight group.")
The extended neural model of childhood obesity.
Compared to the NW group, the EW group exhibited stronger inhibitory effect from RN to ECN, stronger excitatory effect from RN to SN, and weaker inhibitory effect from RN and SN to EHN. The green and yellow lines refer to inhibitory and excitatory effect between regions, respectively. The plus (+) and minus (–) signs indicate the stronger and weaker connectivity effect (strength) in the EW group (compared to NW group), respectively. All displayed connections are for posterior probability > 0.95.
Abbreviation: EHN = energy homeostatic network; SN = somatosensory network; RN = reward network; ECN = executive control network; EW = excess weight group; NW = normal weight group.
Given the crucial role of the hippocampus in obesity and food intake, the current study used the FC and EC indices to investigate abnormal hippocampus-related functional interaction in children with obesity, and combined machine learning technique to examine the predictive role of hippocampal connections in future eating behaviors. Relative to the NW group, the EW group showed lower scores in satiety responsiveness and slowness in eating, which is in line with previous findings that lower slowness in eating and satiety contributed to childhood obesity (Dalrymple et al., 2020; Demir & Bektas, 2017). At the neural level, the EW group displayed weaker strength of FC between the right hippocampus and left PoCG, compared to controls. Regarding the connectivity directions, there was a stronger hippocampus→PoCG inhibitory effect but a weaker PoCG→hippocampus inhibitory effect in EW group. Longitudinally, these ECs successfully predicted future BMI and eating behaviors; interestingly, the predictive relationship of baseline ECs with behavioral variables exhibited an opposite pattern. These novel findings expand the spDCM model of adult obesity by revealing the directional links between crucial networks associated with appetitive regulation.
Altered functional connectivity in children with obesityThe finding that the EW group exhibited lower FC strength between the hippocampus and PoCG than NW group was in accordance with the results of previous adult studies (Park et al., 2020; Sun et al., 2018). The hippocampus, a part of the limbic reward network, plays a crucial role in regulating food intake and integrates multimodal appetite-related signaling (Kanoski & Grill, 2017; Stevenson & Francis, 2017). The PoCG is an essential hub of the primary somatosensory cortex, mainly located in the oral sensory regions (Avery et al., 2021; Miyamoto et al., 2006). The hippocampus and PoCG exhibited hyperactivation during tasting food, especially unhealthy food (Huerta et al., 2014; Stice et al., 2013). Evidence from task-evoked fMRI studies also reported that children with obesity showed higher responsivity in the hippocampus and PoCG when tasting food, demonstrating the abnormal neural mechanism of food intake in individuals with obesity (Mestre et al., 2017; Stice et al., 2011). Thus, the weakened hippocampus–PoCG connection may suggest the decreased ability to maintain balance between appetite regulation and food properties processing in children with overweight/obesity.
Altered effective connectivity in children with obesityThe spDCM technique was used to further examine group differences in the directional effect between hippocampus and PoCG. We observed significant alterations in the bidirectional effects between the hippocampus and PoCG in EW group. On the one hand, the EW group displayed a stronger hippocampus→PoCG inhibitory effect. Although no prior study has explored the directed links among key areas at rest in pediatric obesity samples, one recent adult study using the Granger causal analyses has reported a greater strength of the hippocampus→PoCG connection contributing to obesity (Zhang et al., 2021). The PoCG is involved in unimodal gustatory sensory processing, while the hippocampus serves as an important neural substrate of food motivation processing, receiving and integrating multimodal food attributes from the primary somatosensory cortex (Kanoski & Grill, 2017; Miyamoto et al., 2006). Given that obesity is associated with disrupted top-down pathway of food reward processing (Voigt et al., 2021), our result may suggest that dysregulated top-down related to appetitive processing, as reflected by greater hippocampus→PoCG inhibitory influence, may be related to over-consumption in children with obesity.
On the other hand, the EW group displayed weaker inhibitory effect from the PoCG to hippocampus (i.e., bottom-up pathway of food reward processing) in children with obesity, There is evidence that the EC of somatosensory areas toward hippocampus may act as a potential pathway for providing primary sensory information to higher cognitive processing (Rolls et al., 2022). The weaker PoCG→hippocampus inhibitory effect may suggest aberrant bottom-up convey of food properties, contributing to heightened sensitivity of food cues and overeating in children with obesity. Recently, Zhang et al. revealed that abnormal top-down information flow (hippocampus→PoCG connection) contributed to adult obesity, rather than the bottom-up information exchange (PoCG→hippocampus connection) (Zhang et al., 2021). This inconsistent result could in part be due to the fact that, relative to adults, children tended to rely more on both top-down cognitive processes and bottom-up sensory processes in response to external stimuli (Açık et al., 2010; Fuchs et al., 2024). This difference in cognitive processing may have a potential impact on the neural substrates of obesity in children and adults.
Taken together, the current findings expanded previous EC studies involving adults with obesity (Voigt et al., 2021; Zhang et al., 2021) and deepened our understanding of neurobiomarker of childhood obesity by revealing the dysfunctional top-down (hippocampus→PoCG) and bottom-up (PoCG→hippocampus) pathways of appetite processing during such a critical developmental period. Since comparative researches on the link between directed interactions in relation to food intake and childhood obesity is lacking, this finding should be interpreted with caution and more research is clearly warranted.
Hippocampus connectivity predicts future BMI and eating behaviorsUsing machine learning method, there were two major findings in the EW group: (i) the baseline hippocampus→PoCG connection predicted one-year follow-up BMI z-score, food approach, and parental use of food as a reward, and (ii) the baseline PoCG→hippocampus connection predicted food approach one year later. The hippocampus has been identified as an appetitive region and involved in higher-order cognitive processing, such as food intake, reward, and memory (Stevenson & Francis, 2017). The PoCG is the primary somatosensory cortex and conveys sensory information to the hippocampus, contributing to food intake regulation (Kanoski & Grill, 2017). Evidence from longitudinal studies have demonstrated that activities in the hippocampus and somatosensory were linked with future BMI of adolescents and older adults (Burdette et al., 2022; Park et al., 2020). Based on larger neuroimaging datasets, our recent multivariate resting-state functional connectome-based prediction study also suggested that dysfunctions in regions involved in encoding food cues may act as reproducible biomarkers of obesity (Wang et al., 2023). In addition, presurgery FC between the hippocampus and PoCG predicted changes of food approach one year later after bariatric surgery in adults with obesity (Cerit et al., 2019). Using the perspective of directional interactions, our findings support and expand the vicious circle model of obesity, and suggest that impaired appetitive regulation between hippocampus and somatosensory cortex may drive future consumption of harmful foods, thereby facilitating weight gain and obesity for children (Rapuano et al., 2016). Furthermore, parental feeding behaviors (e.g., parental use of food as a reward) may have the potential impact on child food preference and overeating behavior (Benton, 2004; Powell et al., 2017). Thus, the result that the predictive association between hippocampus→PoCG connection and parental use of food as a reward for their children may highlight the vital role of parental feeding behaviors in children's eating and the development of obesity (Anzman et al., 2010).
Interestingly, this study found the opposite pattern in the link of ECs with eating behaviors and BMI one year later in the EW group. Future BMI and eating behaviors tended to be positively correlated with the top-down hippocampus→PoCG connection, while negatively correlated with the bottom-up PoCG→hippocampus connection. Machine learning analyses further revealed that the top-down EC showed stronger predictive efficacy for eating behaviors compared to the bottom-up EC, suggesting that dysfunctional top-down circuit of appetite regulation may be a more sensitive predictor of children's future BMI and eating behaviors, relative to the bottom-up pathway (Kaisari et al., 2019). According to the guidelines for the constituents of small (r = 0.10), medium (r = 0.30), and large (r = 0.50) effect sizes (Cohen, 2013), significant small-to-medium correlations (i.e., effect sizes) between the brain and behaviors may reflect the high statistical significance and relatively weak practical significance (Bobko & Rieck, 1980) of the rs-fMRI findings. Considering that the effect size of our prediction results was relatively small, these findings should be interpreted with caution and need to be validated in future longitudinal cohort studies with larger sample sizes.
Extension of adult obesity spDCM modelThis study further established a more comprehensive neurobiological model in pediatric obesity (Fig. 4) based on the findings of Voigt et al. (2021). Compared to the NW, we found (a) the EW group showed stronger inhibitory effect from RN to ECN, (b) weaker inhibitory effect from RN and SN to EHN, and (c) weaker excitatory effect from RN to SN. The inhibitory effect means that one region might decrease the rate of change in activity to another, while the excitatory effect means that one region might increase the rate of change in activity to another. First, children with EW exhibited stronger RN→ECN inhibitory effect. Our prior studies found the neural correlates of dysregulated eating with imbalanced RN–ECN interaction, which may demonstrate deficits in inhibitory control (Chen et al., 2021, 2023; W. Li et al., 2024). Voigt et al. (2021) also found the impaired self-control regulation regions in adults with increased BMI during hunger state. Although the present study did not measure resting-state fMRI in a hunger state, we still observed an inhibitory effect of RN on ECN, suggesting that the food rewards processing may override attenuated inhibitory control in children with EW, thus facilitating overeating and weight gain Stice and Burger, (2019). Additionally, SN and RN exhibited weaker inhibitory influence to ECN in the EW group compared to controls. Similar results have been reported in adults (Voigt et al., 2021), which may support the eating in the absent hunger framework and suggest that the energy homeostasis system is influenced by the non-homeostatic system that processes food-related salient and hedonic stimuli. Finally, RN exhibited weaker excitatory influence on SN in the EW group. Previous task-based fMRI study has shown that children at risk for obesity exhibited higher activation in somatosensory and reward regions in response to food, suggesting that a hyper-responsivity to food reward may require somatosensory cortex to convey more specific information about palatable food (Stice et al., 2011). The current finding that lower RN→SN excitatory effect appears to be a compensatory mechanism for altered food reward sensitivity in children with EW at rest. Overall, these findings supported and extended the adult obesity spDCM model recently proposed by Voigt et al. at the network level. Future task-based fMRI studies are needed to examine how these core networks dynamically interact to contribute to obesity when performing food processing tasks.
Practical implicationsThe key brain nodes and particular neural circuits (e.g., HIP→PoCG) identified in this study may provide precise targets for developing early prevention strategies and intervention measures of overweight and obesity. Although numerous studies have revealed that poor appetite regulation leads to childhood obesity (for a review, see A. S. Bruce et al., 2011), our findings further suggest that intervention measures targeting a combination of food intake regulation and food sensory information processing appear to be more effective than those focused on one function (Bathrellou et al., 2010; Kim et al., 2020). Together with the longitudinal findings of the present study, prevention programs aiming to reduce unhealthy food approach behaviors in children such as emotional overeating, could help promote healthier weight status during such a critical developmental period. This research also invites further work to explore the development of neurofeedback training for overweight and obesity, thus promoting physical and mental health of children.
Limitations and future directionsThis study has several potential limitations. The current study was a relatively short follow-up (1 year) longitudinal design, but it cannot infer the causal relationship. Future studies could follow up a longer interval (>3 years) and use other longitudinal analyses, such as growth curve modeling (Rogers et al., 2023), to investigate how brain changes over time in children with obesity and how these changes contribute to future eating behaviors and weight gain during childhood, which would contribute to the identification of neurological risk factors for childhood obesity. Additionally, although all participants underwent brain scanning at a fixed time period between 11:00 and 13:30 after lunch, the level of feelings of hunger were not collected, which should be considered in future studies. Since pubertal status has been identified as an important factor associated with brain function (Barch et al., 2018), our future research will replicate the major findings by including pubertal status (e.g., the Pubertal Development Scale) as covariates of no interest (Murray et al., 2022). Another limitation was the relatively small sample size of the machine learning analysis. Future longitudinal studies should increase sample size to leverage more statistical power, thus making more generalizable claims. Finally, further investigations are warranted to identify the distinct neural underpinnings of overweight and obesity in children, as well as the possible influence of sex disparities on them, which will facilitate the identification of neurobiological markers associated with diverse weight statuses.
ConclusionThis is the first attempt to investigate the critical role of hippocampal undirectional and directional connections in childhood obesity from cross-sectional and longitudinal perspectives. Abnormal information exchange in the appetitive regulation circuitry between the hippocampus to somatosensory cortex, as reflected by bidirectional inhibitory effects, may be the crucial neurofunctional substrates of pediatric obesity and future food approach behavior. This study provides novel insights into the neural hierarchical mechanisms underlying childhood obesity and further expand the adult obesity spDCM model of by identifying the directionality of abnormal influences between crucial circuits associated with appetitive regulation.
Compliance with ethical standardsThe research protocol was reviewed for compliance with the standards for the ethical treatment of human participants and approved by the Ethical Committee for Scientific Research at the university with which the authors are affiliated.
Research involving human participantsAll ethical guidelines for human subjects’ research were followed.
Informed consentAll participants provided written informed consents to participate in the study.
This study was funded by National Natural Science Foundation of China (No. 32271087), the National Social Science Foundation of China (No. 22&ZD184), Chongqing Science and Technology Foundation (No. 2023GJJL-ZXX0001), and Innovative Research Project for Postgraduate Student of Chongqing (No. CYB240082). We would like to thank all the members of the Self and Health Research Lab, Southwest University for their invaluable help in data acquisition. We would like to thank Professor Yuan Zhou (CAS Key Laboratory of Behavioral Science) for statistical advice.
