


The neural mechanisms and long-term effects of perceived stress (PS) and self-control (SC) on mental health (MH) are not fully understood. This study seeks to investigate the influence of PS and SC on MH and to identify their neural correlates using fMRI.
MethodsA total of 817 college students participated in behavioral assessments, including the Perceived Stress Scale (PSS), Self-Control Scale (SCS), and Mental Health Continuum Short Form (MHC-SF). Among them, 371 underwent fMRI scans to calculate zfALFF and whole-brain functional connectivity. Additionally, their behavioral measures were reassessed two years later.
ResultsLongitudinal behavioral data revealed significant fixed effects of perceived stress and self-control on mental health. Perceived stress significantly predicted decreased mental health at Time 2, and self-control acted as a mediator in such relationship. The results of the behavioral and brain model analyses found that zfALFF in the right temporal region negatively predicted self-control. Functional connectivity between the right temporal region and the right precentral gyrus was also found to negatively predict self-control.
ConclusionThis study highlights the mediating role of self-control in the relationship between perceived stress and mental health. It also identifies specific brain regions and functional connectivity associated with self-control, providing new neurobiological evidence for mental health interventions.
The increasing prevalence of mental health issues among college students is a growing concern, with increasing numbers of students worldwide struggling with mental disorders such as anxiety, depression, and substance use disorders (Auerbach et al., 2018; Husky et al., 2023; Pedrelli, Nyer, Yeung, Zulauf & Wilens, 2015; Zhang et al., 2023). Compared to adults, college students are particularly vulnerable to mental health challenges. Studies have shown that mental health is a strong predictor of self-harm and suicidal behaviors, individuals with poorer mental health are more likely to engage in self-harm and show an increased risk of suicide (O'Neill et al., 2018; Taliaferro & Muehlenkamp, 2015). Therefore, understanding the mental health status of college students and identifying key risk and protective factors for mental health issues are crucial for addressing these concerns and developing effective intervention strategies.
Perceived stress is the subjective evaluation of the degree to which individuals perceive their life situations as stressful (Cohen, Kamarck & Mermelstein, 1983). Unlike environmental stressors, perceived stress focuses on the overall appraisal of stress rather than specific events or experiences (Lee, 2012). It reflects individuals’ subjective responses to stressors (Kopp et al., 2010; Lazarus, 1984). Perceived stress is particularly pronounced among college students, who face various challenges such as academic demands, social pressures, and financial constraints (Pedrelli et al., 2015; Saleh, Camart & Romo, 2017; Stallman, 2010). High level of perceived stress is closely associated with various mental health issues (Lindholdt et al., 2022), including depression, anxiety, and suicidal behavior (Bergdahl & Bergdahl, 2002; Chen & Kuo, 2020; Cristóbal-Narváez, Haro & Koyanagi, 2020). In contrast to perceived stress, self-control refers to individuals’ capacity to regulate their responses, resisting immediate temptations to achieve long-term goals (Tangney, Baumeister & Boone, 2004), which is crucial for maintaining mental well-being and acts as a protective factor against mental health issues (Li, Yang, Dou & Cheung, 2020). Individuals with low self-control are more susceptible to conditions such as depression (Özdemir, Kuzucu & Ak, 2014) and anxiety (Geng, Gu, Wang & Zhang, 2021). Survey findings suggest a negative correlation between self-control and perceived stress (Liu et al., 2018; Peng et al., 2022; Zhang et al., 2022b), indicating that self-control may influence the relationship between perceived stress and mental health outcomes. In addition, there is a negative correlation between early stress and later self-control(Gu, 2020; Nielsen, Bauer & Hofmann, 2020). Early stress can also negatively predict later self-control (Jeong, Ferguson & Lee, 2019).
Further investigation is warranted into the role of brain response in regulating mental health outcomes, particularly in individuals with typical mental health conditions where changes in brain response are closely linked to specific symptoms. For example, enhanced connectivity in the dorsal nexus among the cognitive control network, default mode network, and affective network may underlie the co-occurrence of various depressive symptoms in individuals with depression (Sheline, Price, Yan & Mintun, 2010). Similarly, increased functional connectivity between the subgenual prefrontal cortex and the default mode network has been associated with depressive rumination (Hamilton, Farmer, Fogelman & Gotlib, 2015). In studies using resting-state functional magnetic resonance imaging (fMRI) in healthy adolescents, it was observed that perceived stress mediated the relationship between fractional amplitude of low-frequency fluctuations (fALFF) in the left superior frontal gyrus and depressive symptoms (Wang et al., 2019). Additionally, increased perceived stress is directly linked to enhanced functional connectivity between the amygdala and frontal cortical regions (Caetano et al., 2022). In contrast, reduced activity in the anterior cingulate cortex during inhibitory control failure is associated with low self-control (Meldrum, Trucco, Cope, Zucker & Heitzeg, 2018). The medial prefrontal cortex is crucial for self-relevant value judgments, which are essential for self-control execution (Seitz, Franz & Azari, 2009). Additionally, the ventral prefrontal cortex and dorsolateral prefrontal cortex are also closely related to self-control ability (Cohen, Berkman & Lieberman, 2013; Xu, Sirois, Zhang, Yu & Feng, 2021).
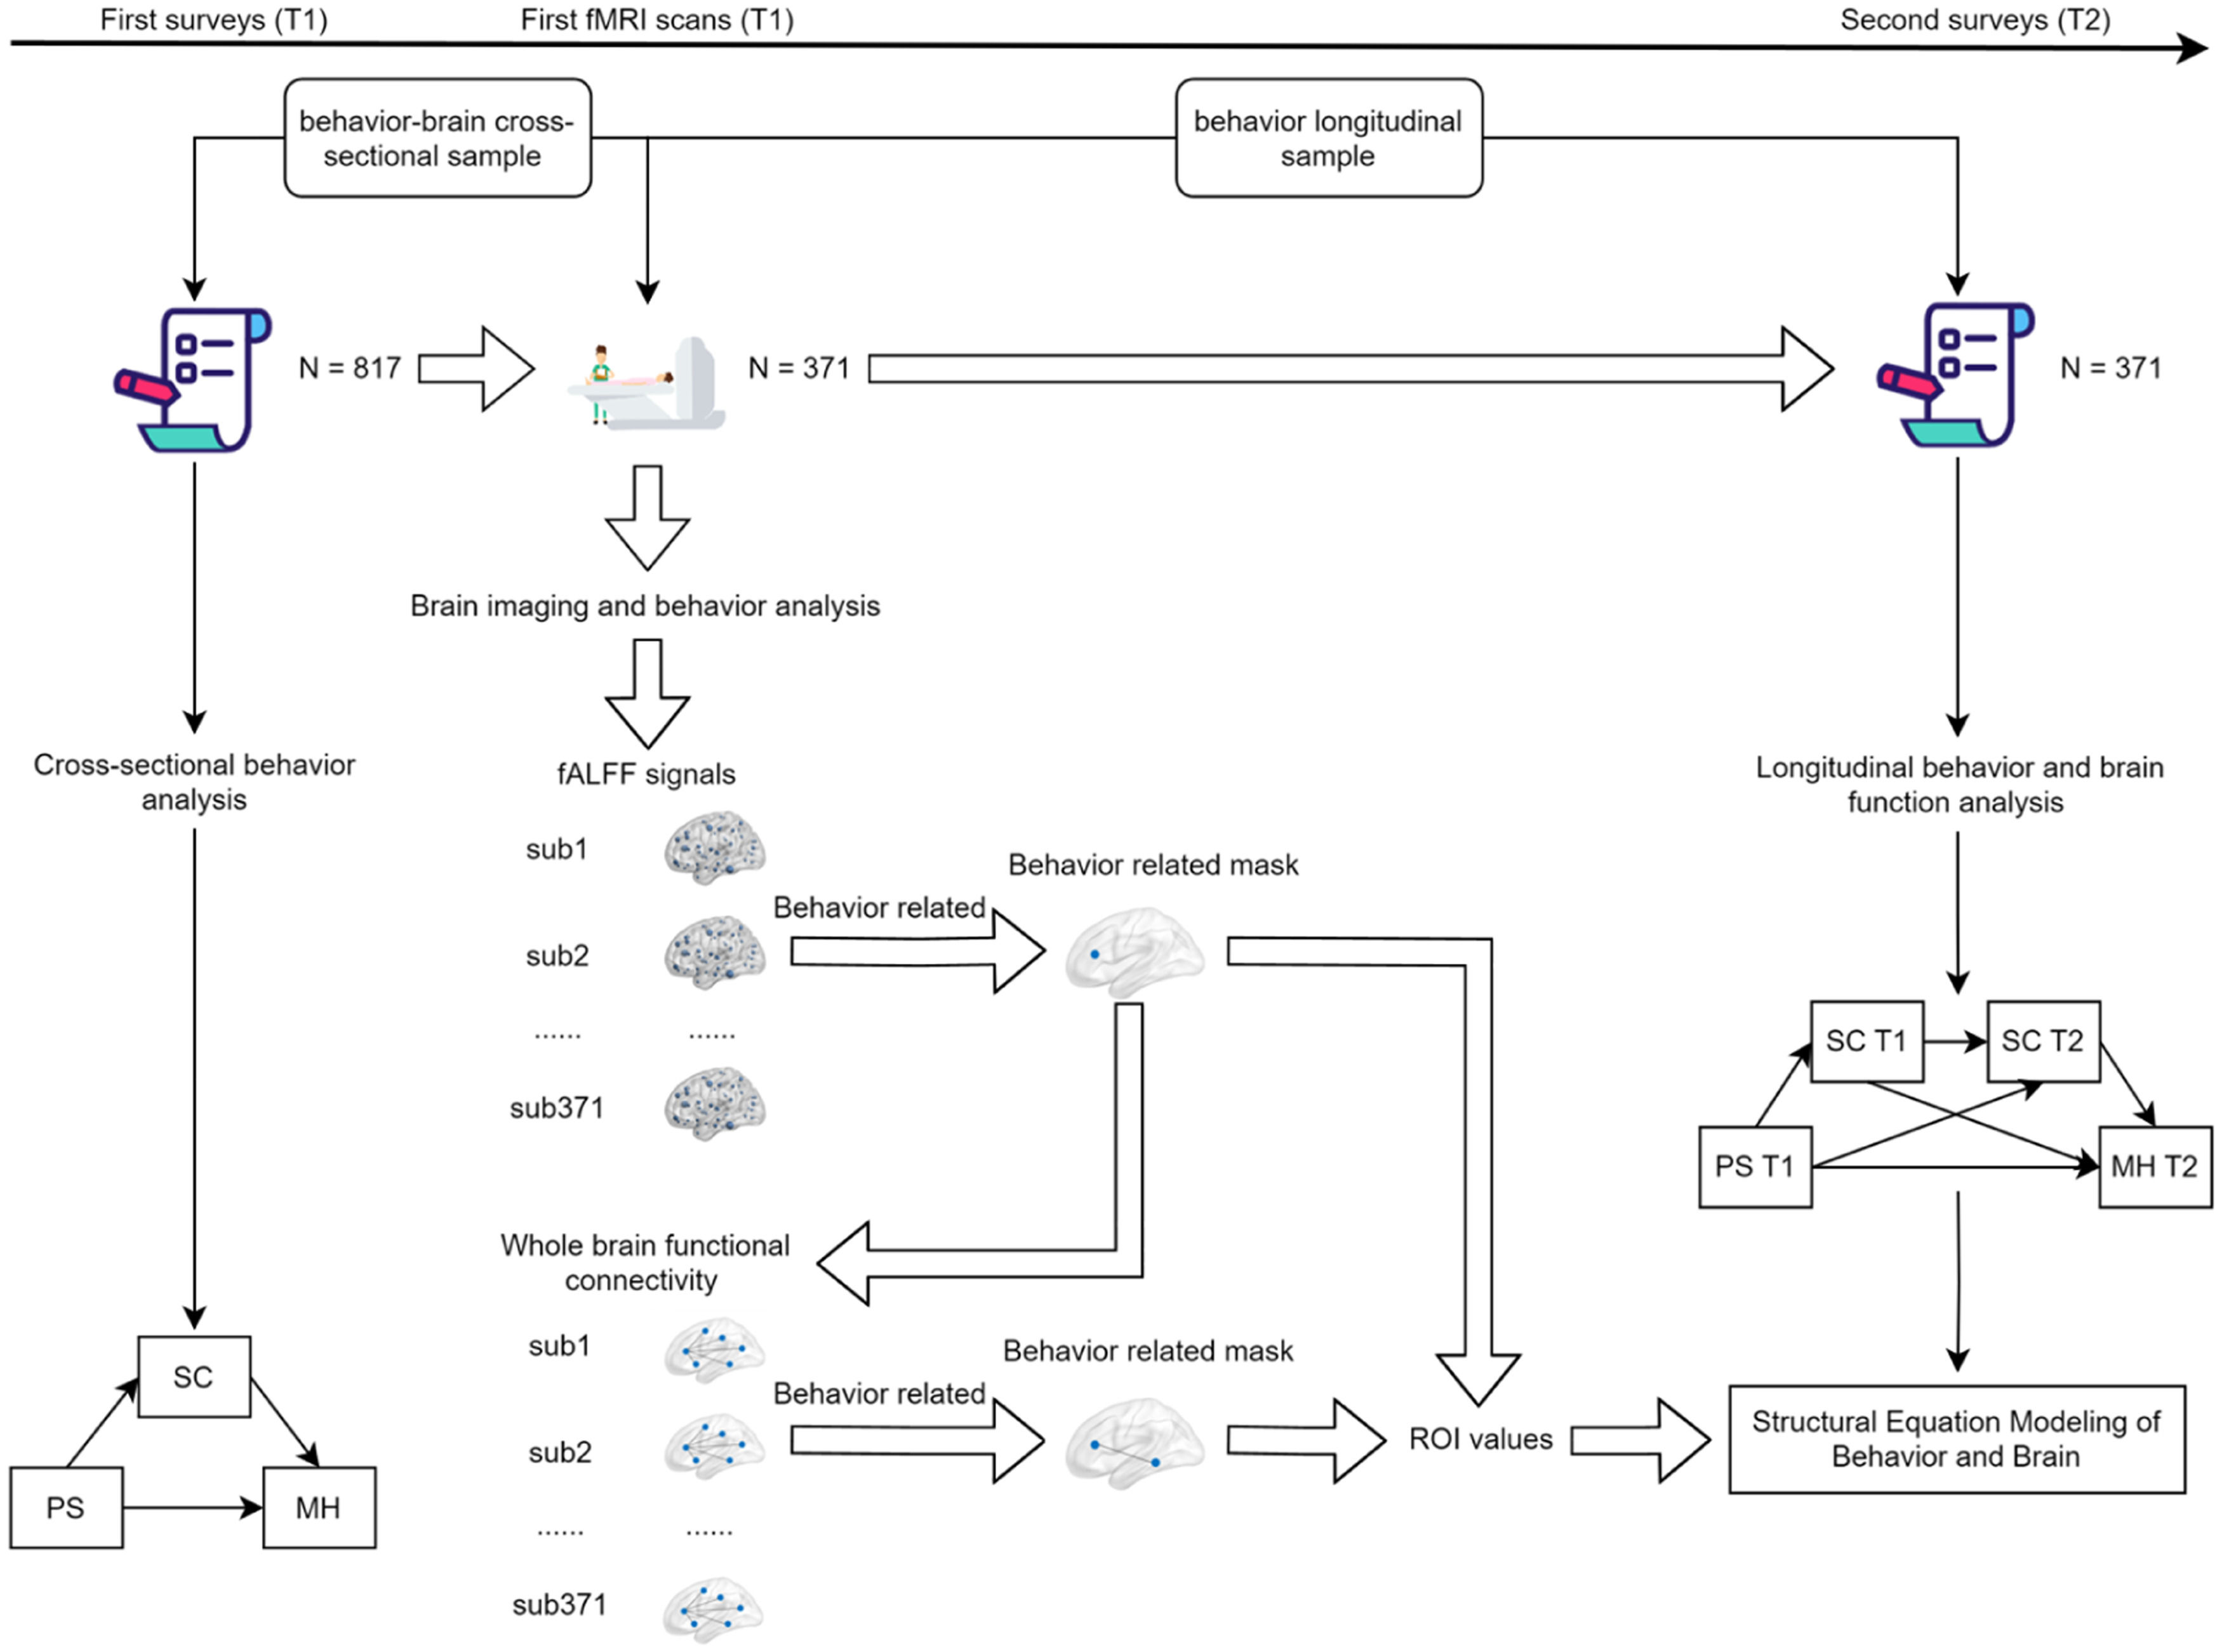
Previous studies have predominantly focused on the relationship between perceived stress and mental health, as well as the individual impacts of self-control on perceived stress and mental health. However, there has been a lack of comprehensive exploration into the interplay among perceived stress, self-control, and mental health. Therefore, the purpose of this study is to investigate the influence of perceived stress and self-control on the mental health of college students, and how these factors manifest in brain response. This study hypothesizes that perceived stress negatively predicts self-control and mental health, with self-control acting as a buffering mediator that positively predicts mental health. In terms of brain response, this study will explore the neural mechanisms associated with perceived stress, self-control, and mental health. It is anticipated that brain regions involved in executive function and stress response, such as the prefrontal cortex, anterior cingulate cortex, temporal lobe, precentral gyrus, and amygdala, may exhibit relevant patterns of response. The overall framework of this study is illustrated in Fig. 1.

Overall study framework.This study framework encompasses the behavioral analysis process of the effects of perceived stress and self-control on mental health, the imaging analysis process of fALFF and whole-brain functional connectivity, as well as the process of constructing behavioral and brain models.
Between January and October 2020, a group of 835 college students took part in a questionnaire survey. All participants were recruited via posters, in-person outreach, and invitations. The inclusion criteria were: 1) first or second-year college students to facilitate follow-up; 2) no metal implants in the body; 3) no neurological or psychiatric disorders; 4) no claustrophobia. The exclusion criteria were: 1) presence of metal implants; 2) history of neurological or psychiatric disorders; 3) recent history of surgery or trauma. After the data were screened, 18 participants were excluded, leaving a final sample of 817 participants. Of these, 380 participants voluntarily underwent an 8-minute MRI scan, which captured both structural and functional images. Due to poor scan quality (evaluated through visual inspection) or excessive head movement (defined as mean displacement > 2 mm or >25 % scrubbed time points), 9 participants were further excluded. This resulted in 371 participants being eligible for the study, forming the behavior-brain cross-sectional sample (BBX). Two years later, from October to December 2022, the initial 371 participants were invited to participate in a follow-up survey, forming the behavior longitudinal sample (BL). The study received approval from the local ethics committee, and all participants provided written informed consent prior to participation.
Behavior measuresPerceived stress scale (PSS)The PSS consists of 14 items designed to measure the level of stress perceived by participants over the past month (Cohen et al., 1983). Each item is rated on a 5-point Likert scale ranging from 0 to 4 (0 = never, 1 = occasionally, 2 = sometimes, 3 = often, 4 = always). Items 4, 5, 6, 7, 9, 10, and 13 are phrased positively and are reverse scored. The total score ranges from 0 to 56, with higher scores indicating a higher level of perceived stress.
Self-control scale (SCS)The SCS was originally developed by Tangney and colleagues (Tangney et al., 2004). In 2008, Chinese scholars Tan and Guo (2008) adapted the scale to align with traditional Chinese culture. The revised scale consists of 19 items designed to measure an individual's self-control capacity. Each item is rated on a 5-point Likert scale ranging from 1 to 5 (1 = completely untrue, 2 = mostly untrue, 3 = unsure, 4 = mostly true, 5 = completely true). All items except for 1, 5, 11, and 14 are reverse scored. The total score ranges from 19 to 95, with higher scores indicating stronger self-control trait.
Mental health continuum short form (MHC-SF)The MHC-SF consists of 14 items and is used to rapidly assess an individual's overall mental health (Keyes, 2009; Keyes et al., 2008). The scale employs a 6-point Likert scale ranging from 1 to 6 (1 = never, 2 = almost never, 3 = rarely, 4 = sometimes, 5 = often, 6 = every day). The total score ranges from 14 to 84, with higher scores indicating a better mental health state.
Image acquisitionAll participants in this study underwent a resting-state functional magnetic resonance imaging scan lasting 8 min using a 3T SIEMENS PRISMA scanner (Erlangen, Germany). Participants were asked to open their eyes and not think about anything during the fMRI scan. A gradient echo planar imaging sequence was used to obtain 240 functional volumes. The scanning parameters are as follows: repetition time (TR) = 2000 ms, echo time (TE) = 30 ms, field of view (FOV) = 224 × 224, flip angle (FA) = 90 °, slices = 62, thickness = 2 mm, slice gap = 0.3 mm, voxel size = 2 × 2 × 2 mm3. In addition, the magnetization-prepared rapid acquisition gradient echo (MPRAGE) sequence was used to obtain high-resolution T1 weighted structural images. The scanning parameters are as follows: TR = 2530 ms, TE = 2.98 ms, FOV = 224 × 256 mm2, resolution matrix = 448 × 512, FA = 7°, slices = 192, thickness = 1.0 mm, inversion time = 1100 ms, voxel size = 0.5 × 0.5 × 1 mm3.
Data preprocessingPreprocessing of the fMRI data was conducted using the SPM12 and CONN v20.b toolboxes. The steps included temporal alignment, field-based deformation correction, and motion correction. Following these corrections, spatial normalization was carried out to match high-resolution anatomical images of individuals with functional images. These images were then segmented into regions comprising gray matter, white matter, cerebrospinal fluid, etc. The segmented images were normalized to the Montreal Neurological Institute (MNI) space using the DARTEL process workflow, and subsequently smoothed with a 6 mm full-width at half-maximum (FWHM) kernel. The denoising process entailed regressing out head motion parameters using the Friston 24-parameter model (Friston, Williams, Howard, Frackowiak & Turner, 1996) and further eliminating individual physiological noise and motion artifacts by applying the aCompCor method (Muschelli et al., 2014). Following this step, the fMRI data was used to compute the Amplitude of Low-Frequency Fluctuation (ALFF). Subsequently, the data underwent linear detrending and band-pass filtering (0.01–0.1 Hz) to prepare for calculating ROI-based whole-brain functional connectivity.
Statistical analysisBehavioral data analysis was conducted using R version 4.3.3 for data preprocessing, demographic statistics, correlation analysis, and linear mixed-effects model analysis. Structural Equation Modeling (SEM) for both cross-sectional and longitudinal data was performed using Mplus version 8.3. Model fit was evaluated using the following indices: chi-square degrees of freedom ratio, Comparative Fit Index (CFI), Tucker-Lewis Index (TLI), Root Mean Square Error of Approximation (RMSEA), and Standardized Root Mean Square Residual (SRMR). Gender and age were included as control variables, and multiple comparisons were corrected using the False Discovery Rate (FDR) method. The significance level was set at α = 0.05 for bilateral p-values.
Neuroimaging data analysis was performed using DPARSF 5.4 (Yan, Wang, Zuo & Zang, 2016). The fALFF map for each participant was calculated and subsequently converted into a z-map using Fisher's r-to-z transformation, resulting in a zfALFF map. Correlation analysis between zfALFF and behavioral variables was then conducted to obtain correlation coefficient maps. Significant regions were identified using GRF multiple comparison correction (voxel-wise p < 0.001; cluster-wise p < 0.05), and the mask of these significant regions was extracted. Based on this mask, ROI values were extracted for all participants in the BL sample to be used in subsequent behavior- brain model construction. Additionally, the mask of significant regions from the previous step was used to calculate whole-brain functional connectivity based on ROI. Correlation analysis between whole-brain functional connectivity and behavioral variables was performed, and significant regions' masks were extracted. ROI values were then calculated for subsequent behavior- brain model construction. All these analyses controlled for gender, age, and head motion.
Behavior and brain analysis was conducted using R version 4.3.3 to construct multiple linear regression models, with SC score from T1 and T2 serving as the outcome variables, respectively. Gender, age, and zfALFF or functional connectivity were included as predictor variables. The FDR was employed to adjust for multiple comparisons. Additionally, Mplus version 8.3 was used to construct structural equation models (SEMs) to analyze the influence of zfALFF or functional connectivity on the mediator variable, SC. Of which, gender and age were included as control variables.
ResultsBehavior resultsParticipant characteristicsThe BBX sample consisted of 817 participants (547 females and 270 males), with an average age (SD) of 18.97 (1.01) years. The mean PS score (SD) was 27.23 (6.48), the mean SC score (SD) was 59.76 (10.19), and the mean MH score (SD) was 48.62 (8.87). The BL sample consisted of 371 participants (263 females and 108 males). At T1, the mean PS score (SD) was 27.45 (6.47), the mean SC score (SD) was 59.59 (10.22), and the mean MH score (SD) was 48.37 (8.35). At T2, the mean PS score (SD) was 42.53 (7.21), the mean SC score (SD) was 56.86 (10.28), and the mean MH score (SD) was 47.49 (8.81).
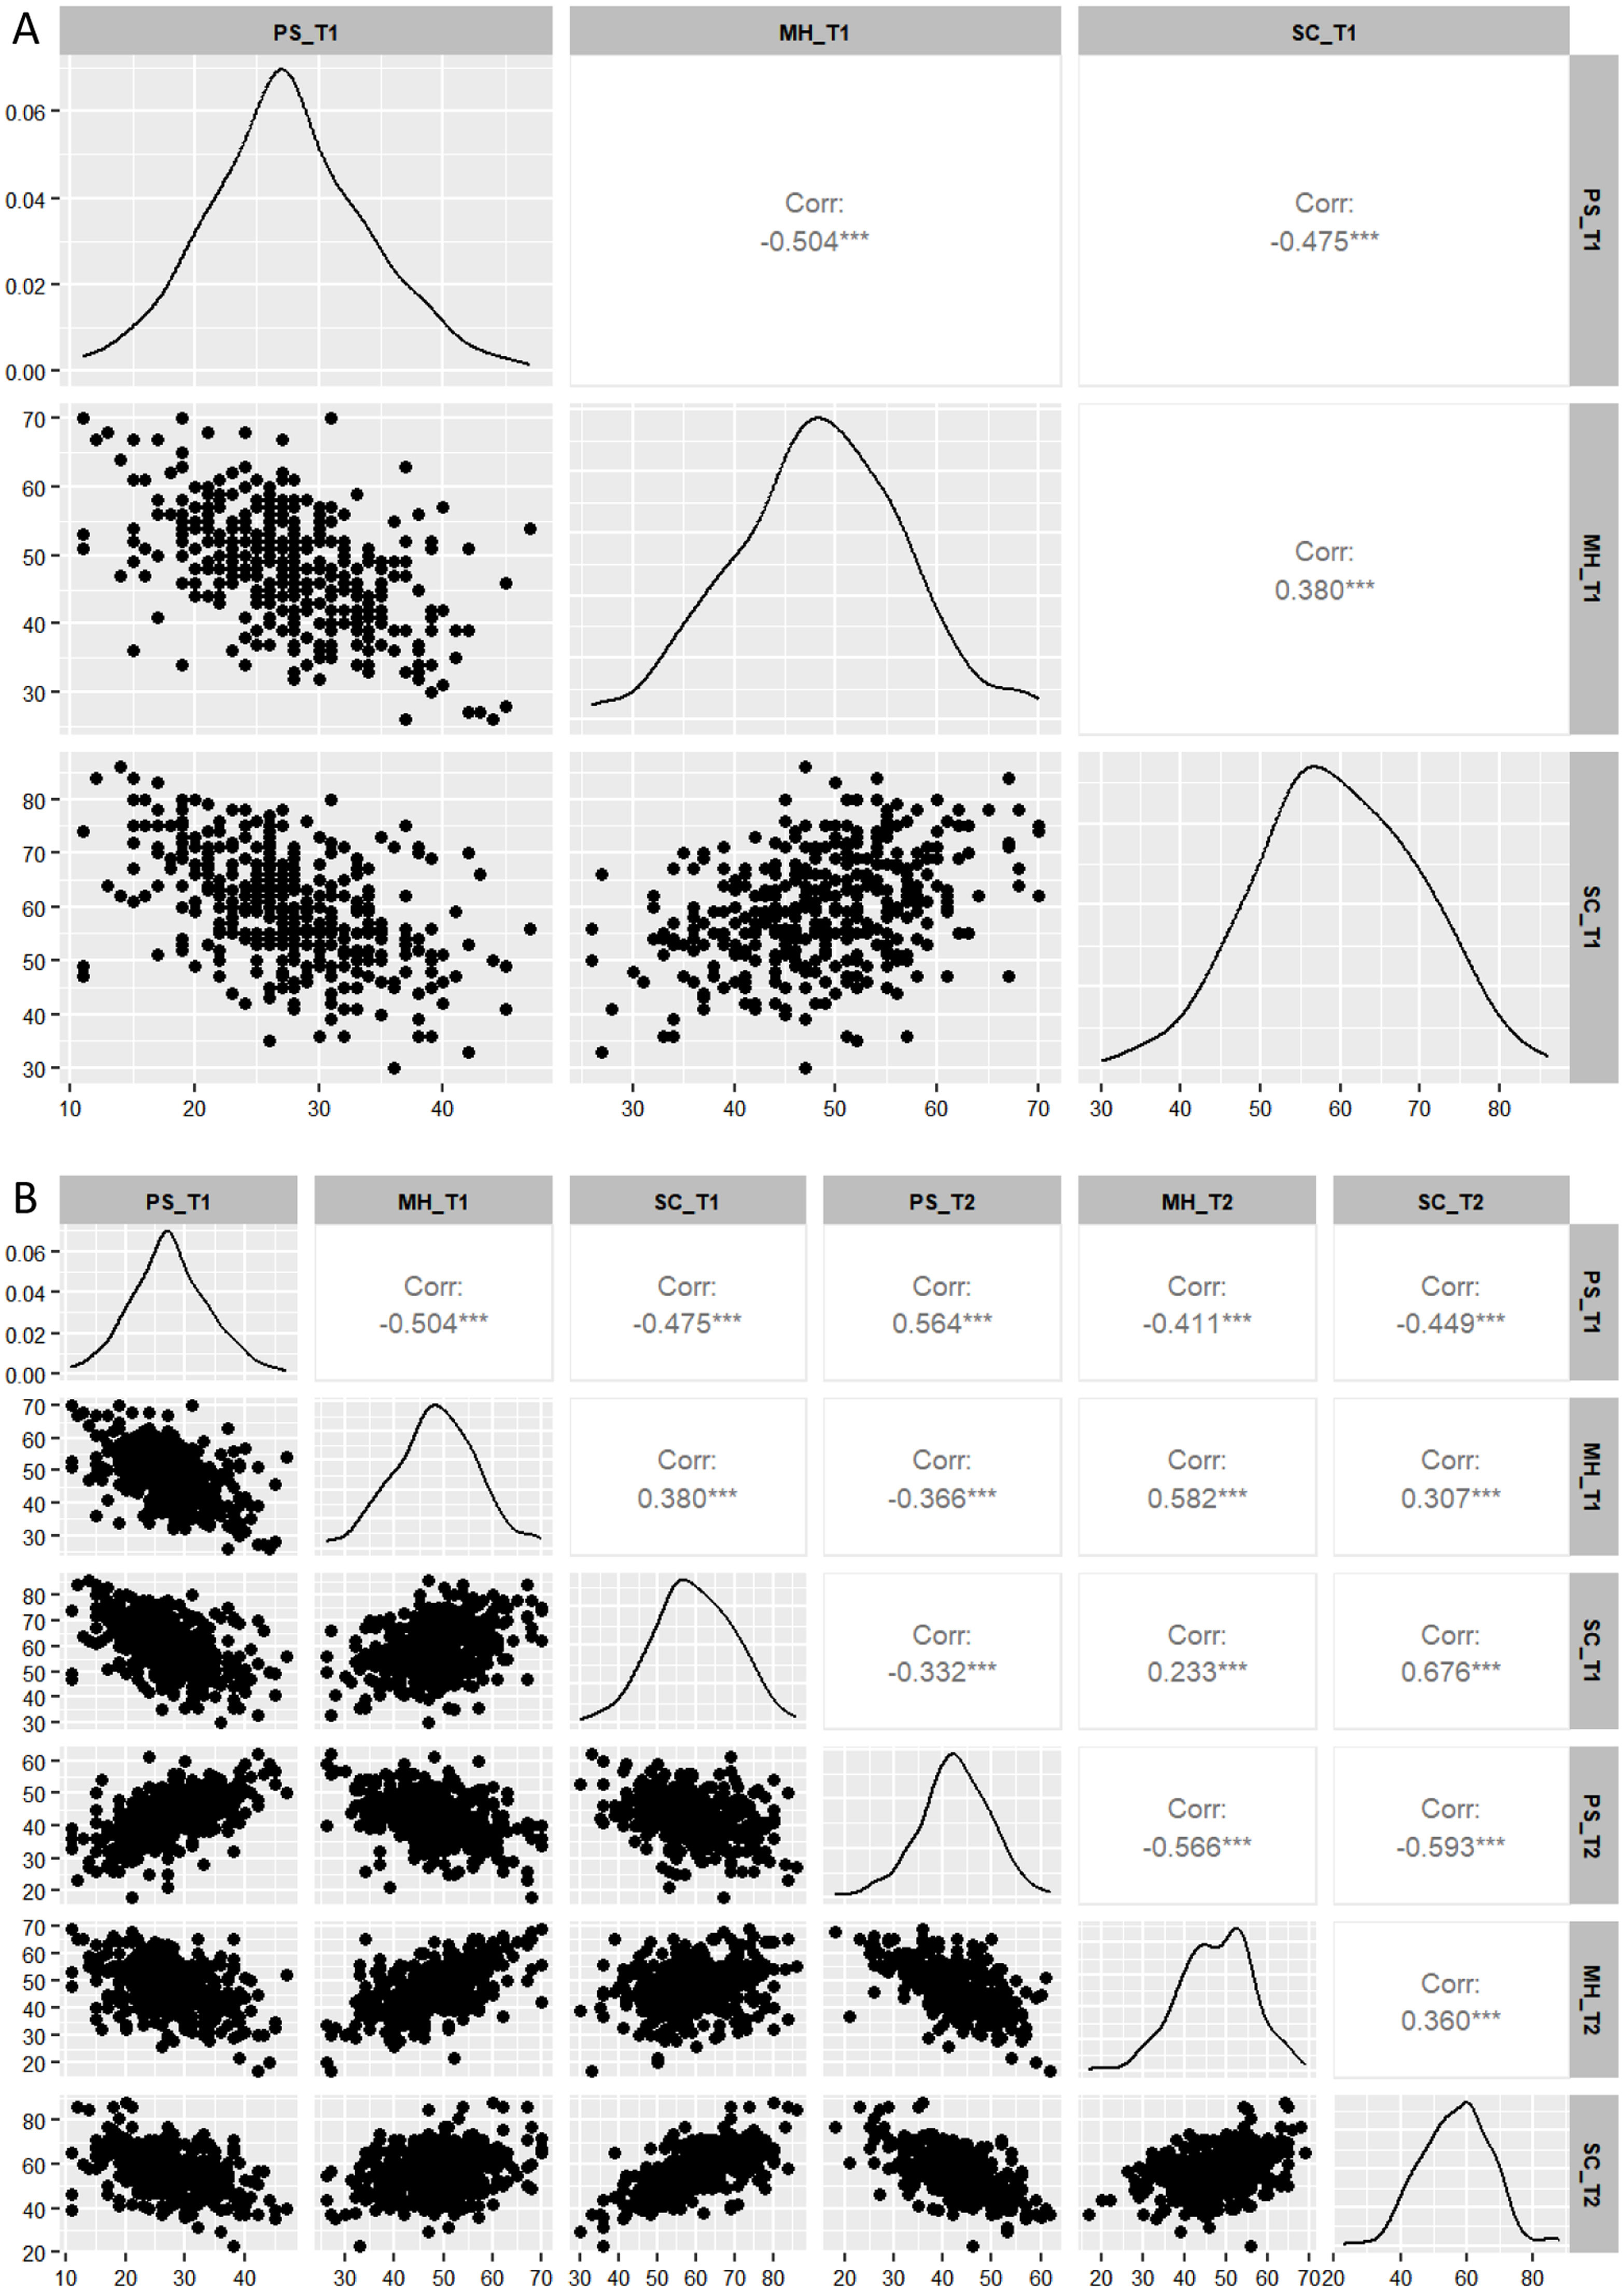
Correlation analysis of behavioral variablesThe correlation analysis results between behavioral variables for BBX (Fig. 2A) and BL (Fig. 2B) samples are shown in Fig. 2. In the BBX sample, PS was significantly negatively correlated with MH (r = −0.504, p < 0.001) and SC (r = −0.475, p < 0.001). MH was positively correlated with SC (r = 0.380, p < 0.001). In the BL sample, PS at T1 was significantly negatively correlated with both MH (r = −0.504, p < 0.001) and SC (r = −0.475, p < 0.001) at T1. PS at T1 was positively correlated with PS at T2 (r = 0.564, p < 0.001), and negatively correlated with MH (r = −0.411, p < 0.001) and SC (r = −0.449, p < 0.001) at T2. MH at T1 was positively correlated with SC (r = 0.380, p < 0.001) at T1, negatively correlated with PS (r = −0.366, p < 0.001) at T2, and positively correlated with both MH (r = 0.582, p < 0.001) and SC (r = 0.307, p < 0.001) at T2. SC at T1 was negatively correlated with PS (r = −0.366, p < 0.001) at T2, and positively correlated with both MH (r = 0.233, p < 0.001) and SC (r = 0.676, p < 0.001) at T2. PS at T2 was negatively correlated with both MH (r = −0.566, p < 0.001) and SC (r = −0.593, p < 0.001) at T2. Lastly, MH at T2 was positively correlated with SC at T2 (r = 0.360, p < 0.001).
. Figures A and B respectively depict the distribution of variable scores for the correlation analysis of BBX and BL samples, incorporating scatter plots, kernel density estimates, and partial Spearman correlation coefficients. The horizontal and vertical axes represent the scores of each variable, while the diagonal line displays the kernel density estimates, highlighting the concentration and overall distribution pattern of the data across different values. The abbreviation for partial correlation coefficient is shown as Corr. &#¿;&#¿;&#¿;p < 0.001.")
Correlation analysis of all participants at T1 and T2 (controlling for gender and age). Figures A and B respectively depict the distribution of variable scores for the correlation analysis of BBX and BL samples, incorporating scatter plots, kernel density estimates, and partial Spearman correlation coefficients. The horizontal and vertical axes represent the scores of each variable, while the diagonal line displays the kernel density estimates, highlighting the concentration and overall distribution pattern of the data across different values. The abbreviation for partial correlation coefficient is shown as Corr. &#¿;&#¿;&#¿;p < 0.001.
To investigate the influence of PS and SC at different time points on MH, this study constructed a linear mixed-effects model with MH as the response variable, and PS, SC, gender, age, and time as fixed effects variables. The residuals are evenly distributed around the zero level without any systematic patterns, and the scatter plot of residuals versus fitted values can be found in the supplementary materials (Fig. 1). The between-subject variance (SD) for the intercept was 23.4 (4.837), and the residual variance (SD) was 27.0 (5.196). These variances and standard deviations of the random effects indicate that there is some variability between individuals, but this variability is within acceptable limits. Detailed results and analysis of the residuals are provided in the supplementary materials (Table 1).
Fixed Effects parameter estimates result.
| Fixed Effects | Estimate | SE | t |
|---|---|---|---|
| Intercept | 68.161 | 6.991 | 9.750 |
| PS | −0.528 | 0.045 | −11.615 |
| SC | 0.118 | 0.031 | 3.755 |
| Gender_male | −2.550 | 0.699 | −3.648 |
| Age | −0.618 | 0.348 | −1.776 |
| Time_T2 | 7.400 | 0.751 | 9.856 |
Note: SE indicates standard error. Gender_male and Time_T2 represent the effects of gender (male) compared to the baseline gender (female), and T2 compared to the baseline T1, respectively.
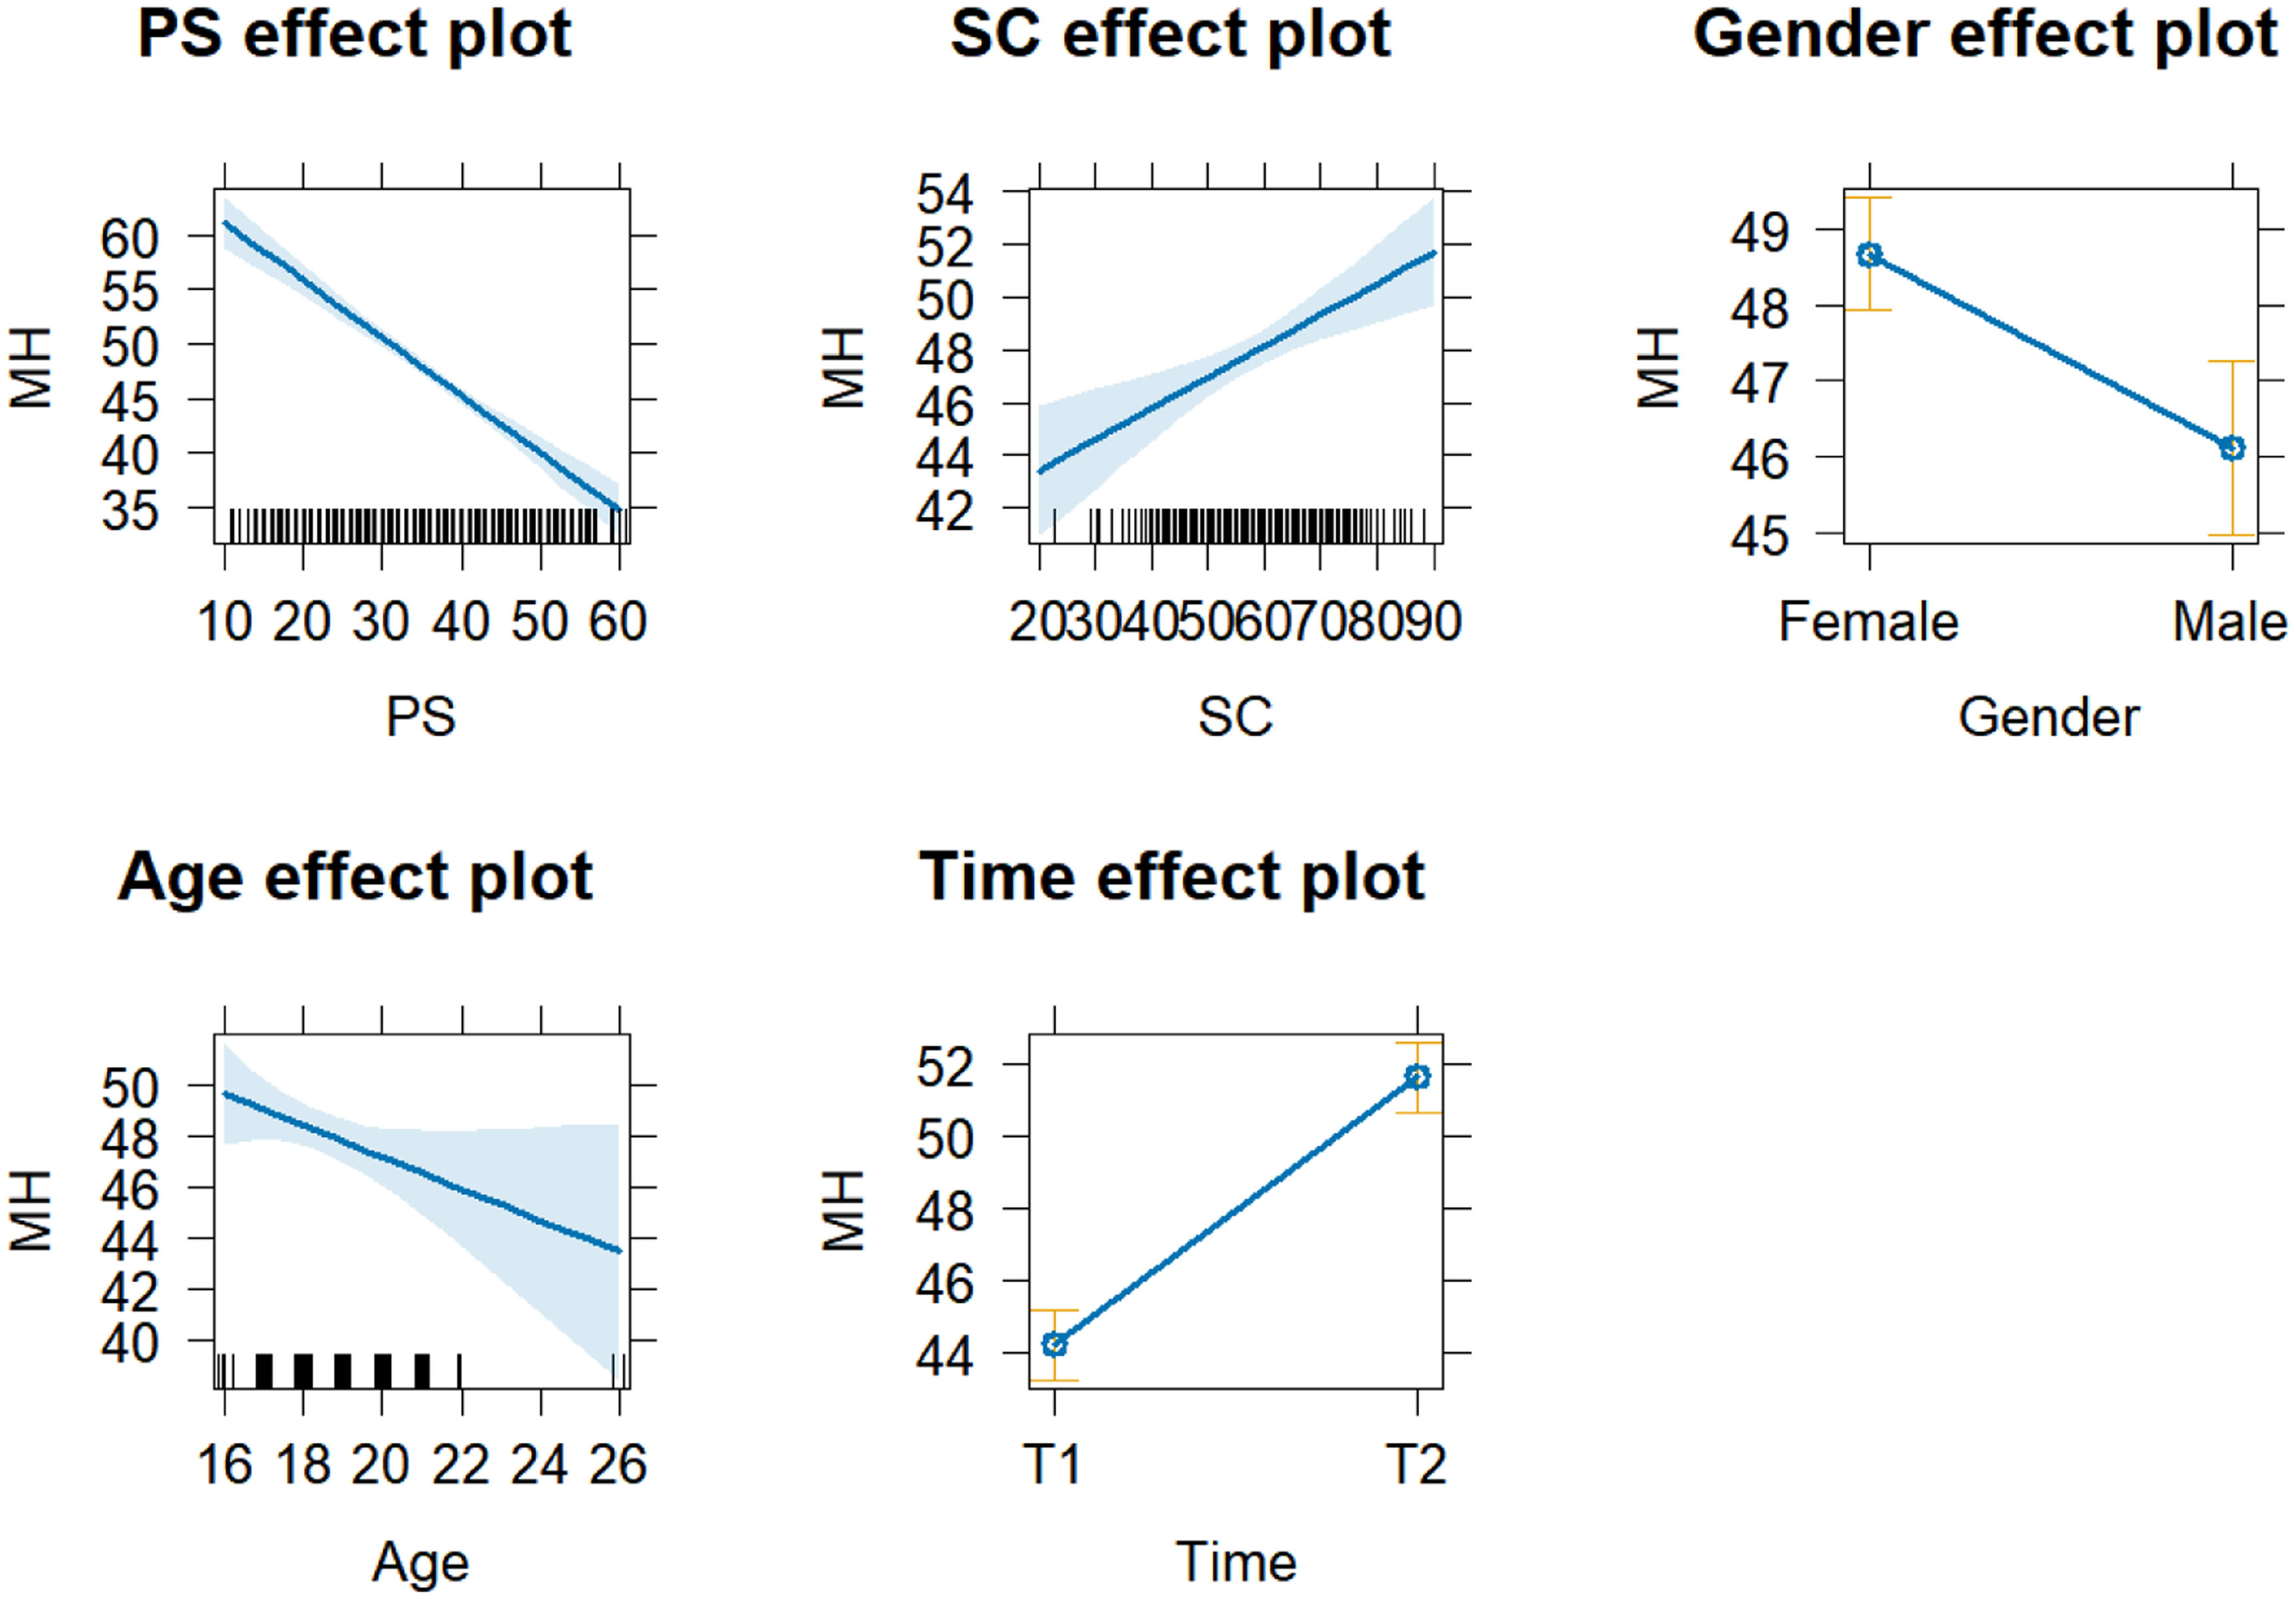
The results of the fixed effects analysis are shown in Table 1. Generally, larger t-values indicate more significant effects, with an absolute value over 1.96 commonly being significant (Luke, 2017). The results indicate that PS has a significant negative effect on MH (Estimate = −0.528, t = −11.615), meaning that for each unit increase in PS, the MH is expected to decrease by 0.528. Similarly, SC has a significant positive effect on MH (Estimate = 0.118, t = 3.755). Gender also has a significant effect on MH (Estimate = −2.550, t = −3.648), indicating that the expected MH for males is 2.55 points lower than for females. Additionally, the time factor significantly affects MH (Estimate = 7.400, t = 9.856), suggesting that the MH is expected to increase by 7.397 points at T2 compared to T1. The results of the fixed effects variables on MH are shown in Fig. 3, and the effect of gender on MH at different time points is presented in the supplementary materials (Fig. 2).
Structural equation model analysis
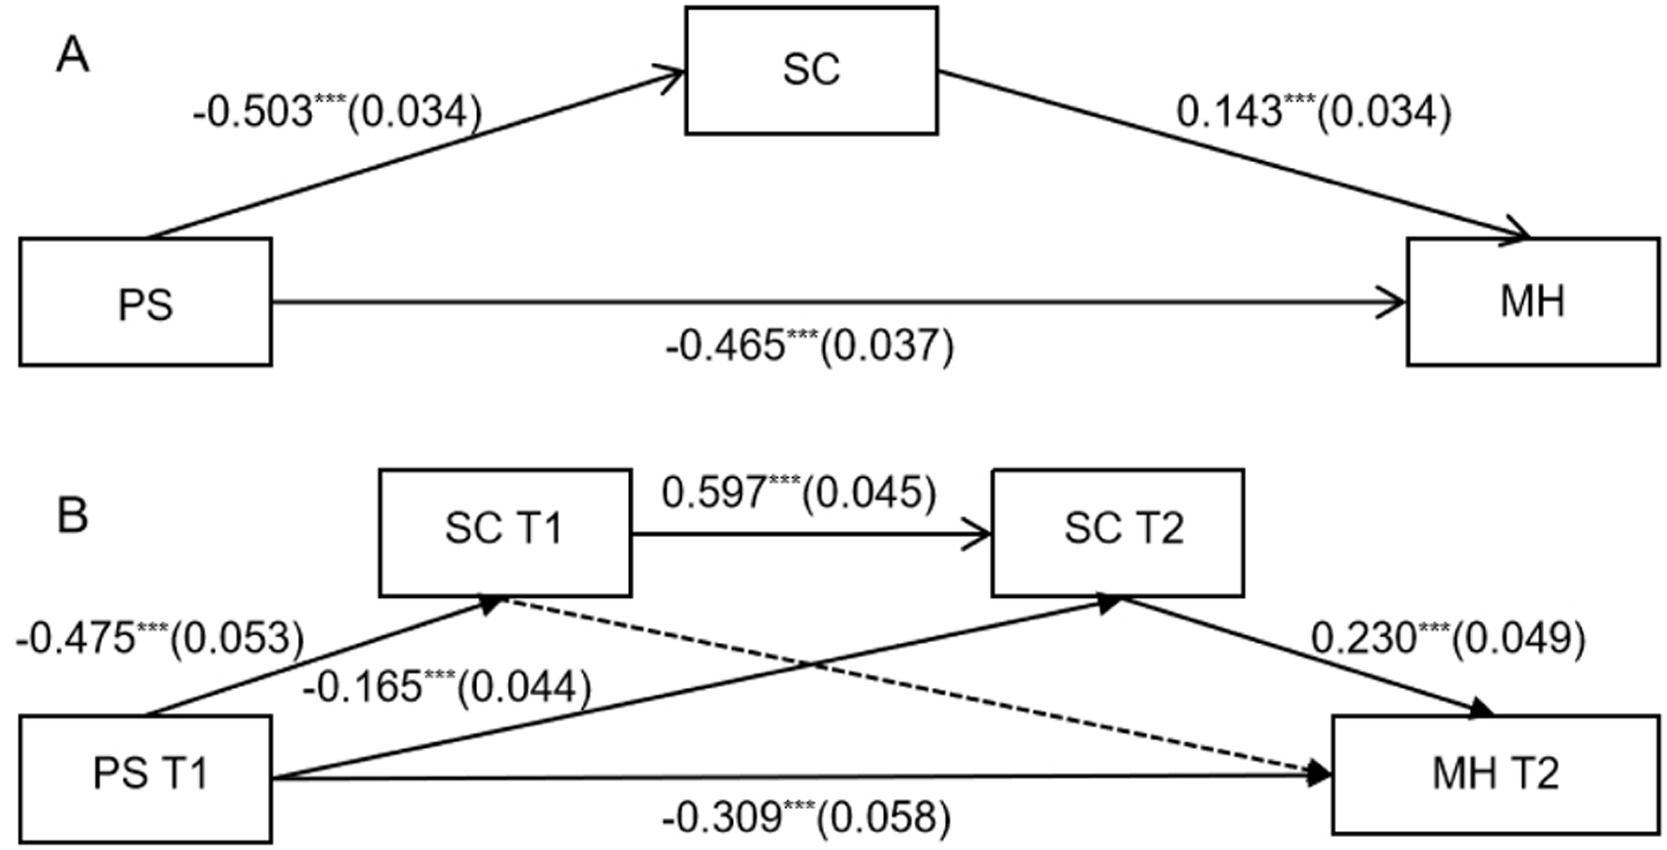
To further explore the horizontal and longitudinal relationships among various behavioral variables, this study constructed a structural equation model with MH as the outcome variable. The results indicate that SC acts as a mediating variable in the effect of PS on MH. As shown in Fig. 4, within the BBX sample (Fig. 4A), PS significantly negatively predicts SC (β= −0.503, p < 0.001), significantly negatively predicts MH (β = −0.465, p < 0.001), and significantly positively predicts MH (β=0.143, p < 0.001). The model's indirect effect (SE) is −0.072 (0.017), and the total effect (SE) is −0.537 (0.032), both ps < 0.001.
. Figure A shows a simple mediation model for the BBX samples and Figure B illustrates a chain mediation model for the BL samples. Dashed lines indicate non-significant paths. &#¿;&#¿;&#¿;p < 0.001.")
Structural Equation Models of BBX and BL Samples (gender and age as control variables). Figure A shows a simple mediation model for the BBX samples and Figure B illustrates a chain mediation model for the BL samples. Dashed lines indicate non-significant paths. &#¿;&#¿;&#¿;p < 0.001.
In the BL sample (Fig. 4B), this study extended the structural equation model from the BBX sample by including SC at different time points as mediating variables and MH at T2 as the outcome variable. The results indicate that the model's fit indices are χ2/v = 1.331, CFI = 0.996, TLI = 0.990, RMSEA = 0.030, SRMR = 0.020, demonstrating a good model fit. PSS at T1 significantly negatively predicts SC at T1(β= −0.475, p < 0.001), SC at T2 (β= −0.165, p < 0.001), and MH at T2 (β = −0.309, p < 0.001). SC at T1 significantly positively predicts SC at T2 (β= 0.597, p < 0.001), and SC at T2 significantly positively predicts MH at T2 (β = 0.230, p < 0.001). The indirect effect (SE) of the model is −0.103 (0.025), and the total effect (SE) is −0.412 (0.054), both ps < 0.001.
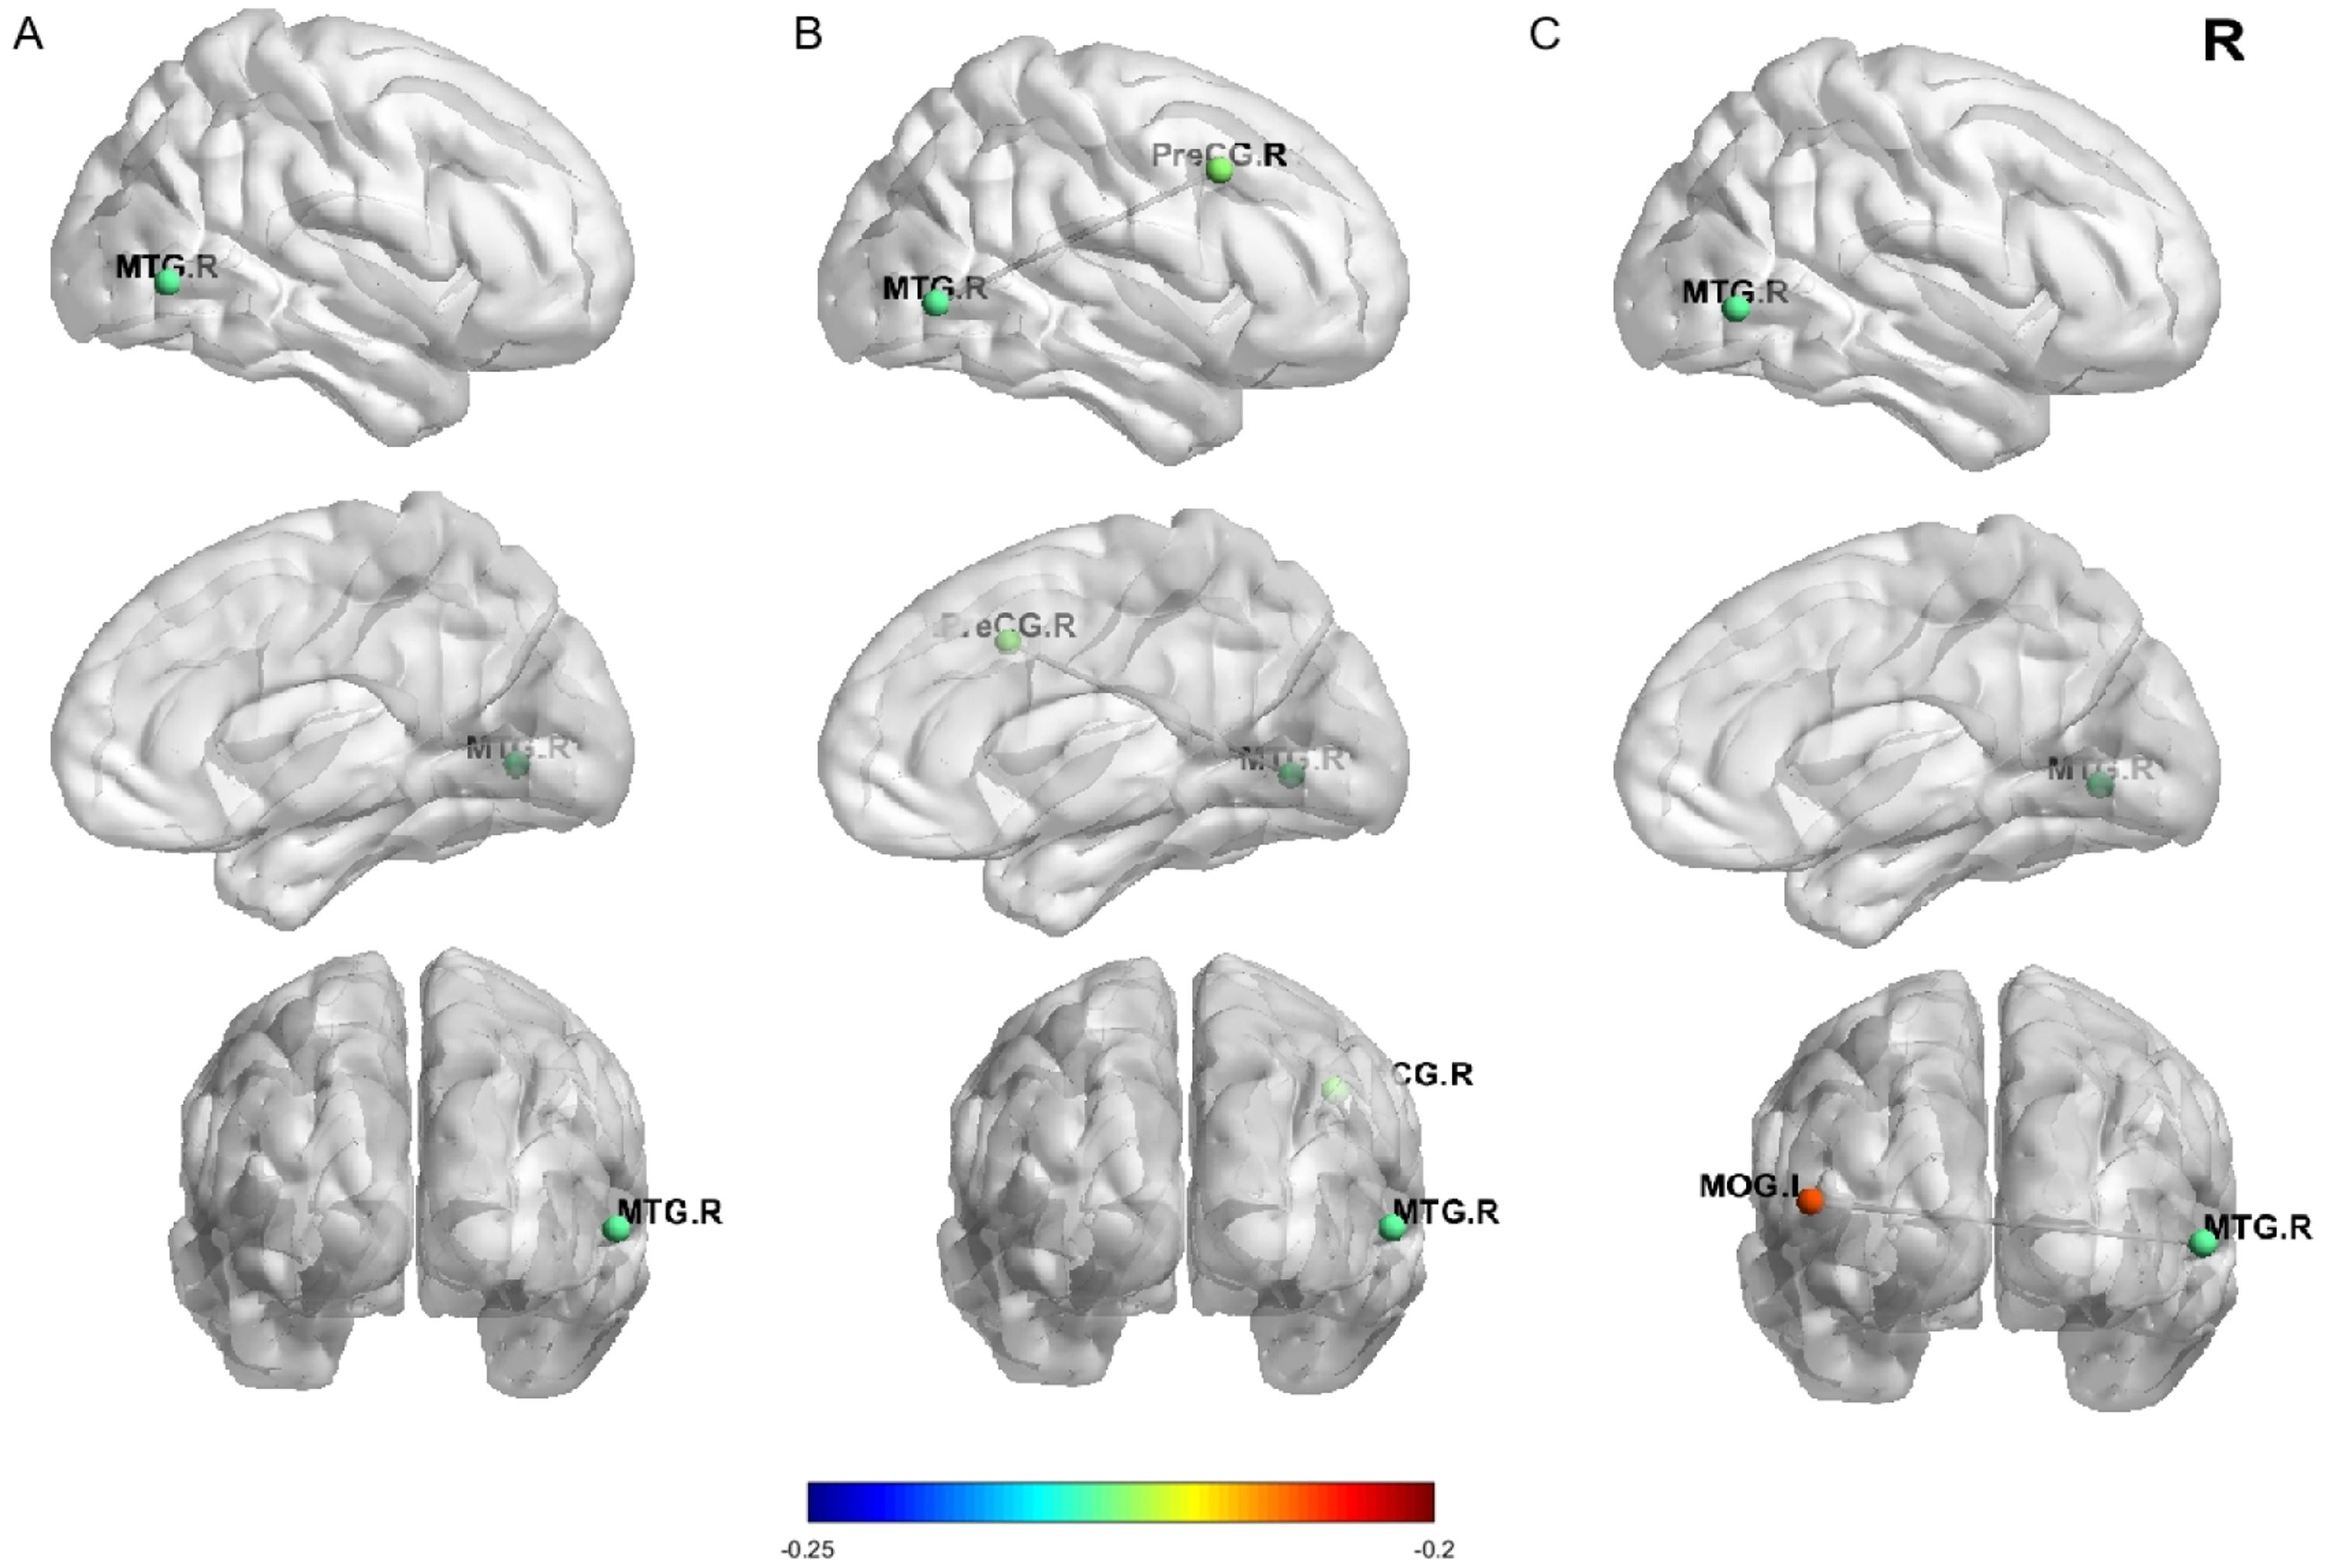
Resting-state fMRI resultsFig. 5 illustrates the brain areas where zfALFF and functional connectivity are significantly associated with behavioral variables. The results indicate that the zfALFF signals in the right middle temporal gyrus (MTG.R) are significantly negatively correlated with SC (x = 60, y = −66, z = 0, peak r = −0.227, voxels = 78), Additionally, the functional connectivity between the MTG.R and the right precentral gyrus (PreCG.R) as well as the left middle occipital gyrus (MOG.L) are significantly negatively correlated with SC (PreCG.R:x = 44, y = −6, z = 40, peak r = −0.225, voxels = 74;MOG.L:x = −48, y = −78, z = 12, peak r = −0.210, voxels = 88). These brain imaging correlations were corrected using GRF corrections (voxel p < 0.001; cluster p < 0.05).

Nodal diagram of zfALFF and functional connectivity linked to SC at T1. Figure A shows lateral, medial, and coronal views of the right-side Temporal lobe, with node colors indicating the degree of correlation between the Temporal lobe and SC. Figures B and C display lateral, medial, and coronal views of the functional connectivity between the right-side Precentral and Occipital lobes with the Temporal lobe. The colors of the Precentral and Occipital nodes indicate their functional connectivity with the Temporal lobe and their degree of correlation with SC.
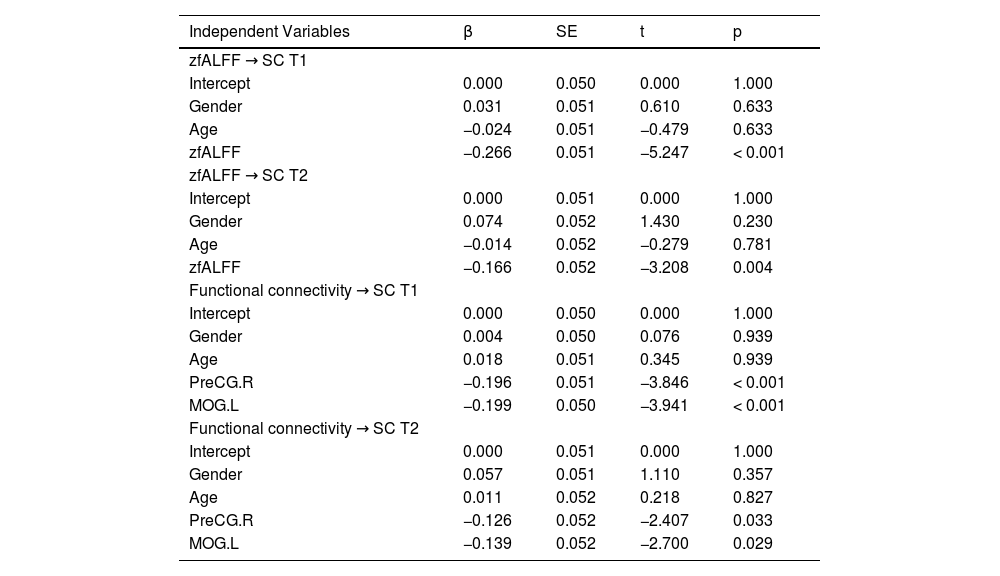
To explore the impact of zfALFF and functional connectivity on SC at different time points, this study constructed multiple linear regression models with SC at T1 and T2 as the response variables. The independent variables included gender, age, zfALFF signal, and various functional connectivity. The results are shown in Table 2. The results indicate that the zfALFF signal in the temporal region significantly negatively predicted SC at T1 (β = −0.266, p < 0.001) and T2 (β = −0.166, p = 0.004). Additionally, the functional connectivity between the temporal region and the precentral as well as the occipital regions significantly negatively predicted SC at T1 (Precentral: β = −0.196, Occipital: β = −0.199, ps < 0.001) and T2 (Precentral: β = −0.126, Occipital: β = −0.139, ps < 0.05). False discovery rate (FDR) corrections were applied for multiple comparisons. The comparison analysis between the predicted values and the actual values from the multiple linear regression models is presented in the supplementary materials (Fig. 3).
Multiple linear regression analysis of zfALFF and functional connectivity as predictors of SC at T1 and T2.
Note. β represents the standardized regression coefficient, and SE represents the standard error.
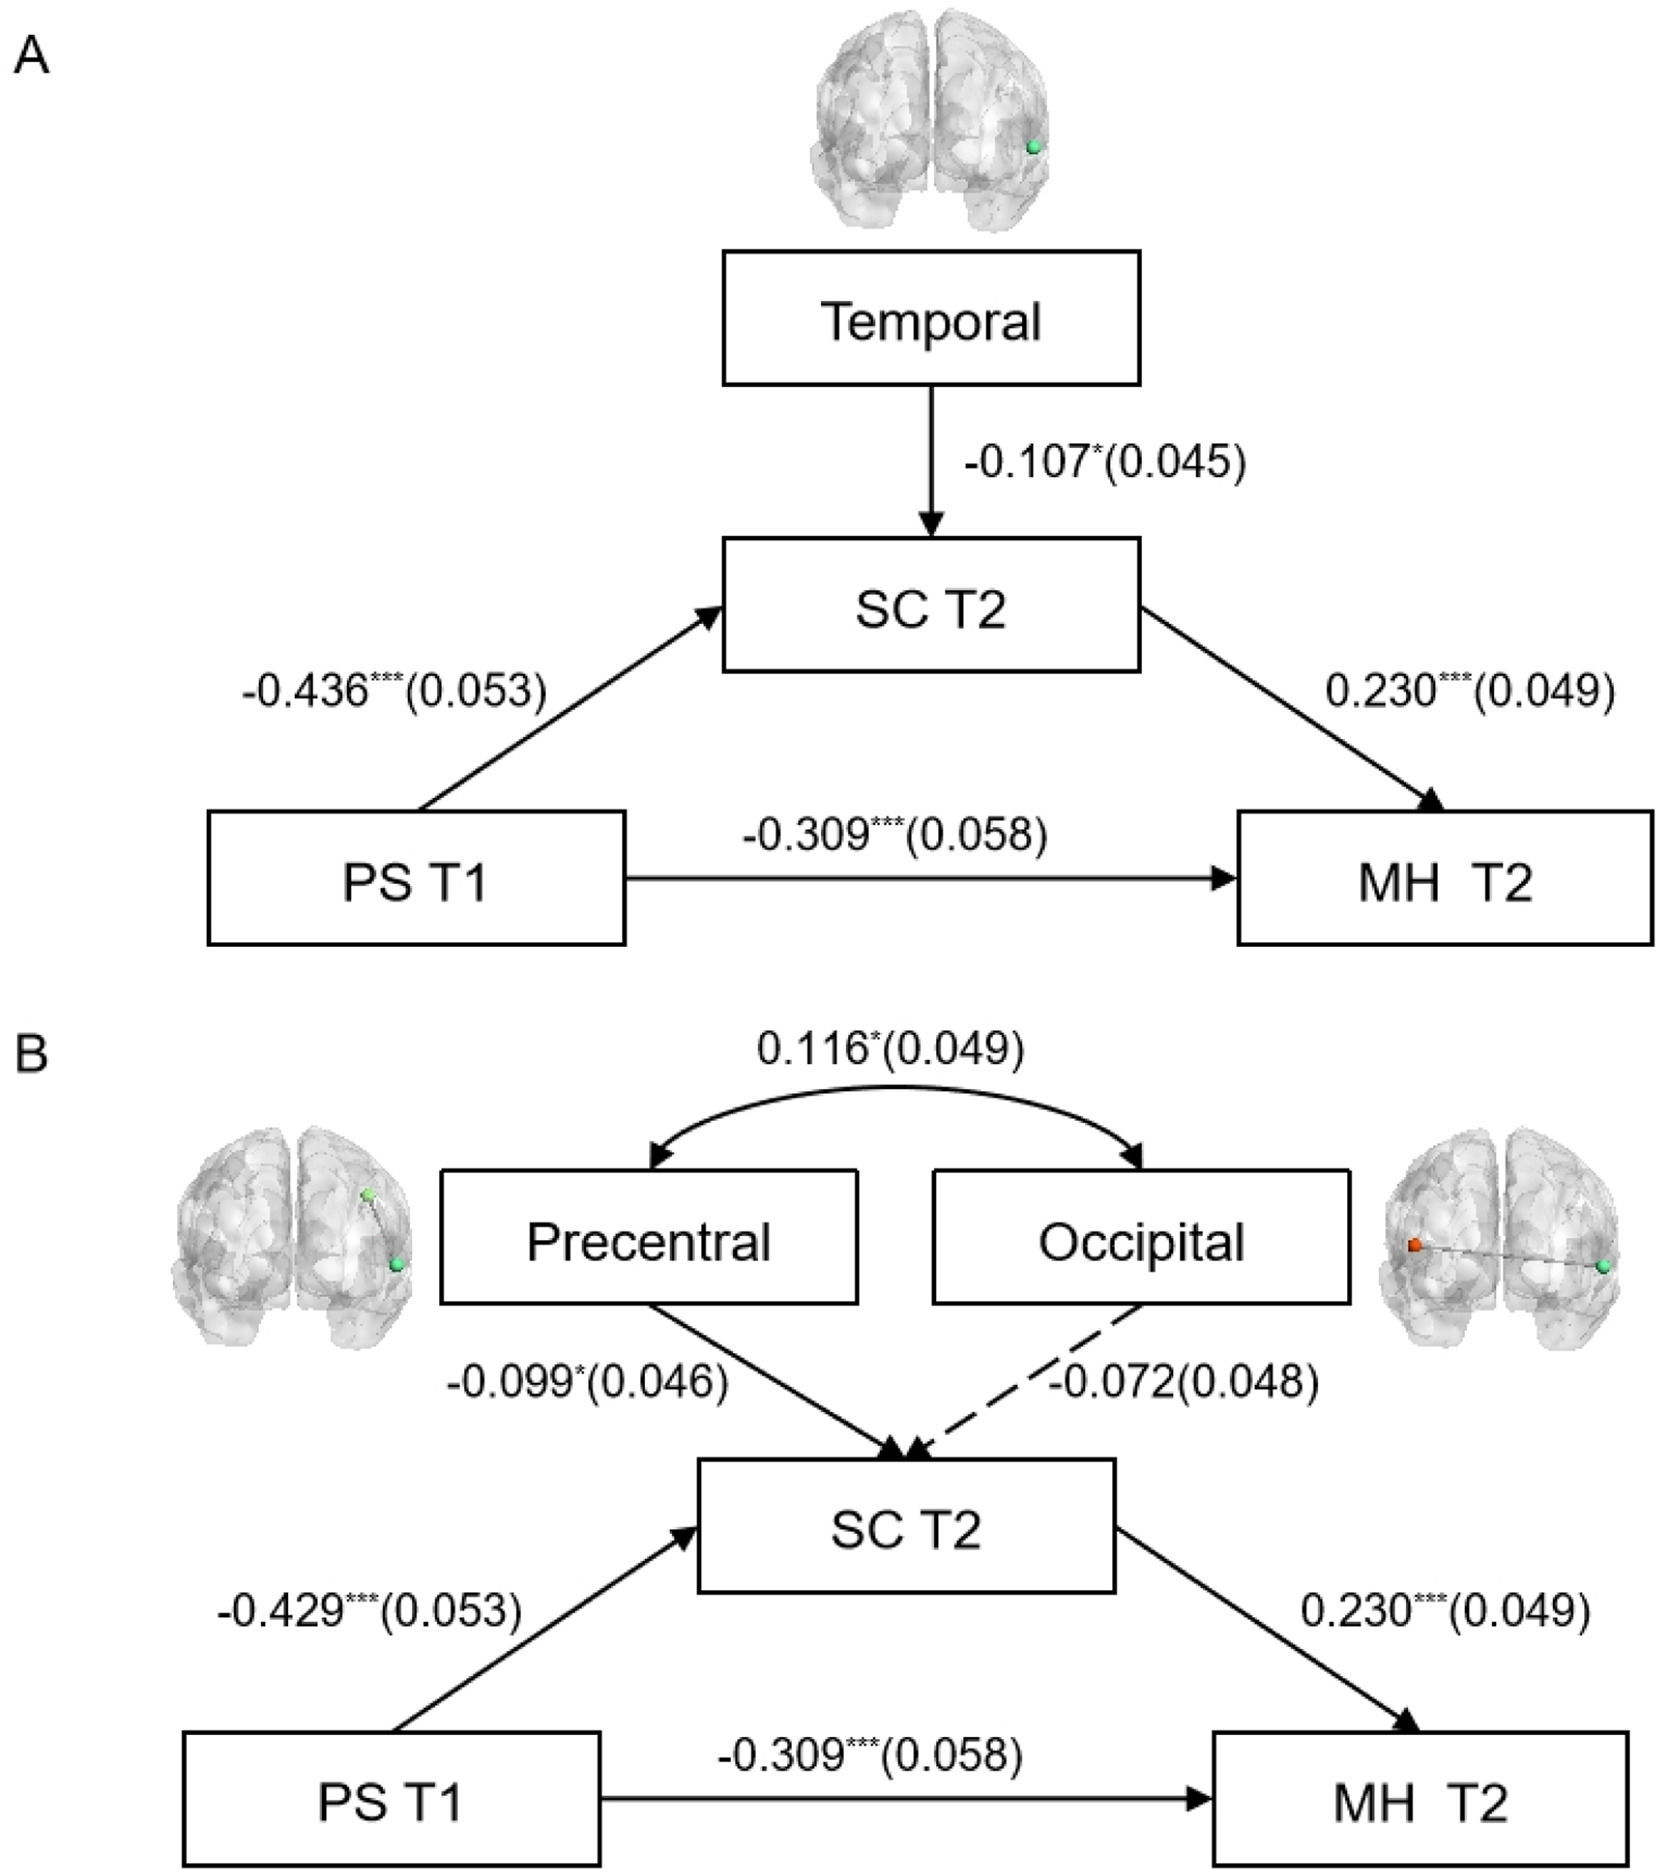
To further explore the impact of zfALFF and functional connectivity on the mediating variable (SC), this study constructed models based on the behavioral structural equation model, as shown in Fig. 6. The results indicate that in the structural equation model of zfALFF and behavioral variables (Fig. 6A), the fit indices were as follows: χ2/v = 1.223, CFI = 0.996, TLI = 0.989, RMSEA = 0.024, SRMR = 0.024, indicating a good model fit. The zfALFF signal in the temporal region significantly negatively predicted SC at T2 (β = −0.107, p < 0.05). Additionally, PS at T1 significantly negatively predicted SC at T2 (β = −0.436, p < 0.001), and significantly negatively predicted MH at T2 (β = −0.309, p < 0.001). In turn, SC at T2 significantly positively predicted MH at T2 (β = 0.230, p < 0.001). The indirect effect (SE) was −0.100 (0.025), and the total effect (SE) was −0.409 (0.054), both ps < 0.001.
. Figure A and Figure B respectively illustrate the impact of Temporal zfALFF and functional connectivity between the Precentral and Occipital lobes and the Temporal on the mediator variable (SC T2). Dashed lines indicate non-significant paths. *p < 0.05, &#¿;&#¿;&#¿;p < 0.001.")
Structural equation model of zfALFF and functional connectivity impacting SC at T2 (gender and age as control variables). Figure A and Figure B respectively illustrate the impact of Temporal zfALFF and functional connectivity between the Precentral and Occipital lobes and the Temporal on the mediator variable (SC T2). Dashed lines indicate non-significant paths. *p < 0.05, &#¿;&#¿;&#¿;p < 0.001.
In the structural equation model of functional connectivity and behavioral variables (Fig. 6B), the fit indices were: χ2/v = 2.51, CFI = 0.916, TLI = 0.907, RMSEA = 0.064, SRMR = 0.056, indicating a good model fit. The functional connectivity between the precentral and temporal regions significantly negatively predicted SC at T2 (β = −0.099, p < 0.05). Additionally, PS at T1 significantly negatively predicted SC at T2 (β = −0.429, p < 0.001) and significantly negatively predicted MH at T2 (β = −0.309, p < 0.001). SC at T2 significantly positively predicted MH at T2 (β = 0.230, P < 0.001). The indirect effect (SE) was −0.098 (0.025), and the total effect (SE) was −0.407 (0.054), both ps < 0.001.
DiscussionThe present study explored the relationships and neural bases of perceived stress, self-control, and mental health in college students using cross-sectional and longitudinal data. The key findings showed perceived stress negatively impacted later self-control, while later self-control positively predicted later self-control and mental health, with the mediation model being significant. Notably, the zfALFF signals in the right temporal lobe significantly negatively predicted self-control, thereby substantiating the role of temporal lobe response in influencing trait self-control. Furthermore, the results of the structural equation model for behavior and the brain demonstrated that the functional connectivity between the right temporal lobe and the right precentral gyrus showed significant negative correlations with self-control. These findings suggest that self-control plays a crucial role in mitigating the negative impact of perceived stress on mental health. Additionally, stronger self-control is linked to lower response in brain regions associated with emotion regulation and motor control, demonstrating the important connections between self-control and brain function.
This study found that perceived stress has a negative relationship with both self-control and mental health, and that self-control is negatively related to mental health issues, which is consistent with previous research (Lara-Cabrera, Betancort, Muñoz-Rubilar, Rodríguez Novo & De las Cuevas, 2021; Li et al., 2020; Peng et al., 2022; Zhang et al., 2022a). From a psychological perspective, stress is believed to weaken an individual's coping mechanisms, making them more susceptible to negative emotional states such as anxiety and depression (Lazarus, 1984). This may be because perceived stress depletes psychological resources, such as temporarily impairing self-control, which reduces an individual's ability to effectively cope with adverse life events and increases the likelihood of emotional distress (Baumeister, Vohs & Tice, 2007; Gao et al., 2021). From a physiological perspective, chronic perceived stress activates the hypothalamic-pituitary-adrenal (HPA) axis, leading to sustained elevations in cortisol, this can cause structural changes in brain regions such as the hippocampus, amygdala, and prefrontal cortex, affecting emotional regulation and cognitive function (Lupien, McEwen, Gunnar & Heim, 2009; McEwen, 2007). Previous studies have also shown that high cortisol levels are significantly associated with mental health issues such as depression, anxiety, and fear (Stetler & Miller, 2011; Zorn et al., 2017).
In terms of the role of self-control in the relationship between perceived stress and mental health, this study found that the mediating effect of self-control is significant. Self-control helps individuals cope with stress more effectively. Individuals with higher levels of self-control are more likely to use positive coping strategies (Connor-Smith, Compas, Wadsworth, Thomsen & Saltzman, 2000), thereby mitigating the negative impact of stress on mental health. In emotionally distressing situations, those with high self-control are better able to employ constructive strategies, such as planning and positive coping, to handle stressful situations (Tice, Bratslavsky & Baumeister, 2018). Self-control can make a positive contribution to well-being by avoiding and managing motivational conflicts, thus promoting mental health (Hofmann, Luhmann, Fisher, Vohs & Baumeister, 2014). Therefore, self-control is evidently an important buffer factor between perceived stress and mental health. Additionally, early levels of stress may serve as a negative predictor of subsequent self-control(Jeong et al., 2019). This study found that perceived stress at T1 negatively predicted self-control at T2, while self-control at T2 positively predicted mental health, further confirming the above claims. Specifically, high perceived stress early on can weaken self-control later, thus further impacting individuals' mental health. For example, individuals who experience high stress for an extended period might gradually feel exhausted and lose their ability to effectively manage time and tasks, which could lead to a decrease in self-control and, consequently, affect their mental health (Ganster & Rosen, 2013).
The study's behavioral and neural model ultimately found that the zFALFF of the right MTG and its functional connectivity with the right PreCG both negatively predicted self-control, which were intriguing findings. Insights emerging from mapping intrinsic brain connectivity networks provide a potentially mechanistic framework for an understanding of aspects of human behavior (Cheng et al., 2024; Mo et al., 2024; Zhang et al., 2024). ALFF and functional connectivity in resting-state fMRI reflect the brain's intrinsic activity and inter-regional cooperation during rest (Biswal, Zerrin Yetkin, Haughton & Hyde, 1995; Fox & Raichle, 2007). The MTG is part of the DMN, which is active during rest and is associated with self-reflection, emotional processing, and autobiographical memory (Buckner et al., 2008; Raichle et al., 2001). When the DMN shows higher spontaneous activity at rest, individuals may have lower self-control scores. This might be because excessive spontaneous activity in the DMN is associated with too much introspection or emotional rumination (Sheline et al., 2009), which can interfere with an individual's performance when focus and self-control are needed. Moreover, the resting-state activity level of the MTG might indicate an individual's intrinsic tendency toward emotional or self-referential information, which could influence emotional responses and regulation strategies in actual negative emotional situations (Yue, Zhao & Fu, 2021; Zhang et al., 2022b), thereby impairing the individual's self-control ability. The PreCG is typically regarded as a region associated with motor control functions (Banker & Tadi, 2019). Strong connectivity between the MTG and the PreCG may suggest that activity in the MTG has a significant impact on the functioning of the PreCG. Since the middle temporal gyrus is involved in processing emotion-related information, this influence might disrupt the motor control functions of the PreCG (Hajcak et al., 2007), thus hindering the PreCG's ability to effectively carry out its tasks and consequently weakening self-control.
The study offers valuable insights by suggesting that clinical neuroregulation strategies targeting the MTG and PreCG may enhance self-control, thereby improving mental health. Additionally, techniques such as mindfulness training or cognitive behavioral strategies may help mitigate the negative effects of perceived stress by reducing excessive introspection and improving emotional regulation. This study has several limitations. First, resting-state fMRI cannot capture brain activation states while participants are performing tasks related to self-control. This limitation may lead to an incomplete understanding of the dynamic brain changes during specific task contexts. Therefore, integrating task-based fMRI could provide a more comprehensive perspective, allowing us to more accurately assess brain activity related to self-control. Secondly, the study's sample consisted only of college students and did not include participants with impaired self-control abilities, which may limit the generalizability and applicability of the findings. Future research should consider more diverse samples, including individuals from different age groups and with varying levels of self-control, to ensure the findings are applicable across broader demographics. Lastly, the brain-related findings in this study require validation in larger samples and diverse populations to ensure robustness and generalizability. Confirming these neural mechanisms' validity and reliability across broader contexts will strengthen the study's impact.
ConclusionIn conclusion, this study offers valuable insights into the interplay between perceived stress, self-control, mental health, and associated brain response among college students. We found that higher perceived stress negatively impacts mental health, while self-control acts as a protective factor. Brain imaging revealed significant associations between zfALFF signals in the temporal region and functional connectivity between the precentral and temporal regions, highlighting the neurobiological basis of these interactions. Our research enhances understanding of the mechanisms linking perceived stress, self-control, and mental health, providing insights for practical interventions. The findings emphasize the need for targeted strategies to reduce perceived stress and improve self-control, ultimately promoting better mental health outcomes for college students.
Funding sourcesThis work was supported by research grants from the National Natural Science Foundation of China (31972906; 32300859), Fundamental Research Funds for the Central Universities (SWU2209235), the Innovation Research 2035 Pilot Plan of Southwest University (SWUPilotPlan006), and the Open Research Fund of the State Key Laboratory of Cognitive Neuroscience and Learning (CNLZD2102).
CRediT authorship contribution statementJingzhen He: Conceptualization, Formal analysis, Methodology, Writing – original draft, Writing – review & editing. Shaoyu Tu: Conceptualization, Methodology. Haichao Zhao: Conceptualization, Methodology. Qinghua He: Conceptualization, Data curation, Funding acquisition, Methodology, Writing – review & editing.
