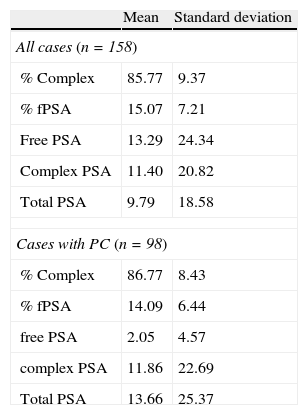
To compare the behaviour of the PSAcomplex/PSAtotal percentage (PSAc%) against the PSA free/PSA total (PSAl%) and analyse both markers for their usefulness in diagnosing prostate cancer.
Material and methodsWe measured total PSA (PSAt), free PSA (PSAl), complex PSA (PSAc), PSAl% and PSAc% levels in 158 patients. Of these, 98 (62%) were biopsied for presenting PSAt≥3ng/dl and PSAl%<20, PSAt>10, suspicious rectal examination or suspicious ultrasound node. We performed linear regression and Passing–Bablok regression analyses. The ROC curves were calculated to study the sensitivity and specificity of PSAl% and PSAc% and were compared to each other. The prostate cancer diagnoses were analysed by PSAl% and PSAc% by applying the χ2 test.
ResultsThe correlation coefficient (r) was good (0.7447, p<.0001), and the index of determination (r2) was 0.5. The result of the Passing–Bablok analysis was a slope of 1.658 (1.452–1.897) and an intersection of 2.044 (−0.936 to 5.393). The optimal cutoff for PSAl% (≤14.7854) showed a sensitivity of 89.29% [95% CI, 0.642–0.823] and a specificity of 54.29% (95% CI, 0.642–0.823). The optimal cutoff for PSAc% (>89.7796) had a sensitivity of 71.43% (95% CI, 0.616–0.802) and a specificity of 71.43% (95% CI, 0.616–0.802). There were no significant differences when comparing the areas under the curve of both markers (p=.59). The PPV of PSAl% was less than that of PSAc% (45.7% vs. 71%).
ConclusionThere was a good correlation between PSAl% and PSAc%. PSAc% has demonstrated greater specificity and efficacy than PSAl% in the diagnosis of prostate cancer.
Comparamos el comportamiento del cociente PSA complex/PSA total porcentual (PSAc%) frente al cociente PSA libre/PSA total (PSAl%) y analizamos ambos marcadores en su utilidad para el diagnóstico del cáncer de próstata.
Material y métodosSe midieron los niveles de PSA total (PSAt), PSA libre (PSAl), PSA complex (PSAc), PSAl% y PSAc% en 158 pacientes. Noventa y ocho (62%) fueron biopsiados si presentaban PSAt≥3ng/dl y PSAl%<20, PSAt>10, tacto rectal sospechoso o nódulo ecográfico sospechoso. Se realizó un análisis de regresión lineal y de regresión Passing-Bablock. Se calcularon las curvas ROC para estudiar la sensibilidad y especificidad del PSAl% y PSAc% y se compararon entre ellas. Se analizaron los diagnósticos de cáncer de próstata por el PSAl% y el PSAc% aplicando el test χ2.
ResultadosEl coeficiente de correlación (r) fue bueno, 0.7447 (p < 0,0001) y el índice de determinación (r2) fue de 0.5. El resultado del análisis Passing-Bablock fue una pendiente de 1.658 (1.452 a 1.897) e intersección de 2.044 (−0,936 a 5.393). El punto de corte óptimo de PSAl%, ≤ 14.7854, mostró una sensibilidad del 89,29% (IC 95%; 0,642-0,823) y una especificidad del 54,29% (IC 95%; 0,642-0,823) y el punto de corte óptimo de PSAc%, > 89.7796, una sensibilidad del 7143% (IC 95%; 0,616-0,802) y una especificidad del 71,43% (IC 95%; 0,616-0,802). No hubo diferencias significativas al comparar las áreas bajo la curva de ambos marcadores (p = 0,59). El VPP del PSAl% fue menor respecto al PSAc% (45,7% vs 71%).
ConclusiónExiste una buena correlación entre el PSAl% y PSAc%. El PSAc% ha demostrado una mayor especificidad y eficacia que el PSAl% en el diagnóstico del cáncer de próstata.
Artículo
Comprando el artículo el PDF del mismo podrá ser descargado
Precio 19,34 €
Comprar ahora


