Recent studies have proposed that FXYD3 and KRT20 mRNA quantified by quantitative reverse transcription polymerase chain reaction (qRT-PCR) in paraffin could be biomarkers to detect lymph nodes with micrometastases that avoid detection by conventional analysis with hematoxylin–eosin (HE). A validation study was conducted on the lymph nodes of patients who underwent radical cystectomy.
ObjectiveTo classify the adenopathic state of a sample of patients who underwent cystectomy, based on the lymph node expression of FXYD3 and KRT20. The secondary objective was to assess whether there is a differential oncologic evolution for the patients, depending on the lymph node expression of these proteins.
Material and methodThe study included lymph nodes from 64 patients who underwent cystectomy for infiltrating bladder tumor: The model was developed using metastatic lymph nodes from 15 patients and lymph nodes from four patients with no known tumor. Genetic expression was measured using real-time qRT-PCR. We calculated (using qRT-PCR) the median expression of FXYD3 and KRT20 mRNA in the lymph node tissue. We then analyzed the receiver operating characteristic (ROC) curves, according to the function y=0.1400+0.250FXYD3−2.532. The cutoff was established using an ROC curve. The formula was applied to the remaining lymph node tissue, based on the previously established cutoff. The sample was classified into four subgroups: HE− qRT-PCR−, HE− qRT-PCR+, HE+ qRT-PCR+ and HE+ qRT-PCR−. A descriptive, comparative analysis was performed, as well as a metastatic progression-free survival analysis, calculating the Kaplan and Meyer curves for the three established subgroups. The test results were considered statistically significant at p<0.05.
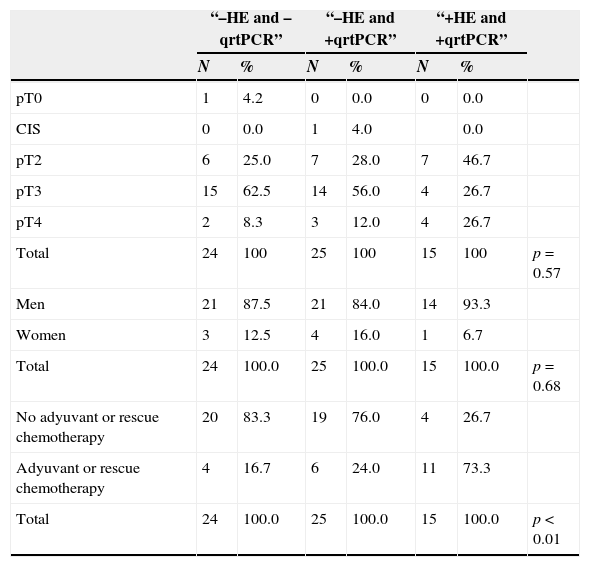
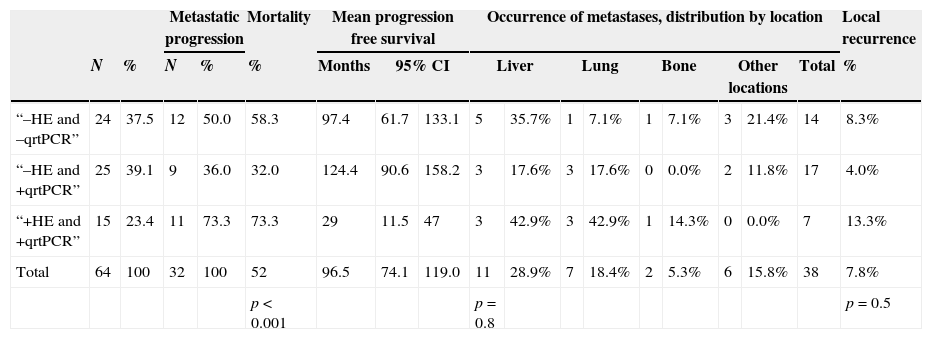
ResultsUsing qRT-PCR, we verified that there were differences in the median expression of FXYD3 (p=0.05) and KRT20 (p=0.009) between the lymph node tissues of patients with benign prostate hyperplasia and those of patients with lymph node metastasis. A cutoff was assigned to 0.377. The sample was classified as follows: 37.5% of the patients were pN0 by HE and pN0 by qRT-PCR (−HE −qRT-PCR), 39.1% were pN0 by HE but metastatic by qRT-PCR (−HE +qRT-PCR), and 15 patients (23.4%) were metastatic by both techniques (+HE +qRT-PCR). The Kaplan and Meyer curves showed poorer metastatic progression-free survival for the patients who were +HE and +qRT-PCR than for the other subgroups, with no significant differences between −HE +qRT-PCR and −HE −qRT-PCR.
ConclusionsAccording to our results, 39.1% of the patients with infiltrating vesical tumors overexpressed the FXYD3 and KRT20 biomarkers and were N0 by HE. We observed no differential clinical behavior among the patients who underwent cystectomy according to their expression of FXYD3 and KRT20 when they were N0 by HE.
Recientes estudios han propuesto que los ARNm FXYD3 y KRT20 cuantificados por qrtPCR en material parafinado podrían ser biomarcadores capaces de detectar los ganglios portadores de micrometástasis que se escapaban al análisis convencional por hematoxilina–eosina (HE). Se decidió hacer un estudio de validación en ganglios de pacientes a los que se les practicó una cistectomía radical.
ObjetivoClasificar el estado adenopático de una muestra de pacientes cistectomizados, según la expresión ganglionar de FXYD3 y KRT20. Como objetivo secundario valorar si existe una evolución oncológica diferencial de los pacientes, según la expresión ganglionar de dichas proteínas.
Material y métodoSe incluyeron ganglios linfáticos de 64 pacientes cistectomizados por tumor vesical infiltrante. El modelo se desarrolló a expensas de ganglios metastásicos de 15 pacientes y ganglios de 4 pacientes sin tumor conocido. La expresión génica se midió mediante PCR cuantitativa en tiempo real. Se calculó la expresión mediana mediante q-rtPCR de los ARNm de FXYD3 y KRT20 en el tejido ganglionar. Se continuó con un análisis de curvas ROC, según la función y=0.1400+0.250FXYD3−2.532. Se estableció el punto de corte mediante una curva ROC. Dicha fórmula se aplicó al tejido ganglionar restante; en función del punto de corte antes establecido la muestra quedó clasificada en 4 subgrupos: HE– qrtPCR–, HE– qrtPCR+, HE+ qrtPCR+ y HE+ qrtPCR–. Se procedió a un análisis descriptivo, comparativo y a un análisis de supervivencia libre de progresión metastásica, calculando las curvas de Kaplan y Meyer para los 3 subgrupos establecidos. Los test se consideraron estadísticamente significativos cuando p<0.05.
ResultadosMediante q-rtPCR se comprobó que había diferencias en la expresión mediana de FXYD3 (p=0,05) y de KRT20 (p=0,009) entre el tejido ganglionar de los pacientes con HBP y los pacientes con metástasis adenopáticas. Se asignó como punto de corte de 0.377. La muestra se clasificó en: un 37.5% de los pacientes eran pN0 por HE y pN0 por qrtPCR (–HE –qrtPCR), el 39,1% eran pN0 por HE pero eran metastásicos por qrtPCR (–HE +qrtPCR) y 15 pacientes (23,4%) eran metastásicos por ambas técnicas (+HE +qrtPCR). Las curvas de Kaplan y Meyer mostraron una peor supervivencia libre de progresión metastásica para los pacientes (+HE +qrtPCR) que para el resto de los subgrupos, no observando diferencias significativas entre (–HE +qrtPCR) y (–HE –qrtPCR).
ConclusionesSegún nuestros resultados un 39,1% de los pacientes con tumor vesical infiltrante sobreexpresarían los biomarcadores FXYD3 y KRT20, siendo N0 por HE. No observamos un comportamiento clínico diferencial de los pacientes cistectomizados según su expresión de FXYD3 y KRT20 cuando son N0 por HE.
Artículo
Comprando el artículo el PDF del mismo podrá ser descargado
Precio 19,34 €
Comprar ahora


