


A system based on the B-cell phenotype has recently been proposed to classify patients suffering from common variable immunodeficiency (CVID). Immunophenotypic T-cell abnormalities have also been correlated with clinical findings, although they have never been used in classification strategies.
ObjectiveTo simultaneously assess T and B-cell subset abnormalities in CVID patients and their relationship with clinical findings. To identify potential immunophenotypic T-cell abnormalities that could be further evaluated in multicenter studies.
Patients and MethodsPeripheral blood lymphocytes from 21 CVID patients and 21 healthy donors were stained for T and B-cell subsets, analyzed by flow cytometry, and correlated with clinical characteristics.
ResultsPatients classified as MB0 (CD19/CD27+<11 %) showed higher percentages of CD4/CD45RA− (87 % vs 67 %, p=0.028) and lower percentages of CD8/CD45RA+CCR7+ (10 % vs 26 %, p=0.028) and CD4/CD25+ T-cells (36 % vs 62 %, p=0.034) than MB2 patients. Even though our cohort was small, we observed a higher prevalence of distinct clinical complications of CVID in patients with B and T-cell abnormalities. Nonmalignant lymphoproliferative disorders and IgG hypercatabolism were more frequently observed in MB0 patients. A higher prevalence of splenomegaly was observed among CVID patients with increased levels of CD4/CD45RA−, activated CD4/CD38+DR+, CD8/DR+, and CD8/CD38+ T-cells, as well as in those with lower percentages of CD4/CD45RA+CCR7+ and CD4/CD25+ T-cells. Lymphoproliferative disorders were more prevalent among CVID patients with higher CD4/CD45RA− percentages.
ConclusionThe study of T-cell subsets warrants further evaluation as a potential tool to better identify CVID patients with distinct clinical profiles.
Common variable immunodeficiency (CVID) is a primary immunological disorder characterized by low levels of serum immunoglobulin (Ig) and impaired antibody production. The clinical manifestations of CVID include recurrent respiratory tract infection by encapsulated bacteria, autoimmunity, nonmalignant chronic lymphoproliferative disorders, enteropathy, and increased risk of cancer1. Patient management is usually difficult due to the heterogeneity of clinical symptoms attributed either to intrinsic B-cell defects or T-cell dysfunctions.
For the last six years, efforts have been made to establish a classification scheme. Some authors have proposed classifying patients based on the phenotypic characteristics of B-cells, including memory (CD27, IgD) and maturation markers (CD21low)2-5. The results of a multicenter trial (more than 300 CVID patients) performed to establish a consensus on different B-cell classification proposals have recently been published6.
Many authors describe peripheral blood T-cell dysfunctions in a substantial proportion of CVID patients7-10. Some of these abnormalities have been correlated with clinical findings and severity of symptoms11-14. In this regard, experts in the field have studied the usefulness of T-cell-based phenotyping for CVID patients and have suggested that an efficient classification of the disease should not exclude evaluation of T-cell homeostasis15,16.
Similarly, few studies have simultaneously analyzed B and T-cell subsets, an approach that might provide a more complete picture of peripheral blood lymphocyte (PBL) dynamics in these patients17,18. Thus, the aim of our study was to identify in a single-center setting potential immunophenotypic T-cell abnormalities that could be further evaluated in multicenter studies.
Materials and MethodsPatients and healthy donorsWe performed a cross-sectional study of a cohort of 21 patients diagnosed with CVID according to the criteria of the European Society for Immunodeficiencies19 (median age 40 ± 17years; range 19-79; 11 females and 10 males). A group of 21 age-matched healthy donors (HD) (median age 47 ± 11years; range 27-62; 7 females and 14 males) were included as controls.
All patients were receiving regular intravenous immunoglobulin (IVIG) replacement therapy (400mg/kg/mo). Clinical and laboratory data were collected by the same researcher from patient charts using a standardized questionnaire. All patients were regularly evaluated by the same immunologists following an established protocol.
Blood samples were collected immediately before administration of IVIG. At the time of the study, and for at least three months before, none of the patients had evidence of severe or opportunistic infections, autoimmune disease, or cancer, and were not receiving any biological therapy in addition to IVIG. All patients were negative for the Epstein Barr, human immunodeficiency, hepatitis B, and hepatitis C viruses, as assessed by serology testing and polymerase chain reaction.
Diagnosis of splenomegaly was based on clinical examination and echography or computed tomography. Nonmalignant chronic lymphoproliferative disorders included splenomegaly, lymphadenopathy, granuloma, and interstitial lymphocytic pneumonitis or unexplained liver disease with nodular regenerative hyperplasia of the liver. In this study, hypercatabolism was considered as the inability to maintain IgG levels above 600mg/dl for the last 12months of IVIG replacement therapy (with the subsequent need for higher maintenance doses of IVIG). The distribution of bronchiectasis and chronic diarrhea was the same in patients with and without IgG hypercatabolism. Autoimmune complications were diagnosed based on standard clinical and laboratory criteria as indicated. Enteropathy was considered to be associated with CVID in patients fulfilling the following conditions: recurrent episodes of diarrhea with malabsorption and no evidence of infective agents (Salmonella, Shigella, Yersinia, Campylobacter, Escherichia coli, Cryptosporidium, Cyclospora, Microsporidia, Giardia, and Clostridium difficile toxin), nodular lymphoid hyperplasia of the small intestine, villous atrophy in the absence of clinical response after gluten withdrawal, no criteria of inflammatory bowel disease (Crohn's disease or ulcerative colitis), and a negative hydrogen breath test result.
The study was performed according to the ethical guidelines of the 1975 Declaration of Helsinki and approved by our hospital research ethics committee. Informed consent was obtained from all subjects.
Cell staining and monoclonal antibodiesBlood samples were collected in ethylene diamine tetra-acetic acid (EDTA) tubes and cell surface staining was performed using different combinations of fluorochromes conjugated to monoclonal antibodies (MoAbs). Briefly, 100μl of whole blood (WB) was added to mixtures of directly conjugated MoAbs at saturating concentrations and incubated for 20min at room temperature. The erythrocytes were then lysed by addition of 2ml of lysis buffer (Facslysing solution, Becton Dickinson, San Jose, California, USA) for 15min, and washed twice with phosphate-buffered saline (PBS) before acquisition. To avoid antibody staining inhibition of membrane-bound IgM by pentameric IgM from serum, WB was washed to remove it before surface staining. One milliliter of WB was added to 9ml of PBS, vortexed, and centrifuged at 549g for 5min. The supernatant was aspirated and the cells resuspended in 9ml of PBS. This washing step was repeated. Finally, the remaining pellet was used for B-cell determinations.
To determine lymphocyte subsets, the following MoAbs were used: fluorescein isothiocyanate (FITC)-conjugated anti-CD27, CD45RA, HLA-DR, and CD56; phycoerythrin (PE)-conjugated anti-IgD, CCR7 (R&D Systems Inc., Minneapolis, MN, USA), CD38, CD25, and CD16; peridinin chlorophyll protein (PerCP)-conjugated anti-CD19, CD4, and CD3; and allophycocyanin (APC)-conjugated anti-IgM, CD8, and CD19. IgG1 and IgG2a isotypes were used as controls (except CCR7-PE, from Becton Dickinson, San Jose, California, USA).
Flow cytometric analysisAcquisition and analysis were performed on a FACSCalibur cytometer (Becton Dickinson, San Jose, California, USA) using Macintosh CellQuest Pro software. Optimal analysis required the acquisition of at least 20 000 events within a lymphocyte light-scatter gate. Different subsets are expressed as percentages of total B, CD4 or CD8 T cells. Naive B cells were established as CD19+/CD27—IgM+IgD+, non-switched memory cells as CD19+/CD27+IgM+IgD+, and class-switched memory cells as CD19+/CD27+IgM—IgD—20. Further subdivision of B-cell subsets according to expression of the CD21 marker was not included in the design of this study. In order to establish the T-cell maturation profile, CD4 and CD8 subsets were analyzed on the basis of CD45RA and CCR7 expression. CD45RA+CCR7+ characterized the naive T-cells, CD45RA—CCR7+ the T central memory (TCM) cells, CD45RA—CCR7— the T effector memory (TEM1) cells, and CD45RA+CCR7— the final effector cells (TEM2). HLA-DR, CD38, and CD25 were assessed as activation markers. The absolute lymphocyte counts for CVID patients ranged from 160 cells/μl to 5300 cells/μl and for HD from 1100 cells/μl to 3400 cells/μl.
Statistical analysisStatistical comparisons between the different groups (CVID/ HD; MB0/MB1/MB2) were made using the non-parametric Mann-Whitney U test, since most values were not normally distributed (Shapiro-Wilk test). Stratified data were expressed as the mean value for HD ± 2SD and classified variables were evaluated by Fisher's exact test to demonstrate independence from clinical parameters. Any p value below 0.05 was considered significant.
All analyses were performed using SPSS 14.0 statistical software for Windows (SPSS Inc., Chicago, Illinois, USA).
ResultsThe main clinical and phenotypic characteristics of the study patients are summarized in Table I. The most common clinical complications were chronic lymphoproliferative disorders (48 %, splenomegaly [n = 6], enlarged lymph nodes [n = 10], granuloma [n = 1], nodular regenerative hyperplasia of the liver [n = 1]) and autoimmune disease (38 %, immune thrombocytopenic purpura [n = 5], autoimmune hemolytic anemia [n = 2], inflammatory bowel disease [n = 1], autoimmune diabetes [n = 1], pernicious anemia [n = 2]). Enteropathy was observed in 33 % of patients (nodular lymphoid hyperplasia of the small intestine [n = 5] and villous atrophy [n = 4]). Hypercatabolism of IgG was demonstrated in 29 % of patients. Although the baseline IgG concentration (at the time of diagnosis of CVID) was lower in patients with IgG hypercatabolism, the difference was not significant compared with CVID patients without IgG hypercatabolism (154 ± 107 vs 230 ± 168mg/dl, p = 0.33). IgG hypercatabolism was not significantly associated with other clinical complications. Twelve patients (57 %) had more than one CVID-associated clinical complication.
Clinical and phenotypic characteristics of CVID patients
| Demographic characteristics | Absolute number of lymphocytes (106/l) and serum IgG | Clinical features | ||||||||||
| N.º | Sex | Age1 | Age2 | B3 | CD43 | CD83 | IgG4 | SP | LP | H-IgG | AI | E |
| 1 | F | 34 | 40 | 2023 | 2236 | 852 | 160 | — | + | — | + | + |
| 2 | M | 26 | 39 | 5 | 59 | 56 | 210 | + | + | + | + | + |
| 3 | M | 22 | 42 | 40 | 375 | 967 | 247 | + | + | + | — | — |
| 4 | F | 22 | 25 | 262 | 477 | 1071 | 55 | — | + | — | — | + |
| 5 | F | 64 | 69 | 114 | 304 | 233 | 358 | — | — | — | — | — |
| 6 | M | 24 | 34 | 92 | 383 | 379 | 52 | — | + | + | — | + |
| 7 | F | 64 | 75 | 631 | 1652 | 538 | 269 | — | — | — | — | — |
| 8 | F | 38 | 55 | 18 | 1000 | 410 | 245 | + | + | — | + | — |
| 9 | F | 30 | 39 | 161 | 777 | 437 | 300 | — | — | — | — | — |
| 10 | F | 28 | 38 | 144 | 655 | 186 | 34 | — | + | — | — | + |
| 11 | F | 49 | 52 | 45 | 1305 | 420 | 83 | + | + | + | + | — |
| 12 | M | 23 | 34 | 66 | 270 | 560 | 44 | — | — | + | — | + |
| 13 | F | 45 | 52 | 0 | 841 | 1711 | 438 | — | — | — | + | + |
| 14 | F | 62 | 71 | 223 | 293 | 419 | 277 | — | — | — | — | — |
| 15 | M | 60 | 71 | 81 | 493 | 253 | 441 | — | — | — | + | — |
| 16 | M | 17 | 40 | 146 | 584 | 661 | 15 | + | — | — | — | — |
| 17 | M | 14 | 19 | 364 | 643 | 528 | 33 | — | — | — | — | — |
| 18 | M | 34 | 42 | 237 | 544 | 342 | 149 | — | + | + | + | — |
| 19 | F | 35 | 40 | 143 | 572 | 543 | 109 | — | — | — | — | — |
| 20 | M | 29 | 33 | 70 | 544 | 800 | 288 | + | + | — | + | — |
| 21 | M | 72 | 79 | 36 | 553 | 619 | 562 | — | — | — | — | — |
SP: splenomegaly; LP: chronic nonmalignant lymphoproliferation; H-IgG: hypercatabolism of IgG; AI: autoimmune disease; E: enteropathy.
B-cell subsets of CVID patients and HD are compared in Table II. Relative numbers of total CD19+ were similar in both groups, but not in the case of absolute counts, since CVID patients showed markedly reduced B-cell levels. Two patients (clinical symptoms started at 26 and 45years of age) had severely reduced numbers of B cells. Although we did not perform genetic analysis in our patients, we decided not to exclude them from the analysis.
Relative and absolute numbers of B-cell subsets from CVID and HD. Median values ± standard deviation (SD)
| CVID (n = 21) | HD (n = 21) | p value | |
| % CD19+ cells | 9.1 ± 8.6 | 9.1 ± 4.7 | 0.443 |
| % CD19/CD27—IgD+IgM+ | 78 ± 16 | 59 ± 17 | 0.001* |
| % CD19/CD27+IgD+IgM+ | 8.7 ± 14 | 17 ± 11 | 0.057 |
| % CD19/CD27+IgD—IgM— | 2.2 ± 4.1 | 16 ± 8.5 | < 0.001* |
| B cells (106/l) | 129 ± 443 | 214 ± 169 | 0.039* |
| B naive (106/l) | 71 ± 387 | 156 ± 129 | 0.161 |
| B memory nonswitched (106/l) | 15 ± 23 | 43 ± 22 | 0.036* |
| B memory class-switched (106/l) | 3 ± 13 | 42 ± 40 | < 0.001* |
Total B cell lymphocyte counts are expressed as a percentage of total PBLs; B-cell subsets as percentages of CD19+ B-cells.
CVID: common variable immunodeficiency; HD: healthy donor; PBL: peripheral blood lymphocyte.
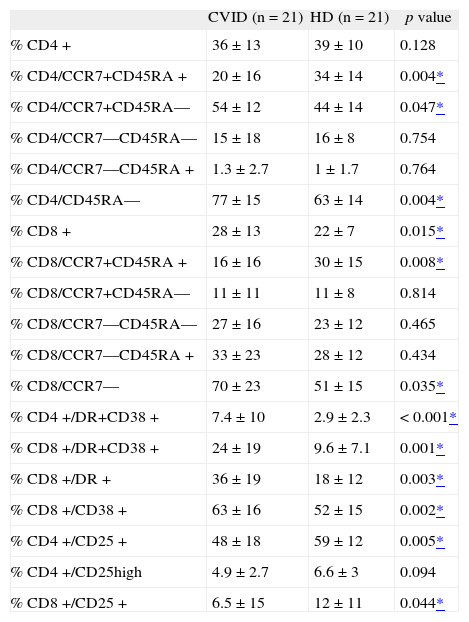
Naive-memory B-cell distribution was significantly different when comparing naive and class-switched B-cell subsets. The frequency of CD8+ T cells within the PBL population of CVID patients was significantly greater than in HD (Table III).
T-cell subpopulations; maturation profile and activation markers from CVID and HD. Median values ± standard deviation (SD)
| CVID (n = 21) | HD (n = 21) | p value | |
| % CD4+ | 36 ± 13 | 39 ± 10 | 0.128 |
| % CD4/CCR7+CD45RA+ | 20 ± 16 | 34 ± 14 | 0.004* |
| % CD4/CCR7+CD45RA— | 54 ± 12 | 44 ± 14 | 0.047* |
| % CD4/CCR7—CD45RA— | 15 ± 18 | 16 ± 8 | 0.754 |
| % CD4/CCR7—CD45RA+ | 1.3 ± 2.7 | 1 ± 1.7 | 0.764 |
| % CD4/CD45RA— | 77 ± 15 | 63 ± 14 | 0.004* |
| % CD8+ | 28 ± 13 | 22 ± 7 | 0.015* |
| % CD8/CCR7+CD45RA+ | 16 ± 16 | 30 ± 15 | 0.008* |
| % CD8/CCR7+CD45RA— | 11 ± 11 | 11 ± 8 | 0.814 |
| % CD8/CCR7—CD45RA— | 27 ± 16 | 23 ± 12 | 0.465 |
| % CD8/CCR7—CD45RA+ | 33 ± 23 | 28 ± 12 | 0.434 |
| % CD8/CCR7— | 70 ± 23 | 51 ± 15 | 0.035* |
| % CD4+/DR+CD38+ | 7.4 ± 10 | 2.9 ± 2.3 | < 0.001* |
| % CD8+/DR+CD38+ | 24 ± 19 | 9.6 ± 7.1 | 0.001* |
| % CD8+/DR+ | 36 ± 19 | 18 ± 12 | 0.003* |
| % CD8+/CD38+ | 63 ± 16 | 52 ± 15 | 0.002* |
| % CD4+/CD25+ | 48 ± 18 | 59 ± 12 | 0.005* |
| % CD4+/CD25high | 4.9 ± 2.7 | 6.6 ± 3 | 0.094 |
| % CD8+/CD25+ | 6.5 ± 15 | 12 ± 11 | 0.044* |
CD4+ and CD8+ lymphocytes are expressed as a percentage of total PBLs; CD4+ and CD8+ subsets as percentages of CD4+ and CD8+ T cells.
CVID: common variable immunodeficiency; HD: healthy donor; PBL: peripheral blood lymphocyte.
Naive cell levels were significantly lower in both CD4+ and CD8+ T-cell subsets than in HD. When segregating the memory pool in central memory (TCM), effector memory (TEM1), and final effector cells (TEM2), CD4+ TCM levels were significantly higher in CVID patients. If the analysis included TCM and TEM1 for CD4+ (CD4/CD45RA-), and TEM1/2 for CD8+ (CD8/CCR7—), significantly higher values of these pools were typical of CVID patients.
With regard to T-cell activation markers, significantly higher percentages of CD38 and HLA-DR were observed for CD4+ and CD8+ cells in the CVID group. Interestingly, expression of the CD25 molecule on the CD4+ and CD8+ T cells was significantly lower than in HD.
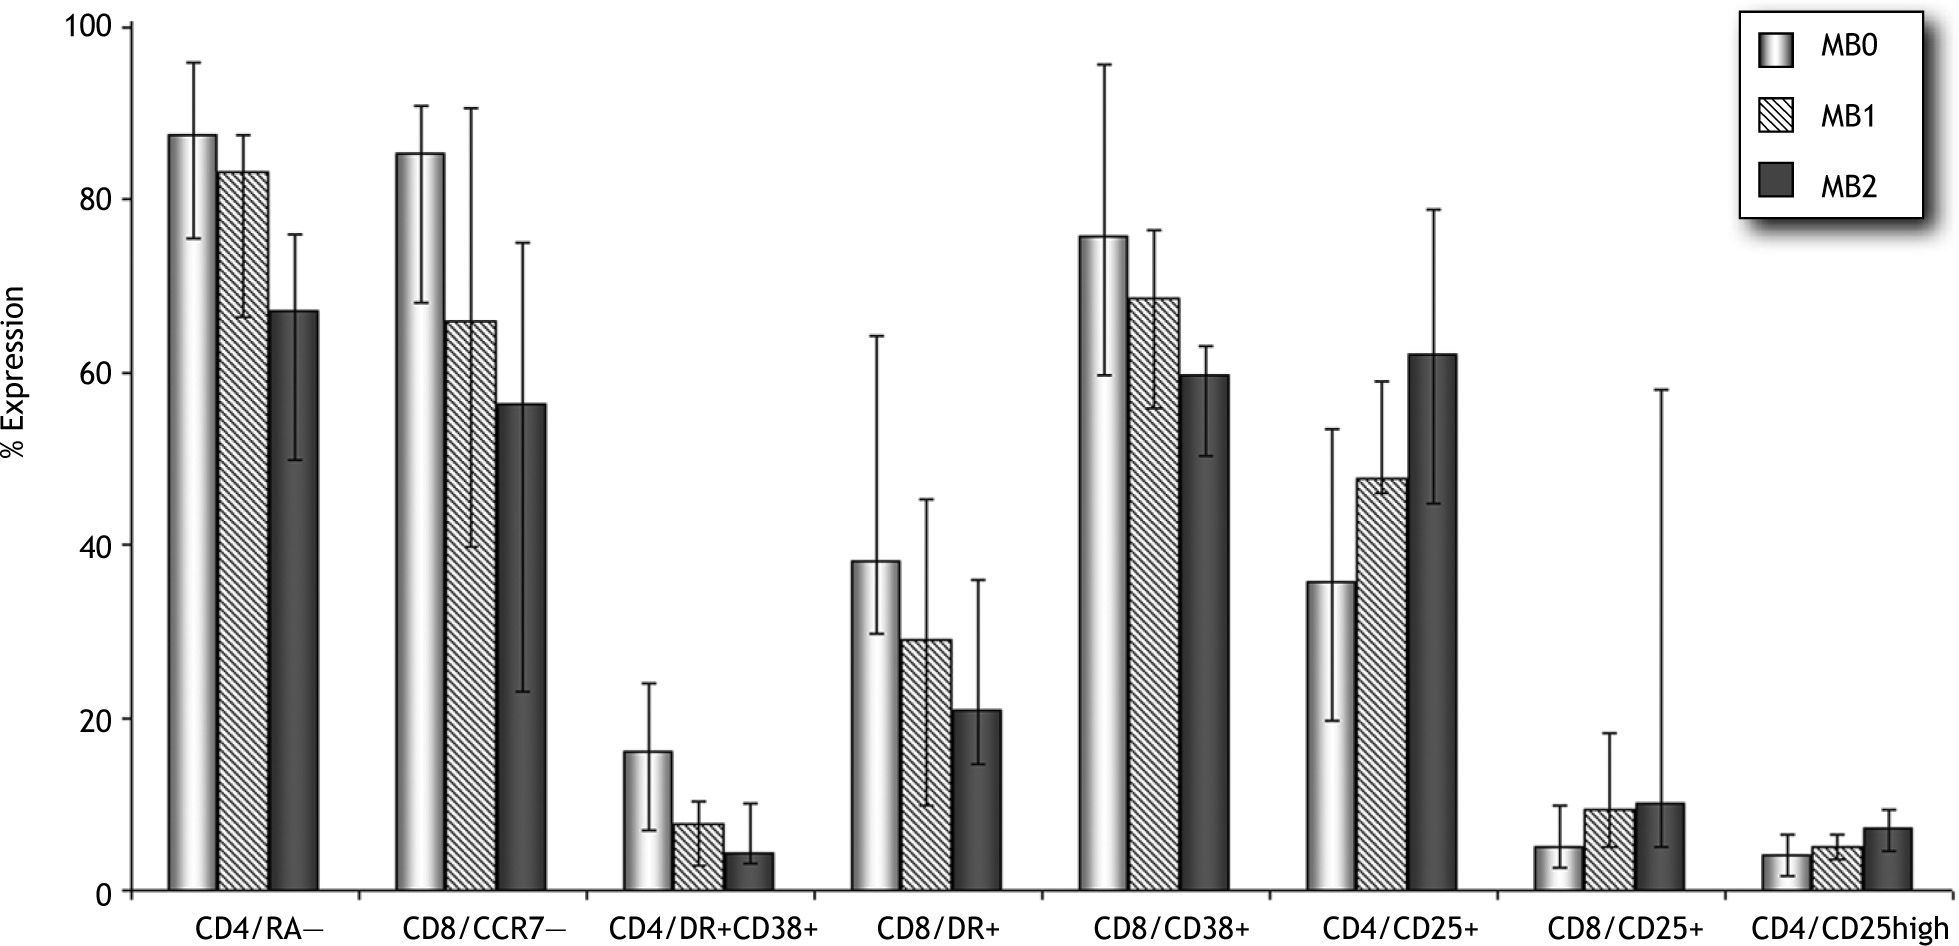
T-cell characteristics of the MB0/MB1/MB2 groupsAccording to the system proposed by Piqueras et al.20, we classified our patients as MB0, MB1, and MB2, based on B-cell surface expression of CD27, IgM, and IgD. MB2 comprises patients with CD19/CD27+ > 11 %; MB1 includes patients with CD19/CD27+ > 11 % and class-switched levels < 8 %; and MB0 have a severe reduction in both memory B-cell compartments (CD19/CD27+ < 11 %). T-cell compartments were then analyzed based on memory and activation phenotype.
As shown in Figure 1, higher percentages of memory CD4+ and CD8+ T cells were observed in the MB0 group, and these percentages gradually decreased from MB1 to MB2. These differences were statistically significant between MB0 and MB2 for the CD4/CD45RA— subset (87 % vs 67 %, p = 0.028). MB0 patients had significantly lower percentages of CD8/ CD45RA+CCR7+ T-cells (10 % vs 26 %, p = 0.028) than the MB2 group. As for the overall comparison with HD, activation markers were overexpressed for both T-cell subsets. HLA-DR and CD38 showed a decreasing pattern from MB0 to MB2. MB0 patients showed higher percentages of CD4/ CD38+DR+ (16 % vs 6 %, p = 0.073) and CD8/CD38+DR+ (38 % vs 15 %, p = 0.073) T-cells. Furthermore, decreased CD25 expression also characterized the MB0 group, especially the CD4/CD25+ subset in comparison with MB2 (36 % vs 62 %, p = 0.034).
Distribution of clinical symptoms according to T-cell phenotype; MB1 n = 7 (35 %); MB2 n = 5 (20 %). Bars represent the median; tails represent the 25th to 75th percentiles.")
When evaluating clinical symptoms, we observed that CVID patients with splenomegaly had significantly different percentages of functionally distinct T-cell subsets. These included naive CD4 cells (9 % vs 26 %; p = 0.02), CD4/ CD45RA— (89 % vs 71 %; p = 0.026), CD4 TEM1 (36 vs 17 %; p = 0.012), naive CD8 (8 % vs 23 %; p = 0.033), CD8/CCR7— (83 % vs 60 %; p = 0.041), CD4/CD38+DR+ (20 % vs 8 %; p = 0.002), CD8/CD38+DR+ (46 % vs 20 %; p = 0.009), CD8/ DR+ (55 % vs 27 %; p = 0.002), CD8/CD38+ (83 % vs 63 %; p = 0.041), and CD8/CD25+ (5 % vs 14 %; p = 0.023). Those patients with hypercatabolism of IgG showed significantly higher frequencies of CD8 TEM1 cells (46 % vs 25 %; p = 0.009).
For further analysis, patients were stratified into two groups according to each lymphocyte phenotype using the mean value for HD ± 2SD as a cut-off. Table IV summarizes the frequencies of each clinical parameter in patients with higher or lower percentages of selected T and B-cell subsets.
Distribution of clinical symptoms according to T and B-cell phenotype
| Lymphocyte subset groups | Percentage of patients affected by clinical complications | |||||
| SP (n = 6) | LP (n = 10) | H-IgG (n = 6) | AI (n = 8) | E (n = 7) | ||
| CD19/CD27+ | < 11 % | 44 | 78 | 56 | 55 | 44 |
| > 11 % | 18 | 27 | 9 | 18 | 18 | |
| p value | 0.22 | 0.035* | 0.038* | 0.1 | 0.22 | |
| CD4/CD45RA+CCR7+ | < 10 % | 66 | 66 | 50 | 20 | 16 |
| > 10 % | 15 | 38 | 23 | 31 | 38 | |
| p value | 0.046* | 0.25 | 0.25 | 0.38 | 0.348 | |
| CD4/CD45RA— | > 90 % | 100 | 100 | 75 | 75 | 25 |
| < 90 % | 13 | 31 | 19 | 25 | 31 | |
| p value | 0.003* | 0.026* | 0.06 | 0.1 | 0.65 | |
| CD8/CCR7— | > 85 % | 50 | 66 | 33 | 33 | 33 |
| < 85 % | 21 | 36 | 29 | 36 | 29 | |
| p value | 0.2 | 0.21 | 0.61 | 0.66 | 0.61 | |
| CD4/CD38+DR+ | > 8 % | 66 | 56 | 44 | 44 | 22 |
| < 8 % | 0 | 36 | 18 | 27 | 36 | |
| p value | 0.002* | 0.34 | 0.21 | 0.37 | 0.43 | |
| CD8/DR+ | > 43 % | 66 | 50 | 50 | 33 | 16 |
| < 43 % | 14 | 43 | 21 | 36 | 36 | |
| p value | 0.037* | 0.57 | 0.23 | 0.66 | 0.39 | |
| CD8/CD38+ | > 81 % | 80 | 80 | 60 | 80 | 40 |
| < 81 % | 13 | 33 | 20 | 20 | 27 | |
| p value | 0.014* | 0.098 | 0.13 | 0.031* | 0.48 | |
| CD4/CD25+ | < 36 % | 66 | 83 | 50 | 66 | 33 |
| > 36 % | 13 | 33 | 20 | 27 | 33 | |
| p value | 0.031* | 0.05 | 0.19 | 0.12 | 0.68 | |
| CD8/CD25+ | < 4 % | 60 | 80 | 40 | 80 | 40 |
| > 4 % | 19 | 38 | 25 | 25 | 31 | |
| p value | 0.12 | 0.13 | 0.45 | 0.047* | 0.57 | |
| CD4/CD25high | < 1 % | 100 | 100 | 26 | 100 | 0 |
| > 1 % | 21 | 42 | 50 | 32 | 37 | |
| p value | 0.071 | 0.21 | 0.5 | 0.13 | 0.43 | |
SP: splenomegaly; LP: chronic nonmalignant lymphoproliferation; H-IgG: hypercatabolism of IgG; AI: autoimmune disease; E: enteropathy. CD19/CD27+ cells were stratified using the MB0 group definition (Piqueras et al). T-cell subsets were stratified using HD mean value ± 2SD as cutoff.
Lymphoproliferative disorders and hypercatabolism of IgG were more frequently observed in patients with lower percentages of total memory B cells.
When we assessed the maturation profile of T cells, we observed lower percentages of naive CD4+ cells more frequently in patients with splenomegaly. Splenomegaly and lymphoproliferative disorders were also more frequent among patients with higher percentages of CD4/CD45RA— memory cells. Regarding activation markers, we observed a higher incidence of splenomegaly among patients with CVID and increased levels of activated CD4/CD38+DR+, CD8/DR+, and CD8/CD38+ cells, as was the case in those with lower percentages of CD4/CD25+ cells. In addition, autoimmune disease was more prevalent among patients with higher percentages of CD8/CD38+ T cells and decreased frequencies of CD8/CD25+ cells.
Increased percentages of CD4+CD45RA— and CD8+CD38+DR+ T cells were more frequently observed among CVID patients with more than one clinical complication.
DiscussionAs B-cell activation and differentiation into plasma cells depends on T-B interactions, it is reasonable to search for alterations in peripheral T cells and their relationship with B-cell subsets and the clinical characteristics of CVID patients. Previous studies pointed toward maturation abnormalities7,15, activation profiles11,12, altered cytokine production8, impaired regulatory function13, perturbed proliferation capacity, and increased levels of spontaneous apoptosis14.
The relationships between immunophenotypic T-cell abnormalities and memory/maturation B-cell subsets have received less attention. MB0 and MB1 CVID patients have been shown to have higher percentages of T cells with an activated phenotype, mainly CD8+ T cells, which are characterized by over-expression of the HLA-DR molecule13. Similarly, when we tracked lymphocyte changes associated with T-cell maturation and with activation markers, we found a similar pattern for MB2 and healthy controls, although this gradually deteriorates for MB1 and MB0. Thus, those patients with a severe reduction in memory B-cell levels seem to have enhanced activation patterns and higher CD4/CD45RA— T-cell levels.
The low number of CVID patients in our study prevents us from correlating immunophenotypic T-cell abnormalities with clinical features. This correlation should be further assessed in multicenter studies with larger CVID cohorts. In our study (single-center), the analysis of the distribution of clinical symptoms according to T-cell phenotype revealed potential functionally distinct subsets that might be considered in these studies.
A correlation between naive CD4 lymphopenia and low numbers of memory B-cell subsets has been observed by different authors14,17,20. Livaditi et al proposed that naive CD4+ cell counts should be assessed as an essential parameter to classify CVID due to the inverse correlation with clinical parameters, especially splenomegaly15. Giovannetti et al also proposed dividing patients according to the level of naive CD4 cells, based on its association with clinical findings, including clinical severity17. We confirmed that lower levels of naive CD4 cells are more frequently observed among patients with splenomegaly. In addition, we further investigated whether memory compartments based on CD45RA and CCR7 expression could help stratify patients with distinct clinical complications. The higher frequency of memory CD4+ T cells that we observed in CVID patients with splenomegaly and lymphoproliferation might reflect chronic antigen stimulation in vivo, which has also been demonstrated in previous studies by means of a distinctive gene profile7.
We have already reported the association between increased activated CD4+ and CD8+ cells and distinct clinical findings12. It is not clear, however, whether increased expression of activation markers is an epiphenomena or a pathogenic factor. It is well established that CD8+ lymphocytes play a major role in immune defense against virus and organ-specific autoimmune diseases. Interestingly, both features are enhanced in this syndrome, since CVID patients usually present autoimmunity and some authors have provided evidence of high levels of EBV and CMV-specific CD8 T cells with normal cytotoxic function21.
Increased percentages of CD8/CD38+ T cells were more frequently observed in CVID patients with a history of autoimmune disease. The physiological roles of CD38 include regulation of B-cell lymphopoiesis, rescue from apoptosis, and modulation of cell-recycling and homing22. Nevertheless, the potential role of CD8/CD38+ T cells in the pathogenesis of autoimmune diseases has not been elucidated.
Unlike HLA-DR, CD25 (IL2Rα) is an early activation marker that is down-expressed in our CVID patients. As far as we know, down-expression of CD25 on CD4 T cells coexisting with increased levels of other activation markers has not been previously documented in CVID. There is only one report of the lack of expression of CD25 on CD4+ T-cells in association with increased T-cell activation in a CVID patient23. Nevertheless, Piqueras et al reported that low levels of CD25 on B cells correlated with increased levels of activated T-cell subsets. Also of interest, in other human models of secondary immunodeficiency, such as HIV infection, a similar profile of down-expression of CD25 on CD4+ cells was shown to be associated with increased levels of CD4/DR+ and CD8/DR+ T cells24. In our cohort, we were able to demonstrate a higher prevalence of splenomegaly among patients with lower levels of CD4/CD25+ T cells.
Future studies in larger cohorts of patients should further assess whether T-cell maturation, activation, or regulatory profile could add information to current classification systems based only on dysregulated B-cell homeostasis in CVID. Furthermore, T-cell subset analysis might be useful in those cases in which undetectable levels of CD19+ disable the application of the B-cell scheme and therefore exclude these patients from classification.
Finally, we agree that an additional effort will be necessary to establish common guidelines so that flow cytometric acquisition and analysis procedures can be compared in centers throughout the world25.
This work was supported by a grant awarded to JC by the Instituto de Salud Carlos III, Madrid, Spain (FIS 05/0839). The authors declare no competing financial interest.
