


Edited by: Sonia Roman
More infoRecent studies have proposed two distinctive types of obesity, metabolically healthy obesity (MHO) and metabolically unhealthy obesity (MUHO), based on various physiological factors. This study sought to explore the relationship between the metabolic obesity types and the incidence of liver cirrhosis (LC) in a large nationally-representative population.
Materials and MethodsData on 27,629 adults with MHO or MUHO, were analyzed from the Korea National Health and Nutrition Examination Survey (KNHANES) obtained from 2015 through 2019. Four categories of metabolic health and weight (MHW) were generated for analysis: (1) MHO, (2) MUHO, (3) Metabolically unhealthy normal weight (MUHNW), and (4) Metabolically healthy normal weight (MHNW). Statistical analyzes were performed with univariate and multivariate logistic regression.
ResultsThe prevalence of LC did not show statistically significant differences among the MHW categories: 0.5% in MHO, 0.4% in MUHO, 0.2% in MHNW, and 0.3% in MUHNW. The unadjusted analysis showed a significant association between self-reported LC and MUHO, but this association was not evident in the adjusted analysis. In the adjusted analysis of the prevalence of laboratory LC, a significant association emerged in the MUHO group, followed in descending order of magnitude by the MHO and MUHNW groups. A favorable fasting blood glucose level was the only factor associated with increased prevalence of reported LC in MUHO.
ConclusionsThe study demonstrated a difference in the prevalence of LC between MHO and MUHO. Our study concludes that the MHO phenotype is a transient status with regard to metabolic abnormalities, and caution is necessary when evaluating MHO.
The increasing prevalence of obesity is a worldwide public health concern, and its association with numerous metabolic disorders, such as type 2 diabetes mellitus, cardiovascular disease, and liver disease, links it to one of the leading causes of mortality worldwide [1–4]. According to the Korea National Health and Nutrition Examination Survey (KNHANES) data, the prevalence of obesity in South Korea (hereafter, Korea) has increased from 34.1% in 2017 to 38.3% in 2020, coinciding with the changes in lifestyles that include high-calorie diets, a sedentary life, and excessive stress [5]. Concerns about the adverse impacts of obesity on health have prompted research on potential differences among various obesity groups categorized based on multiple physiological factors. Metabolically healthy obesity (MHO), which comprises up to 35% of obesity cases in the world, is a phenotype for those who have obesity but do not have the comorbidity of metabolic syndrome. The significance of this distinction is high since MHO has been associated with a lower risk of future cardiovascular events and lower mortality compared to metabolically unhealthy obesity (MUHO) [2,6,7]. The major differences between the MHO and the MUHO phenotypes include less liver fat content and abdominal (including visceral) adiposity in those with MHO [7–10]. Excessive fat accumulation in the liver causes steatosis, which is one of the leading causes of liver cirrhosis (LC) along with excessive alcohol consumption, and steatosis is responsible for approximately 39% of all LC cases [11]. Multiple studies have examined the health outcomes in MHO, but the results have been largely inconsistent because the criteria for MHO have not been fully established. Most published studies related to MHO included one or two metabolic components, although it has been well-established that the risk of cardiovascular disease is determined by multiple metabolic risk factors [12,13]. To examine the differences in obesity status between the MHO and the MUHO groups, we hypothesized that a more rigorous criterion should be applied to better define MHO vs. MUHO based on the metabolic disorder status. While the existing standard for obesity is measured by body mass index (BMI), it has been also proposed that waist circumference (WC) should be measured to reflect the differential characteristics of MUHO [14].
LC is a chronic disease that occurs during the advanced stages of all chronic liver diseases and is characterized by the presence of fibrosis and regenerative nodules in the liver [15–17]. As the 14th leading cause of mortality globally, LC is a worldwide public health problem and accounts for approximately 1.3 million deaths each year [18]. In Korea, liver disease is the sixth most common cause of death, with rates of 15.6 to 17.3 people per 100 thousand people [19]. Most patients with LC remain asymptomatic until they reach the decompensated phase, and diagnostic tools for early detection of LC are largely lacking, which explain the high mortality rate associated with LC. In addition, liver biopsy, which is considered the gold standard for diagnosis of LC, has a substantial risk of complications and is recommended only when a definitive diagnosis is required [16,20,21]. For this reason, to evaluate laboratory LC by less invasive but more limited methods, such as laboratory tests and imaging studies, are being used along with clinical examinations to evaluate laboratory LC. Laboratory tests, including aspartate aminotransferase (AST) and alanine transaminase (ALT) values, are generally found to be normal or slightly high, and an AST/ALT ratio greater than 1 is a strong predictor of LC, except in alcoholic liver disease and advanced stages [16,20,22,23]. Therefore, LC needs to be assessed as ‘diagnosed by MD (medical doctor)’ or ‘suspected by laboratory result’ by setting diagnostic standards for laboratory test results.
Lastly, the advanced presence and severity of liver fibrosis are associated with metabolic syndrome as well as severe obesity and hepatic steatosis [20,24]. Few studies have demonstrated the association between MHO and the incidence of non-alcoholic fatty liver disease (NAFLD), and scarce evidence exists about the impact of MHO on NAFLD fibrosis progression [25]. Furthermore, to the best of our knowledge, there are no studies on obesity as an independent variable for predicting the risk of LC. The objective of this study was to compare the differences between MHO and MUHO using a strict criterion based on the presence or absence of metabolic disorders.
2Materials and Methods2.1Study data and study designFor this analysis, we used data from the 2015 to 2019 KNHANES, collected by the Korea Centers for Disease Control and Prevention (currently, the Korea Disease Control and Prevention Agency) [5]. The KNHANES, a cross-sectional and nationally representative survey, has been conducted annually to evaluate the health behaviors, chronic disease status, and nutritional status of the general population of Korea.
Research subjects were selected using a two-stage stratified cluster sampling to obtain nationally representative data. The data collection process included visiting household members, a health survey, a physical examination, and a nutritional status evaluation. The health survey and physical examination were conducted in a mobile examination vehicle, and the nutritional status evaluation was conducted while visiting each household. The KNHANES provides statistical data on 23 household strata and 192 samples from 2015 to 2018, and 25 household strata and 192 national samples in 2019. This study analyzed a total of 27,629 subjects over the age of 19 years who had physical examination data that included a diagnosis of MHO.
2.2Variable measurementWe divided the participants into four categories based on the BioShare-EU Healthy Obese Project: (1) MHO, (2) MUHO, (3) Metabolically unhealthy normal weight (MUHNW), and (4) Metabolically healthy normal weight (MHNW) [26]. Specifically, health and obesity were defined based on BMI measurements and the following criteria, the strict criteria of the metabolic syndrome: (1) systolic blood pressure (SBP) ≥ 130 mmHg or diastolic blood pressure (DBP) ≥ 85 mmHg or use of antihypertensive medication; (2) fasting blood glucose (FBG) ≥ 6.1 mmol/L (110 mg/dL) or non-fasting blood glucose ≥ 7.0 mmol/L (126 mg/dL), use of blood glucose-lowering medication or a diagnosis of type 2 diabetes; (3) high-density lipoprotein-cholesterol (HDL-C) < 1.03 mmol/L (40 mg/dL) in men or <1.30 mmol/L (50 mg/dL) in women or medical treatment for low HDL-C, fasting triglycerides (TG) ≥ 1.70 mmol/L (150 mg/dl) or medication for elevated triglycerides, and a diagnosis of cardiovascular disease [26]. In addition, we incorporated a WC of 90 cm for men and 85 cm for women instead of BMI to better define MUHO because WC has been associated with superior predictive values for determining health status, including cardiovascular disease, especially in Asians [27–29]. WC was measured at the end of a normal expiration, placing the tape at the midpoint between the lower border of the rib cage and the iliac crest. Blood pressure was measured three times on the arm at the heart level with a mercury sphygmomanometer. For clinical examination, fasting blood sampling was done in the morning from the antecubital vein, and analysis was carried out at a certified institution [5]. MHO is defined as obesity (WC ≥ 90 cm for men and WC ≥ 85 cm for women), having none of the strict criteria of the metabolic syndrome. MUHO is defined as obesity and having at one of the strict criteria of the metabolic syndrome. MUHNW is defined as not obesity (WC < 90 cm for men and WC < 85 cm for women) and having one of the strict criteria of the metabolic syndrome. Lastly, MHNW is defined as not obesity and having none of the strict criteria of the metabolic syndrome. LC was identified by a doctor's diagnosis in the self-report survey or by an AST level ≥ 23.5 IU/L (sensitivity 63.6%; specificity 65.9%; p < 0.001) as determined by the diagnostic criteria of calculated AST, ALT, or AST/ALT ratios associated with an increase in the prevalence of LC, using a receiver operating characteristic (ROC) curve (Fig. 1).
 curves for the AST, ALT, or AST/ALT ratios are associated with an increase in the prevalence of liver cirrhosis. For the AST, ALT, or AST/ALT ratios, the area under the curve were 0.714, p < 0.001, 0.556, p = 0.054, and 0.629, p < 0.001, respectively. The optimal AST value-maximizing sensitivity and specificity was AST ≥ 23.5 IU/L (sensitivity 63.6%, specificity 65.9%, p < 0.001). The optimal value of the AST/ALT ratio maximizing sensitivity and specificity was 1.28 (sensitivity 59.6%, specificity 58.9%, p < 0.001). AST: aspartate aminotransferase; ALT: alanine transaminase.")
Receiver operating characteristic (ROC) curves for the AST, ALT, or AST/ALT ratios are associated with an increase in the prevalence of liver cirrhosis. For the AST, ALT, or AST/ALT ratios, the area under the curve were 0.714, p < 0.001, 0.556, p = 0.054, and 0.629, p < 0.001, respectively. The optimal AST value-maximizing sensitivity and specificity was AST ≥ 23.5 IU/L (sensitivity 63.6%, specificity 65.9%, p < 0.001). The optimal value of the AST/ALT ratio maximizing sensitivity and specificity was 1.28 (sensitivity 59.6%, specificity 58.9%, p < 0.001). AST: aspartate aminotransferase; ALT: alanine transaminase.
Demographic variables included age, sex, education, and household income. Health behaviors such as smoking (current smoking, former smoking, and non-smoking), binge alcohol consumption (based on frequency: not drinking alcohol, not binge drinking, and yes), regular aerobic exercise (yes or no) and health status such as hepatitis B virus (HBV) surface antigen and hepatitis C virus (HCV) antibody were included.
2.3Data analysisTo determine the best diagnostic criteria for AST, ALT, or AST/ALT ratios, the values associated with an increase in the prevalence of LC were calculated through ROC curve analysis by presenting the optimal thresholds for each parameter with the best combination of sensitivity and specificity. All data were weighted by proportion for data analysis to represent the total Korean population based on the complex survey design. Descriptive statistics, the chi-square test, and the t-test were used to analyze the subjects’ characteristics and differences according to the metabolic health and weight (MHW) categories. Univariate and multivariate logistic regression were used to analyze the relationship between the MHW categories and the prevalence of LC, using MHNW as the reference category. Adjusting for other covariates, multivariate logistic regression was carried out to identify the elements affecting metabolic health associated with LC by the MHW category. All analyzes were represented by odds ratios (ORs) with 95% CIs. The SPSS version 27 (IBM Corp., Armonk, NY, USA) was used for all statistical analyzes, including the analysis of complex survey data.
2.4Ethical statementThe Korea Disease Control and Prevention Agency offered the raw KNHANES data after submission of a pledge of user compliance for using the statistical data and a pledge of security. For the privacy of subjects, some contents such as age, number of members in a household, household income, and national insurance were anonymized.
3Results3.1Study subjects’ general and clinical characteristics according to MHW categoryThe general and clinical characteristics of the study subjects according to the MHW category are shown in Table 1. Compared to MHNW, those with MUHO, followed in descending order by MUHNW and MHO, were older, less educated, more likely to be in a lower household economic status, current smokers, non-regular aerobic exercisers, and had less favorable clinical values (SBP/DBP, FBG, TG, HDL-C, and HCV antibody count). Those with MUHO, followed in descending order by MHO and MUHNW, were more likely to be female and had a higher WC. The MHO group also had more binge alcohol consumption (p < 0.05).
Study participants’ general and clinical characteristics according to metabolic health and weight (MHW) category.*
| Characteristics | MUHO | MUHNW | MHO | MHNW | χ2 | p | |
|---|---|---|---|---|---|---|---|
| Total (N = 27,629) | n = 7,276 (24.4%) | n = 10,475 (36.2%) | n = 1,416 (5.3%) | n = 8,462 (34.1%) | |||
| Age | Mean±SD | 52.94 ± 0.28⁎⁎⁎ | 50.35 ± 0.23⁎⁎⁎ | 45.58 ± 0.50⁎⁎⁎ | 39.33 ± 0.20 | ||
| Sex | Male | 3,557 (56.5) | 4,928 (52.7) | 670 (55.2) | 2,991 (41.0) | 466.49 | < 0.001 |
| Female | 3,719 (43.5) | 5,547 (47.3) | 746 (44.8) | 5,471 (59.0) | |||
| Elementary school graduation and less | 2,284 (23.9) | 2,384 (16.6) | 253 (12.0) | 647 (5.1) | |||
| Education | Middle school graduation | 894 (10.9) | 1,235 (10.4) | 122 (6.7) | 520 (5.1) | 1664.29 | < 0.001 |
| High school graduation | 2,068 (31.6) | 3,418 (35.7) | 475 (36.9) | 3,056 (38.9) | |||
| University and above | 1,985 (33.6) | 3,388 (37.3) | 560 (44.3) | 4,212 (50.9) | |||
| Household economic status (quartile) | First | 1,914 (21.3) | 2,159 (16.9) | 213 (11.6) | 884 (9.6) | ||
| Second | 1,902 (25.3) | 2,640 (24.4) | 370 (25.7) | 6,754 (23.7) | 616.81 | < 0.001 | |
| Third | 1,790 (27.6) | 2,739 (28.2) | 393 (29.6) | 2,578 (31.6) | |||
| Fourth | 1,644 (25.8) | 2,904 (30.5) | 434 (33.1) | 3,130 (37.2) | |||
| Current smoking | 1,436 (24.1) | 2,501 (23.7) | 233 (19.4) | 1,207 (17.0) | |||
| Smoking | Former smoking | 1,807 (25.6) | 2,436 (23.3) | 355 (25.7) | 1,438 (17.3) | 502.40 | < 0.001 |
| No | 3,988 (50.3) | 5,924 (52.9) | 824 (54.9) | 5,805 (65.8) | |||
| Binge alcohol consumption | Yes | 3,075 (49.8) | 4,367 (48.6) | 665 (53.5) | 3,995 (52.8) | ||
| No binge drinking | 1,785 (21.9) | 3,023 (26.8) | 387 (24.7) | 2,734 (29.8) | 335.36 | < 0.001 | |
| No alcohol drinking | 2,373 (28.3) | 3,027 (24.6) | 360 (21.8) | 1,720 (17.4) | |||
| Regular aerobic exercise | No | 4,510 (59.1) | 6,010 (54.8) | 744 (49.7) | 4,126 (46.5) | 273.67 | < 0.001 |
| Yes | 2,716 (40.9) | 4,396 (45.2) | 663 (50.3) | 4,306 (53.5) | |||
| Waist circumference (cm) | Male | 96.69 ± 0.12⁎⁎⁎ | 82.94 ± 0.09⁎⁎⁎ | 95.24 ± 0.21⁎⁎⁎ | 79.34 ± 0.13 | ||
| Female | 92.34 ± 0.13⁎⁎⁎ | 76.27 ± 0.10⁎⁎⁎ | 90.38 ± 0.20⁎⁎⁎ | 72.29 ± 0.11 | |||
| Systolic blood pressure (mmHg) | Mean±SD | 125.71 ± 0.24⁎⁎⁎ | 121.36 ± 0.23⁎⁎⁎ | 113.55 ± 0.27⁎⁎⁎ | 108.26 ± 0.13 | ||
| Diastolic blood pressure (mmHg) | Mean±SD | 79.80 ± 0.17⁎⁎⁎ | 77.39 ± 0.14⁎⁎⁎ | 74.25 ± 0.21⁎⁎⁎ | 71.36 ± 0.10 | ||
| Fasting blood glucose (mg/dL) | Mean±SD | 111.23 ± 0.45⁎⁎⁎ | 102.04 ± 0.28⁎⁎⁎ | 94.58 ± 0.25⁎⁎⁎ | 90.50 ± 0.10 | ||
| Fasting triglycerides (mg/dL) | Mean±SD | 191.76 ± 2.11⁎⁎⁎ | 159.29 ± 1.87⁎⁎⁎ | 96.81 ± 0.97⁎⁎⁎ | 79.45 ± 0.38 | ||
| HDL-C (mg/dL) | Male | 42.99 ± 0.18⁎⁎⁎ | 46.19 ± 0.20⁎⁎⁎ | 50.66 ± 0.38⁎⁎⁎ | 53.93 ± 0.21 | ||
| Female | 47.80 ± 0.20⁎⁎⁎ | 49.57 ± 0.18⁎⁎⁎ | 60.60 ± 0.36⁎⁎⁎ | 63.68 ± 0.17 | |||
| Hepatitis B virus surface antigen | Antigen count | 92.86 ± 8.75 | 94.30 ± 7.46 | 161.35 ± 32.24 | 107.86 ± 8.96 | ||
| Hepatitis C virus antibody | Antibody count | 0.14 ± 0.01⁎⁎⁎ | 0.12 ± 0.01 ⁎⁎ | 0.10 ± 0.02 | 0.09 ± 0.01 | ||
MUHO, metabolically unhealthy and obese; MUHNW, metabolically unhealthy and normal weight; MHO, metabolically healthy and obese; MUHO, metabolically unhealthy and obese; HDL-C, high-density lipoprotein-cholesterol; SD, standard deviation.
Table 2 displays the prevalence of LC according to the MHW category. The prevalence of LC in the self-report survey based on the MD diagnosis did not show statistically significant differences among the different categories of MHW: 0.5% in MHO, 0.4% in MUHO, 0.2% in MHNW, and 0.3% in MUHNW. However, the prevalence of LC as determined by the AST criterion showed statistically significant differences according to the MHW category with the MUHO group having the highest prevalence (49.5%), followed by MUHNW (33.8%), MHO (37.2%), and MHNW (20.2%).
The prevalence of liver cirrhosis according to metabolic health and weight (MHW) category.
| Characteristics | MUHO | MUHNW | MHO | MHNW | χ2 | p | |
|---|---|---|---|---|---|---|---|
| Total (N = 27,629) | n = 7,276 (24.4%) | n = 10,475 (36.2%) | n = 1,416 (5.3%) | n = 8,462 (34.1%) | |||
| Liver cirrhosis | Yes (doctor's diagnosis) | 31 (0.4) | 45 (0.3) | 7 (0.5) | 16 (0.2) | 7.09 | 0.111 |
| Yes (by the AST criterion) | 3479(49.5) | 3621(33.8) | 526(37.2) | 1829(20.2) | 1533.63 | <0.001 | |
| AST (SGOT) | Mean ± SD (IU/L) | 27.30 ± 0.23⁎⁎⁎ | 23.39 ± 0.18⁎⁎⁎ | 24.25 ± 0.53⁎⁎⁎ | 20.22 ± 0.11 | ||
| ALT (SGPT) | Mean ± SD (IU/L) | 32.40 ± 0.40⁎⁎⁎ | 22.07 ± 0.19⁎⁎⁎ | 26.46 ± 0.81⁎⁎⁎ | 16.86 ± 0.15 | ||
MUHO, metabolically unhealthy and obese; MUHNW, metabolically unhealthy and normal weight; MHO, metabolically healthy and obese; MHNW, metabolically healthy and normal weight; SD, standard deviation.
The association between the MHW categories and LC and a comparison of the elements measuring metabolic health of LC by MHW category are presented in Figs. 1 and 2. In the unadjusted analysis, those with MUHO had a significantly higher prevalence of LC, as reported by the MD diagnosis, when compared to those with MHNW (OR = 0.705; 95% CI, 0.001–1.410; p = 0.050). However, in the adjusted analysis, the statistical associations disappeared. When evaluating clinical values, a better FBG (average level) was the only significant element associated with a higher prevalence of LC in those with MUHO (OR = 0.970; 95% CI, 0.942–0.999; p = 0.046) (Fig. 3).
 for the prevalence of liver cirrhosis (by a doctor")
Unadjusted and adjusted odds ratios (ORs) for the prevalence of liver cirrhosis (by a doctor's diagnosis) according to metabolic health and weight (MHW) category. MUHO: metabolically unhealthy and obese; MUHNW: metabolically unhealthy and normal weight; MHO: metabolically healthy and obese; MHNW: metabolically healthy and normal weight.
 for metabolic health parameters associated with liver cirrhosis (by a doctor")
Adjusted odds ratios (ORs) for metabolic health parameters associated with liver cirrhosis (by a doctor's diagnosis) by metabolic health and weight category. MUHO: metabolically unhealthy and obese; MUHNW: metabolically unhealthy and normal weight; MHO: metabolically healthy and obese; MHNW: metabolically healthy and normal weight; WC: waist circumference; SBP: systolic blood pressure (mmHg); DBP: diastolic blood pressure (mmHg); FBG: fasting blood glucose (mg/dL); TG: fasting triglycerides (mg/dL); HDL-C: high-density lipoprotein-cholesterol (mg/dL).
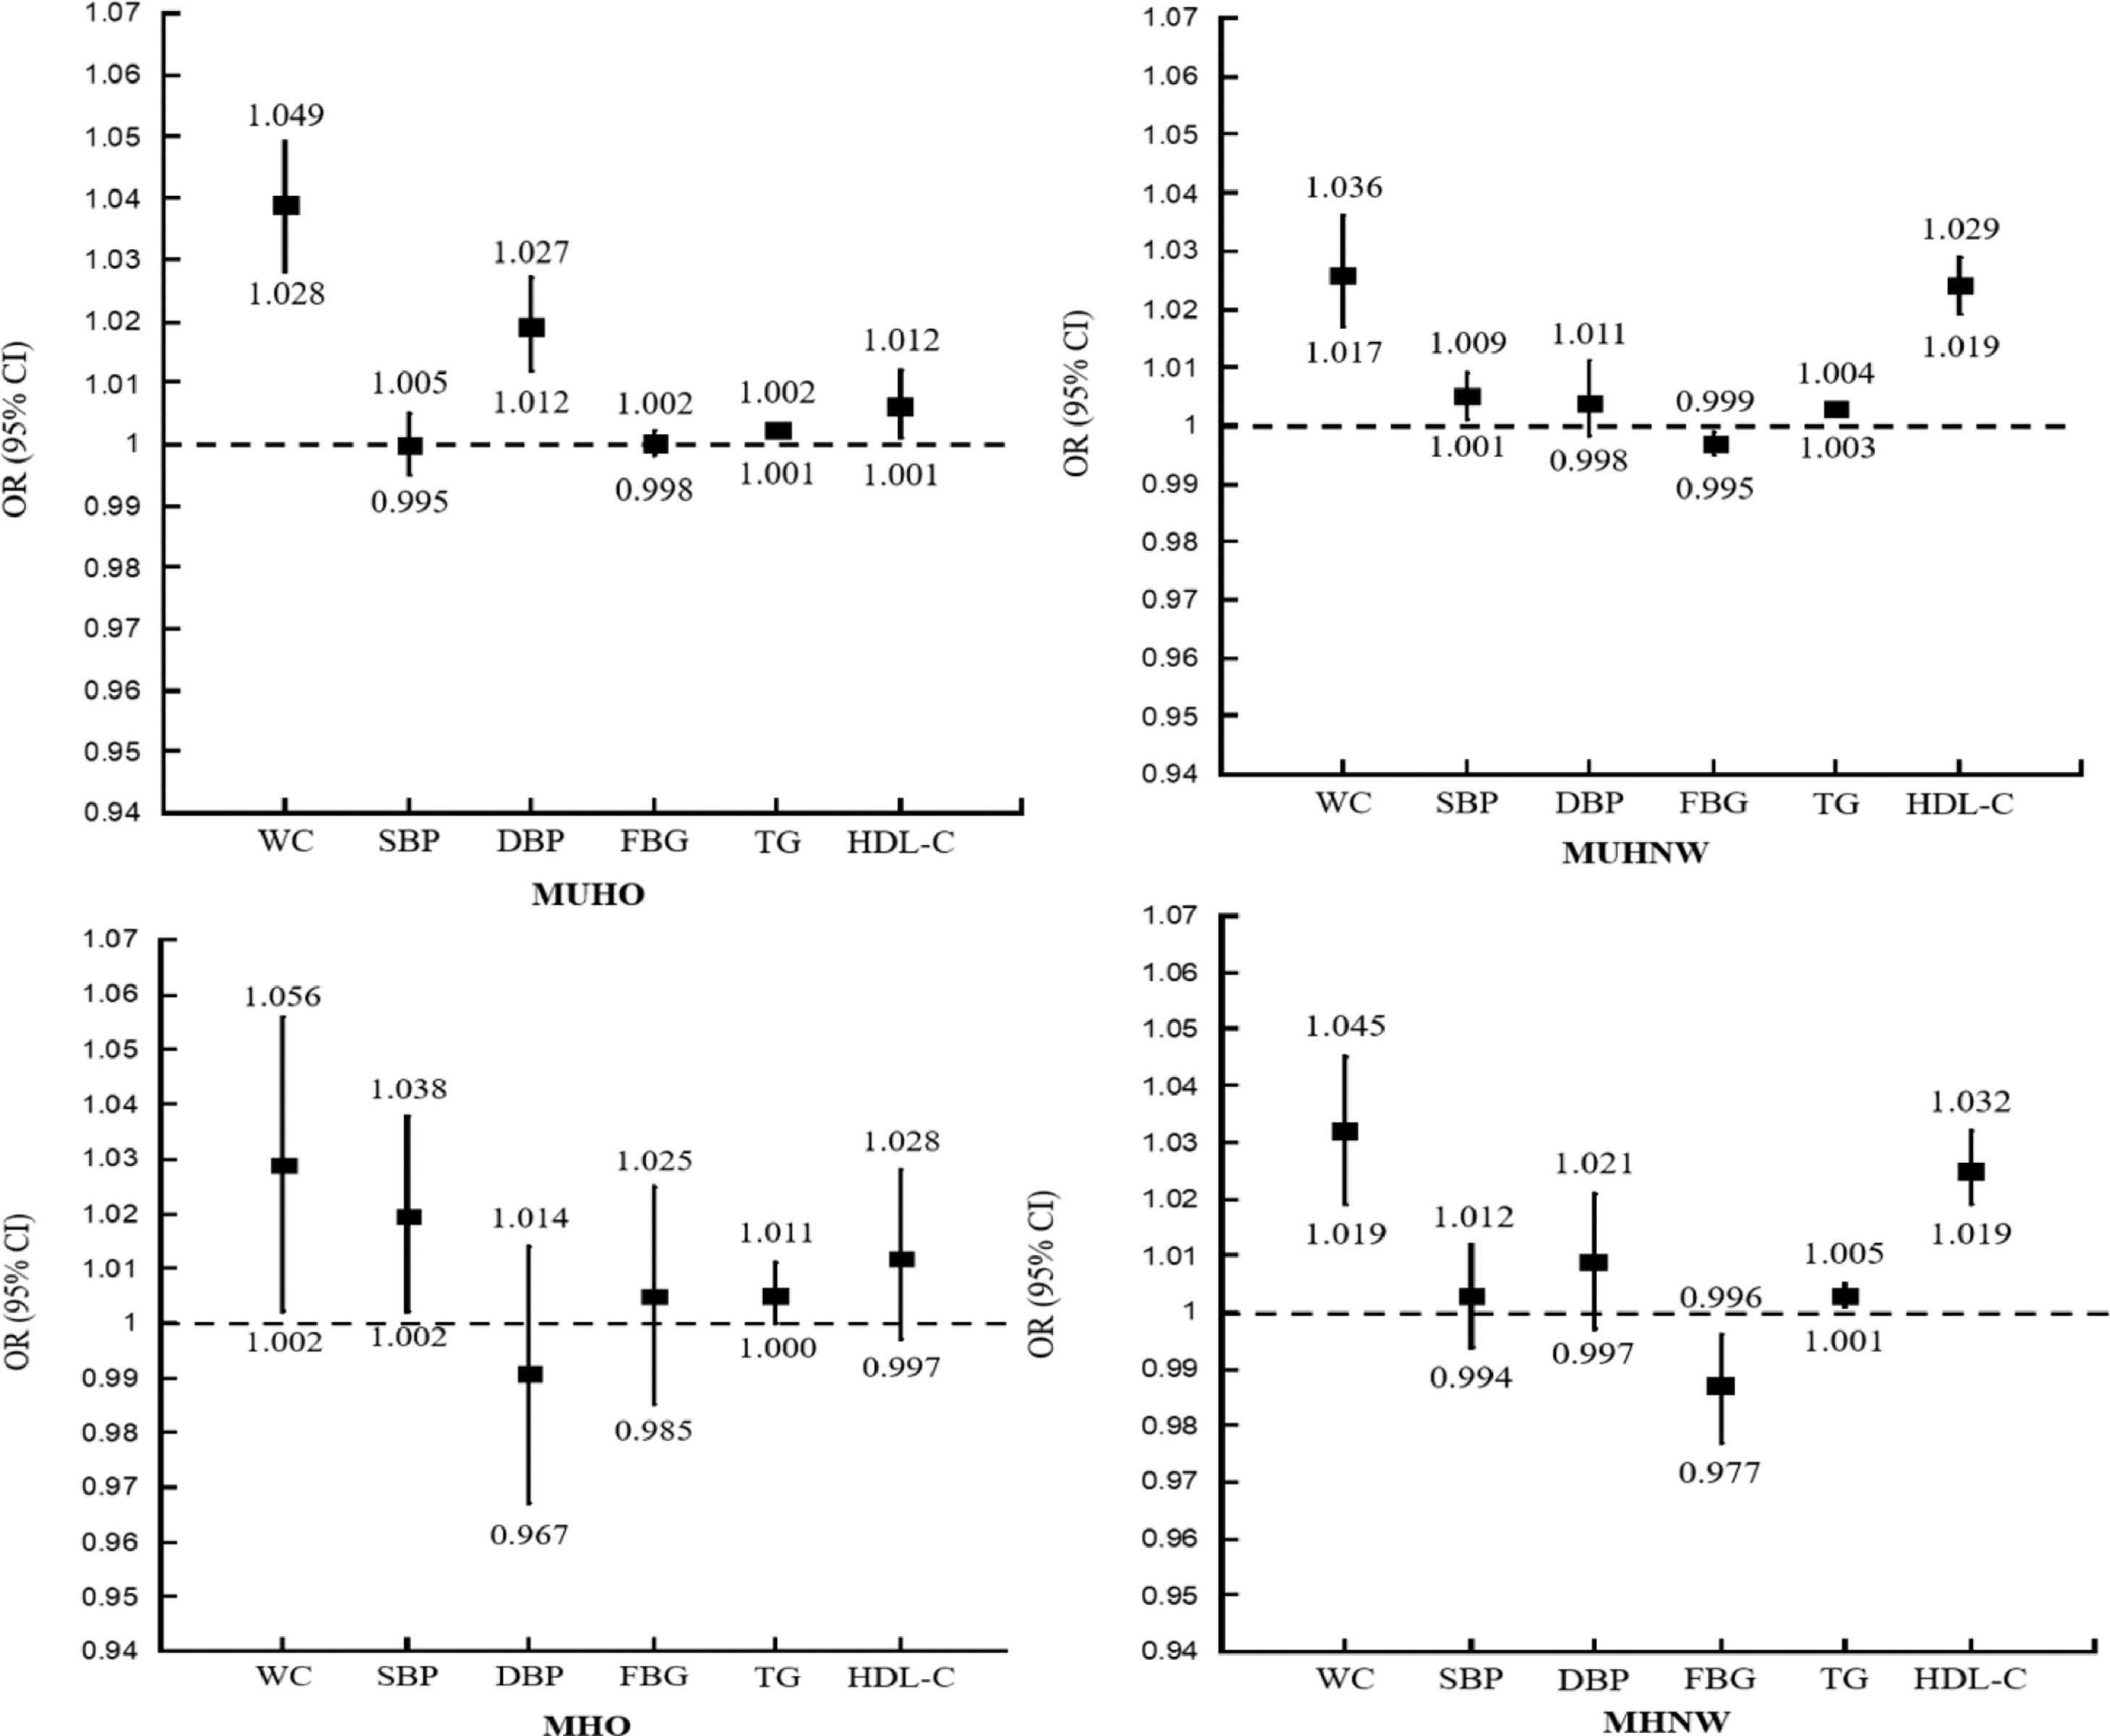
In adjusted analysis, those with MUHO had statistically significant associations with a higher prevalence of LC, as determined by the AST criterion compared to the MHNW group (OR = 2.788; 95% CI, 2.552–3.046; p < 0.001; OR = 1.882; 95% CI, 1.632–2.170; p < 0.001) (Fig. 4). In addition, less favorable WC, BP, and TG were associated with a higher prevalence of LC in the MUHO and MHO group (Fig. 5).
 for metabolic health parameters associated with liver cirrhosis (measured by the AST criterion) by metabolic health and weight category. MUHO: metabolically unhealthy and obese; MUHNW: metabolically unhealthy and normal weight; MHO: metabolically healthy and obese; MHNW: metabolically healthy and normal weight.")
Adjusted odds ratios (ORs) for metabolic health parameters associated with liver cirrhosis (measured by the AST criterion) by metabolic health and weight category. MUHO: metabolically unhealthy and obese; MUHNW: metabolically unhealthy and normal weight; MHO: metabolically healthy and obese; MHNW: metabolically healthy and normal weight.
 for the elements measuring metabolic health associated with liver cirrhosis (measured by the AST criterion) by metabolic health and weight category. MUHO: metabolically unhealthy and obese; MUHNW: metabolically unhealthy and normal weight; MHO: metabolically healthy and obese; MHNW – metabolically healthy and normal weight; WC: waist circumference; SBP: systolic blood pressure (mmHg); DSP: diastolic blood pressure (mmHg); FBG: fasting blood glucose (mg/dL); TG: fasting triglycerides (mg/dL); HDL-C: high-density lipoprotein-cholesterol (mg/dL).")
Adjusted odds ratios (ORs) for the elements measuring metabolic health associated with liver cirrhosis (measured by the AST criterion) by metabolic health and weight category. MUHO: metabolically unhealthy and obese; MUHNW: metabolically unhealthy and normal weight; MHO: metabolically healthy and obese; MHNW – metabolically healthy and normal weight; WC: waist circumference; SBP: systolic blood pressure (mmHg); DSP: diastolic blood pressure (mmHg); FBG: fasting blood glucose (mg/dL); TG: fasting triglycerides (mg/dL); HDL-C: high-density lipoprotein-cholesterol (mg/dL).
In this population-based study, we examined the association between the MHW categories and LC to obtain more insights on the characteristics of MHO in relation to LC. We adopted two types of LC, self-reported LC by the MD diagnosis in the self report (people who responded they were diagnosed with LC by a medical doctor on the survey) and laboratory LC by an elevated AST, to further explore the obesity-specific risk of LC. Our findings suggest that the MUHO had the highest prevalance of laboratory LC, followed in descending order by MHO and MUHNW.
The MUHO group was also associated with a higher prevalence of laboratory LC in the unadjusted analysis, but the difference was not statistically significant in the adjusted analysis. This discrepency between the unadjusted and adjusted analyzes can be explained by the impact of other compounding variables, including the smoking status, binge alcohol consumption, and the presence of hepatitis B and/or C (data not shown). The subjects with these characteristics might have had liver diseases caused by alcohol and/or hepatitis infections, which are generally known to cause LC, complicating the role of obesity and metabolic disorders in LC caused by hepatic steatosis [2]. Previous studies demonstrated that the main causes of LC and related mortality include hepatitis B (31.5% in males and 24.0% in females), hepatitis C (25.5% in males and 26.7 females), alcohol-related liver disease (27.3% in males and 20.6% females), non-alcoholic steatohepatitis (7.7% in males and 11.3% in females), and others (8.0% in males and 17.3% in females) [30]. Liver-related diseases are usually insidious, and the progression from fibrosis to LC usually takes 15–20 years [31]. Many of the subjects in the KNHANES data were from regions with limited medical access or people who had mild symptoms and were less likely to be diagnosed, therefore excluding them from the data of those having reported characteristics of LC. This further supports our approach to better characterize LC using laboratory test results.
The biological mechanisms of obesity and LC have been demonstrated by many groups. Specifically, it has been shown that excessive lipid accumulation in hepatocytes can progress to steatosis, which results in increased production or reduced clearance of hepatic triglycerides or fatty acids [32,33]. This may progress to accumulation of fat in the liver, called steatohepatitis, which leads to inflammation, cell death, and scarring (fibrosis) of the liver [34]. If left untreated for long-term, fibrosis becomes LC, the end stage of liver disease [35]. Ectopic fat accumulation also exacerbates insulin resistance, failure to inhibit liver glucose production, and lipid synthesis in the liver, which lead to disorders such as hyperglycemia, hypertriglyceridemia, hyperinsulinemia, and increased free fatty acid influx. For these reasons, hepatosteatosis is strongy associated with nonalcoholic fatty liver disease (NAFLD) and nonalcoholic steatohepatitis [36] as well as abnormal metabolic responses [37].
A strength of the current study is that we clearly defined the elements of MHW associated with LC. WC and TG were associated with a higher prevalence of LC in all MHW subgroups. This study is consistent with a previous cohort study, which demonstrated that obesity was not associated with an increased incidence of NAFLD, even in those with metabolic abnormalities [12]. MHO differs from MUHO as it has the key physiological traits of greater insulin sensitivity and secretion [3]. The current study also showed lower FBG was associated with a higher prevalence of laboratory LC in MUHO and of laboratory LC in MUHNW and MHNW, but not in MUHO and MHO. These results were different from some previoulsy published data, which show that obesity as well as elevated FBG could increase the risk of fibrosis in those with NAFLD and LC [20,38]. Although differences in the risk for LC according to obesity and metabolic abnormalities appear to be well-defined, the possible association between the FBG level and LC needs further clarification in future studies. Of note, a Korean genomic study suggested that the metabolically unhealthy group had genetic polymorphisms involved in lipid metabolism (LPL, APOA5, and CETP) and glucose metabolism (GCKR, CDKAL1, and CDKN2B). [39] Considering insulin-resistance seems to play a role in the differences, the MHO phenotype seems to be transient status to metabolic abnormalities. [3] Understanding the timing and content of MHO and MUHO in the disease process might help to establish a more effective intervention system and contribute to the prevention of LC.
There are also limitations to this analysis. First, the cross-sectional study design limited causal interpretation between the MHW categories and the prevalence of LC. Second, the data were based on noninstitutionalized individuals, which limited the number of patients diagnosed with LC. Third, lab measurements, including AST, ALT, or AST/ALT ratios, were used to assess the prevalence of LC instead of the liver biopsy. As there are some views that these markers have lower specificity, some hepatologists are unwilling to use AST and ALT as non-invasive markers for calculating hepatic injury. However, by defining population-specific cutoff values (ROC, Fig. 1), their usefulness is of immense value for detecting liver damage at the initial stages in which biopsy would not be indicated. Also, they are still considered useful diagnostic and prognostic tools especially since they are safe, economical, and easily accessible [40–42]. This is important for research on regional populations, although further studies using more accurate tools are required for confirmation of the data. Fourth, the research data included LC cases assessed by AST and ALT without further clinical assessment. As the hepatic diseases are insidious and progression from fibrosis to cirrhosis usually takes 15–20 years, [31] we included these data to cover potential LC. However, further research using standards such as APRI or FIB4 is needed. Nonetheless, to our knowledge, this study is the first to report the strong association between the MHW categories and the prevalence of LC.
5ConclusionsOur findings describe population-level patterns in the prevalence of LC based on the MHW categories. A strong association was found between MUHO and the prevalence of laboratory LC in the adjusted analysis. In conclusion, in the unadjusted analysis of the prevalence of laboratory LC, Those with MUHO, but not MHO, were significantly associated with the prevalence of laboratory LC in the unadjusted analysis, but the statistical associations disappeared in the adjusted analysis due to compounding variable, such as alcohol consumption and hepatitis. Lastly, a more favorable in average, but higher FBG was the only significant element associated with a higher prevalence of laboratory LC in MUHO. As an element of obesity and metabolic health associated with LC, insulin resistance also seemed to play a role in those differences. The MHO phenotype is a transient status leading to eventual metabolic abnormalities, and the findings of this study provide further understanding of the timing and content of MHO and MUHO management and the possibility of establishing different intervention systems that contribute to the prevention of LC.
Availability of data and materialsThe datasets used and/or analyzed during the current study are available from the corresponding author on reasonable request.


