Bacterial infections are common complications in patients with cirrhosis and are associated with poor prognosis. There are no studies that analyze the impact of different infectious complications in the mortality of these patients, so we aimed to perform this evaluation.
Materials and methodsWe performed a case-control study in adult patients with cirrhosis with a follow-up period of one year. We recorded demographic data, prognostic scales, infectious complications and mortality at 30, 90 and 365 days. For the survival analysis, Kaplan–Meyer survival curve was performed and hazard ratios were calculated with 95% confidence intervals by Cox-regression in univariate and multivariate models. For the comparison between groups the Chi squared test, Fisher's exact test and Mann–Whitney U test were performed.
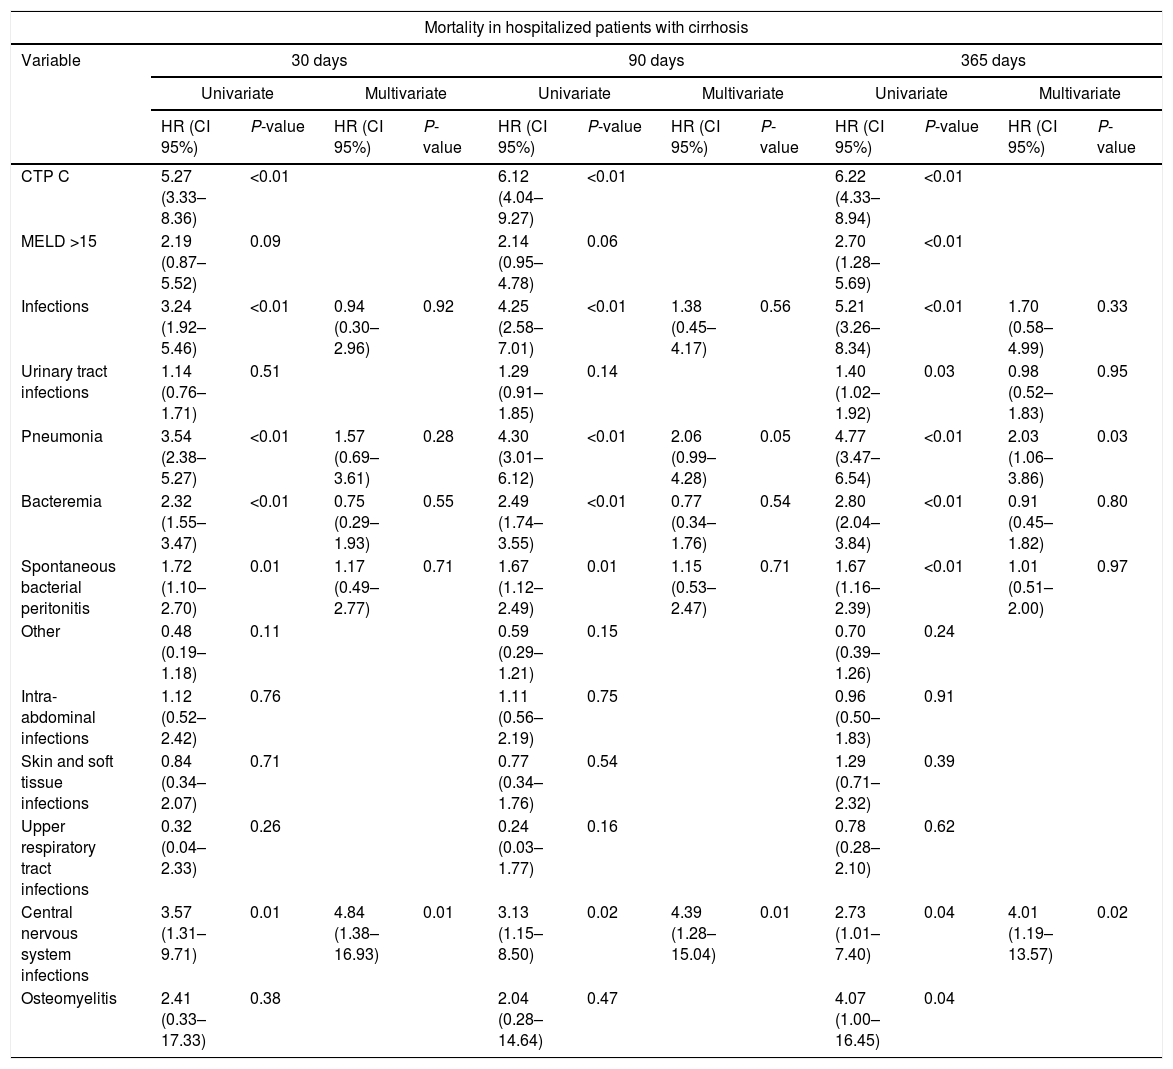
ResultsWe included 500 patients. Median age was 58 years, predominant sex was woman (52%) and the most common infections were urinary tract infections (35%), pneumonia (28.2%) and spontaneous bacterial peritonitis (SBP) (18%). From the patients, 40.4% were CTP score C and median MELD score was 15. In the univariate analysis, infections in general, SBP, pneumonia and central nervous system (CNS) infections had an increased mortality at the three follow up periods, however in the multivariate analysis with the prognostic scales, only pneumonia (HR 2.03, CI 95%[1.06–3.86]) and CNS infections (HR 4.84, CI 95%[1.38–16.93]) remained with increased mortality.
ConclusionsSome infectious complications, as pneumonia and CNS infections, increase mortality in hospitalized patients with cirrhosis, regardless of the severity of liver disease.
Cirrhosis is one of the leading causes of mortality in the world [1]. In decompensated cirrhosis, overall survival dramatically decreases to 15% at 5 years [2]. Patients with cirrhosis are at high risk for the development of bacterial infections, this due to multiple factors as increase in intestinal permeability, bacterial translocation and a state of immunosuppression [3–5]. Hence, bacterial infections are common complications in patients with cirrhosis and are associated with poor prognosis as they decrease short-term survival irrespective of liver disease severity [6,7]. Even, by some experts, it has been proposed that these should be a factor to be considered in the prognostic scales of these patients [8]. On the other hand, infections are among the most common triggers of the acute-on-chronic liver failure syndrome, which is the most common direct cause of death in patients with decompensated cirrhosis [9–12].
Additionally, the prevalence of infections caused by multidrug-resistant microorganisms has increased in this group of patients [13,14]. This is important, as the choice of effective empirical antibiotic therapy should be guided by the local epidemiology of bacterial infections and resistance to antibiotics. The current recommendations of the most important societies of hepatology on empirical treatment of infectious complications in patients with cirrhosis are based on a supposed high susceptibility to treatment with third generation cephalosporins [15–17]. However, this susceptibility has changed, and therefore the recommendations for empirical treatment, one of the main factors in the reduction of mortality associated with sepsis, must change according to updated reports on the epidemiology of bacterial infections in patients with cirrhosis [18].
To date, it has been studied that bacterial infectious complications, particularly those caused by multi-drug resistant microorganisms, compromise short-term survival in patients with cirrhosis; however, the impact of the different infectious complications has not been studied. Therefore, we aimed in the first place, to evaluate the impact of different infectious complications on short and long-term mortality of hospitalized patients with cirrhosis, and secondarily, to evaluate the epidemiology and antibiotic resistance of these infectious complications in our center.
2Material and methodsWe performed a retrospective study of all patients with cirrhosis consecutively admitted in our center from March 1st, 2014 to February 28th, 2017.
2.1Study populationInclusion criteria were adult patients from both sexes of 18–70 years old with the diagnosis of cirrhosis by clinical, histological, biochemical and imaging abnormalities. Exclusion criteria were a hospital stay of less than 72h, patients with a history of cancer (except hepatocellular carcinoma), extra hepatic autoimmune diseases, human immunodeficiency virus infection and liver transplantation, or current treatment with immunosuppressant drugs (Fig. 1). Survival rates were retrospectively determined from the day of hospital admission until death or the respective follow-up period, 30, 90 days or 1-year, whichever came first.
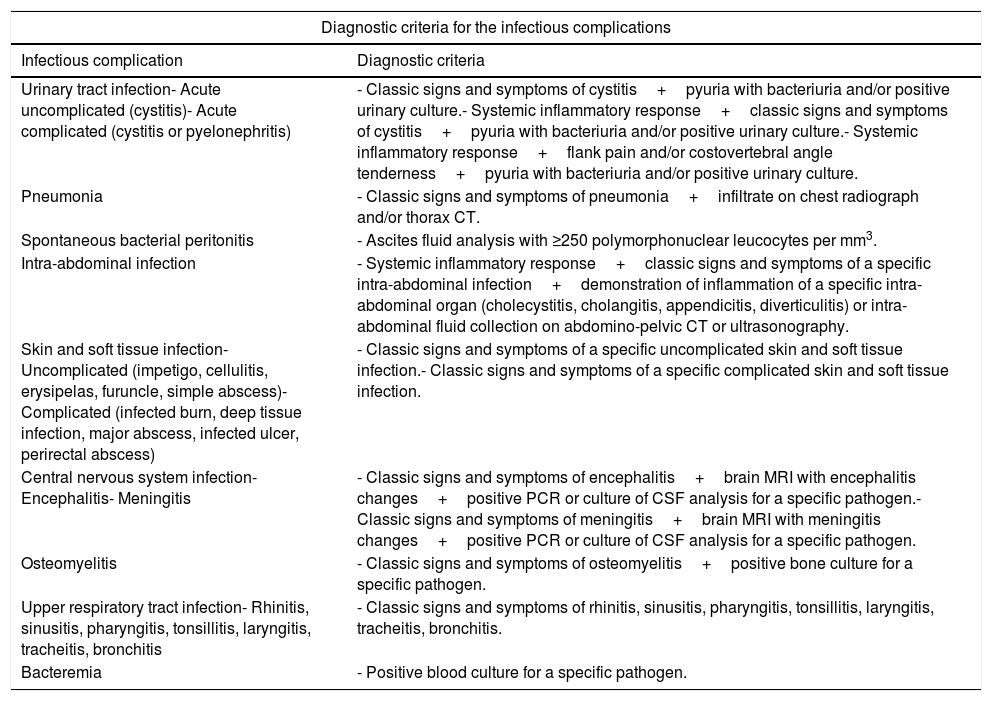
2.2Data recordedWe recorded demographic data of sex, age, etiology of cirrhosis and prognostic scales of cirrhosis; Child–Turcotte–Pugh (CTP) and Model for End-Stage Liver Disease (MELD) scores. We recorded infectious complications, being the direct cause of hospitalization or developed during a hospitalization from another cause. We included all infections regardless of whether they were community acquired, nosocomial or health-care associated. Infections recorded were urinary tract infections, pneumonia, spontaneous bacterial peritonitis (SBP), intra-abdominal infections, skin and soft tissue infections, central nervous system (CNS) infections (encephalitis, meningitis or tuberculosis), osteomyelitis, upper respiratory tract infections, bacteremia and other. Criteria used to define each infectious complication were based on the current guidelines from the Infectious Diseases Society of America and the American Association for the Study of Liver Diseases (Table 1) [17,19–30]. The microbiological isolates were recorded, as well as the rates of infections by multidrug-resistant microorganisms. The primary outcome was all cause mortality at 30, 90 and 365 days of follow-up.
Diagnostic criteria for the infectious complications.
| Diagnostic criteria for the infectious complications | |
|---|---|
| Infectious complication | Diagnostic criteria |
| Urinary tract infection- Acute uncomplicated (cystitis)- Acute complicated (cystitis or pyelonephritis) | - Classic signs and symptoms of cystitis+pyuria with bacteriuria and/or positive urinary culture.- Systemic inflammatory response+classic signs and symptoms of cystitis+pyuria with bacteriuria and/or positive urinary culture.- Systemic inflammatory response+flank pain and/or costovertebral angle tenderness+pyuria with bacteriuria and/or positive urinary culture. |
| Pneumonia | - Classic signs and symptoms of pneumonia+infiltrate on chest radiograph and/or thorax CT. |
| Spontaneous bacterial peritonitis | - Ascites fluid analysis with ≥250 polymorphonuclear leucocytes per mm3. |
| Intra-abdominal infection | - Systemic inflammatory response+classic signs and symptoms of a specific intra-abdominal infection+demonstration of inflammation of a specific intra-abdominal organ (cholecystitis, cholangitis, appendicitis, diverticulitis) or intra-abdominal fluid collection on abdomino-pelvic CT or ultrasonography. |
| Skin and soft tissue infection- Uncomplicated (impetigo, cellulitis, erysipelas, furuncle, simple abscess)- Complicated (infected burn, deep tissue infection, major abscess, infected ulcer, perirectal abscess) | - Classic signs and symptoms of a specific uncomplicated skin and soft tissue infection.- Classic signs and symptoms of a specific complicated skin and soft tissue infection. |
| Central nervous system infection- Encephalitis- Meningitis | - Classic signs and symptoms of encephalitis+brain MRI with encephalitis changes+positive PCR or culture of CSF analysis for a specific pathogen.- Classic signs and symptoms of meningitis+brain MRI with meningitis changes+positive PCR or culture of CSF analysis for a specific pathogen. |
| Osteomyelitis | - Classic signs and symptoms of osteomyelitis+positive bone culture for a specific pathogen. |
| Upper respiratory tract infection- Rhinitis, sinusitis, pharyngitis, tonsillitis, laryngitis, tracheitis, bronchitis | - Classic signs and symptoms of rhinitis, sinusitis, pharyngitis, tonsillitis, laryngitis, tracheitis, bronchitis. |
| Bacteremia | - Positive blood culture for a specific pathogen. |
CT, computerized tomography; MRI, magnetic resonance image; PCR, polymerase chain reaction; CSF, cerebrospinal fluid.
Demographic data are presented as numbers and percentages for categorical variables and as medians and inter-quartile ranges for numerical variables. For the comparison between the groups, the X2 test, Fisher's exact test and Mann–Whitney U test were used as appropriate. For the survival analysis, a Kaplan–Meyer survival curve was performed, and hazard ratios were calculated with 95% confidence intervals by Cox-regression in univariate and multivariate models at 30, 90 and 365 days, for each different follow-up period we performed a different analysis with the corresponding days of follow-up, in the case of patients who died, from the index hospitalization until death, and in the case of patients who survived, from the index hospitalization until the corresponding follow-up period (30, 90 or 365 days), and for the hypothesis test the X2 test was used. Additionally, we performed the survival analysis stratified by the categories of the CTP and MELD scores. A p<0.05 was considered as statistically significant. The follow-up periods began with the first hospital admission and ended with the maximum follow-up period or death, whichever came first. The Microsoft Office® 2011 for Mac V. 14.7.7 and IBM SPSS® Statistics V. 21.0.0.0 software were used.
2.4Ethics approval and informed consentThis study was approved by the research and ethics committee of the National Institute of Medical Sciences and Nutrition Salvador Zubiran and written informed consent was obtained from all participants.
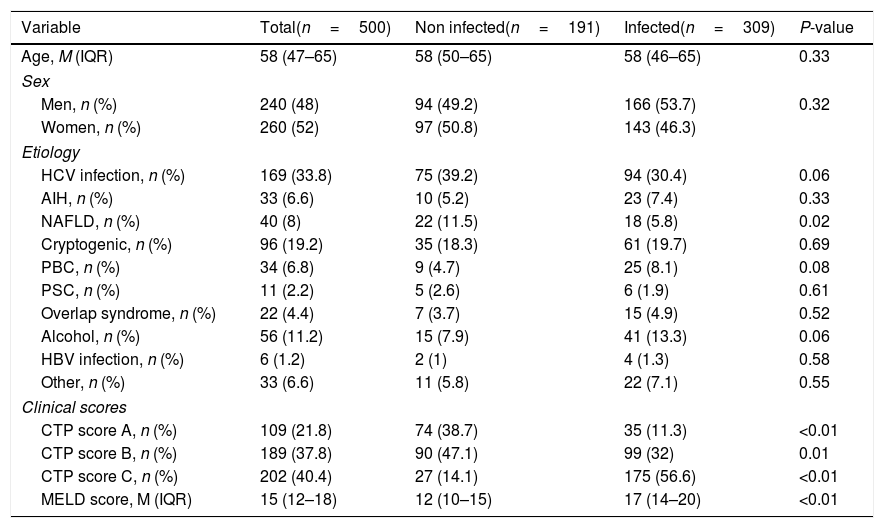
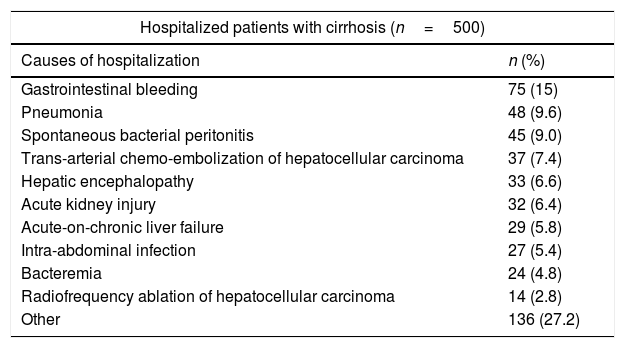
3Results3.1DemographicsWe included 500 patients; median age was 58 years (IQR 47–65) and predominant sex was women (52%). The most common etiologies of cirrhosis were hepatitis C virus infection (33.8%), cryptogenic (19.2%) and alcoholic (11.2%). Patients with CTP scores A and B presented fewer infectious complications than patients with CTP scores C (Table 2). The index causes hospitalization are described in Table 3.
Demographic characteristics.
| Variable | Total(n=500) | Non infected(n=191) | Infected(n=309) | P-value |
|---|---|---|---|---|
| Age, M (IQR) | 58 (47–65) | 58 (50–65) | 58 (46–65) | 0.33 |
| Sex | ||||
| Men, n (%) | 240 (48) | 94 (49.2) | 166 (53.7) | 0.32 |
| Women, n (%) | 260 (52) | 97 (50.8) | 143 (46.3) | |
| Etiology | ||||
| HCV infection, n (%) | 169 (33.8) | 75 (39.2) | 94 (30.4) | 0.06 |
| AIH, n (%) | 33 (6.6) | 10 (5.2) | 23 (7.4) | 0.33 |
| NAFLD, n (%) | 40 (8) | 22 (11.5) | 18 (5.8) | 0.02 |
| Cryptogenic, n (%) | 96 (19.2) | 35 (18.3) | 61 (19.7) | 0.69 |
| PBC, n (%) | 34 (6.8) | 9 (4.7) | 25 (8.1) | 0.08 |
| PSC, n (%) | 11 (2.2) | 5 (2.6) | 6 (1.9) | 0.61 |
| Overlap syndrome, n (%) | 22 (4.4) | 7 (3.7) | 15 (4.9) | 0.52 |
| Alcohol, n (%) | 56 (11.2) | 15 (7.9) | 41 (13.3) | 0.06 |
| HBV infection, n (%) | 6 (1.2) | 2 (1) | 4 (1.3) | 0.58 |
| Other, n (%) | 33 (6.6) | 11 (5.8) | 22 (7.1) | 0.55 |
| Clinical scores | ||||
| CTP score A, n (%) | 109 (21.8) | 74 (38.7) | 35 (11.3) | <0.01 |
| CTP score B, n (%) | 189 (37.8) | 90 (47.1) | 99 (32) | 0.01 |
| CTP score C, n (%) | 202 (40.4) | 27 (14.1) | 175 (56.6) | <0.01 |
| MELD score, M (IQR) | 15 (12–18) | 12 (10–15) | 17 (14–20) | <0.01 |
M, median; IQR, inter-quartile range; n, number; %, percentage; HCV, hepatitis C virus; AIH, autoimmune hepatitis; NAFLD, non-alcoholic fatty liver disease; PBC, primary biliary cholangitis; PSC, primary sclerosing cholangitis; HBV, hepatitis B virus; CTP, Child–Turcotte–Pugh; MELD, model for end-stage liver disease.
Causes of hospitalization.
| Hospitalized patients with cirrhosis (n=500) | |
|---|---|
| Causes of hospitalization | n (%) |
| Gastrointestinal bleeding | 75 (15) |
| Pneumonia | 48 (9.6) |
| Spontaneous bacterial peritonitis | 45 (9.0) |
| Trans-arterial chemo-embolization of hepatocellular carcinoma | 37 (7.4) |
| Hepatic encephalopathy | 33 (6.6) |
| Acute kidney injury | 32 (6.4) |
| Acute-on-chronic liver failure | 29 (5.8) |
| Intra-abdominal infection | 27 (5.4) |
| Bacteremia | 24 (4.8) |
| Radiofrequency ablation of hepatocellular carcinoma | 14 (2.8) |
| Other | 136 (27.2) |
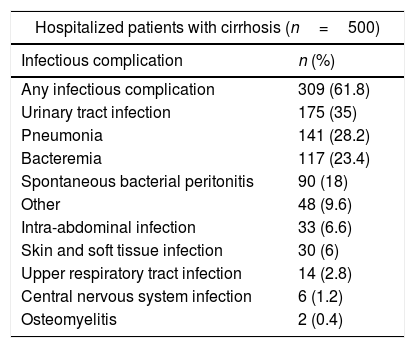
From the 500 patients evaluated, 309 (61.8%) patients presented a total of 656 infectious complications, from which 77 (11.73%) were polymicrobial. The most common infections were urinary tract infections (35%), pneumonia (28.2%) and bacteremia (23.4%). A total of 48 patients presented some non-classified infectious complication, and we included them together in a category labeled as “other infectious complication”, these were; infectious colitis due to clostridium difficile (n=24), acute infectious diarrhea (n=5), cytomegalovirus viremia (n=4), pleural tuberculosis (n=3), latent tuberculosis (n=3), infectious esophagitis (n=2), infectious endocarditis (n=2), bone tuberculosis (n=1), oral candidiasis (n=1), infectious thyroiditis (n=1), septic arthritis (n=1) and nocardiosis (n=1). The incidence of each infectious complication is presented in Table 4. The microbiological isolates of each infectious complication are presented in Figure 2.
Rates of infectious complications among hospitalized patients with cirrhosis.
| Hospitalized patients with cirrhosis (n=500) | |
|---|---|
| Infectious complication | n (%) |
| Any infectious complication | 309 (61.8) |
| Urinary tract infection | 175 (35) |
| Pneumonia | 141 (28.2) |
| Bacteremia | 117 (23.4) |
| Spontaneous bacterial peritonitis | 90 (18) |
| Other | 48 (9.6) |
| Intra-abdominal infection | 33 (6.6) |
| Skin and soft tissue infection | 30 (6) |
| Upper respiratory tract infection | 14 (2.8) |
| Central nervous system infection | 6 (1.2) |
| Osteomyelitis | 2 (0.4) |
Regarding the proportion of infectious complications caused by multidrug-resistant microorganisms, methicillin-resistant Staphylococcus aureus was isolated in 25% of pneumonia, 33.3% of bacteremia, 9.09% of skin and soft tissue infections and 0% of upper respiratory tract infections caused by S. aureus, and production of extended-spectrum beta-lactamases was present in 28.1% of urinary tract infections, 0% of pneumonia, 15.68% of bacteremia, 25% of SBP, 50% of intra-abdominal infections and 0% of skin and soft tissue infections caused by Escherichia coli, and, in 12.1% of urinary tract infections, 0% of pneumonia, 0% of bacteremia, 0% of SBP, 0% of intra-abdominal infections, 0% of skin and soft tissue infections and 0% of upper respiratory tract infections caused by Klebsiella spp.
There was no association between the different causes of hospital admission (other than the infectious complications being the cause of admission) and the different infectious complications presented among the hospitalized patients with cirrhosis.
3.3Survival analysisFor the whole group of patients (n=500) the overall survival rates in the different periods of follow up were 80.2% (n=401) at 30 days, 74.6% (n=373) at 90 days and 68.0% (n=340) at 365 days. For the sub-group of patients who did not presented any infectious complication (n=191) the overall survival rates in the different periods of follow up were 91.1% (n=174) at 30 days, 90.6% (n=173) at 90 days and 89.5% (n=171) at 365 days. For the sub-group of patients who presented infectious complications (n=309) the overall survival rates in the different periods of follow up were 73.5% (n=227) at 30 days, 64.7% (n=200) at 90 days and 54.7% (n=169) at 365 days (Figure 1).
The Kaplan–Meyer curve that illustrates the difference in survival between patients who presented some infectious complication against those who did not present any infectious complication is shown in Figure 3.
The causes of death were pneumonia (n=51), spontaneous bacterial peritonitis (n=16), bacteremia (n=16), variceal gastrointestinal hemorrhage (n=16), acute cholangitis (n=14), hepatorenal syndrome (n=12), secondary peritonitis (n=10), non-variceal gastrointestinal hemorrhage (n=6), infectious colitis (n=5), meningitis (n=4), acute cholecystitis (n=3), hepatocellular carcinoma (n=3), skin and soft tissue infection (n=2), encephalitis (n=1) and osteomyelitis (n=1).
In the univariate analysis, infections in general, pneumonia, bacteremia, SBP and infections of the CNS had an increased mortality at the follow up periods of 30, 90 and 365 days, but in the multivariate analysis including the prognostic scales of CTP and MELD, only pneumonia at the 1-year follow up period (p=0.031) and CNS infections at the three follow up periods (p<0.05), remained with this increased mortality (Table 5).
Univariate and multivariate analysis of the impact of infectious complications in the mortality of hospitalized patients with cirrhosis at 30, 90 and 365 days of follow-up.
| Mortality in hospitalized patients with cirrhosis | ||||||||||||
|---|---|---|---|---|---|---|---|---|---|---|---|---|
| Variable | 30 days | 90 days | 365 days | |||||||||
| Univariate | Multivariate | Univariate | Multivariate | Univariate | Multivariate | |||||||
| HR (CI 95%) | P-value | HR (CI 95%) | P-value | HR (CI 95%) | P-value | HR (CI 95%) | P-value | HR (CI 95%) | P-value | HR (CI 95%) | P-value | |
| CTP C | 5.27 (3.33–8.36) | <0.01 | 6.12 (4.04–9.27) | <0.01 | 6.22 (4.33–8.94) | <0.01 | ||||||
| MELD >15 | 2.19 (0.87–5.52) | 0.09 | 2.14 (0.95–4.78) | 0.06 | 2.70 (1.28–5.69) | <0.01 | ||||||
| Infections | 3.24 (1.92–5.46) | <0.01 | 0.94 (0.30–2.96) | 0.92 | 4.25 (2.58–7.01) | <0.01 | 1.38 (0.45–4.17) | 0.56 | 5.21 (3.26–8.34) | <0.01 | 1.70 (0.58–4.99) | 0.33 |
| Urinary tract infections | 1.14 (0.76–1.71) | 0.51 | 1.29 (0.91–1.85) | 0.14 | 1.40 (1.02–1.92) | 0.03 | 0.98 (0.52–1.83) | 0.95 | ||||
| Pneumonia | 3.54 (2.38–5.27) | <0.01 | 1.57 (0.69–3.61) | 0.28 | 4.30 (3.01–6.12) | <0.01 | 2.06 (0.99–4.28) | 0.05 | 4.77 (3.47–6.54) | <0.01 | 2.03 (1.06–3.86) | 0.03 |
| Bacteremia | 2.32 (1.55–3.47) | <0.01 | 0.75 (0.29–1.93) | 0.55 | 2.49 (1.74–3.55) | <0.01 | 0.77 (0.34–1.76) | 0.54 | 2.80 (2.04–3.84) | <0.01 | 0.91 (0.45–1.82) | 0.80 |
| Spontaneous bacterial peritonitis | 1.72 (1.10–2.70) | 0.01 | 1.17 (0.49–2.77) | 0.71 | 1.67 (1.12–2.49) | 0.01 | 1.15 (0.53–2.47) | 0.71 | 1.67 (1.16–2.39) | <0.01 | 1.01 (0.51–2.00) | 0.97 |
| Other | 0.48 (0.19–1.18) | 0.11 | 0.59 (0.29–1.21) | 0.15 | 0.70 (0.39–1.26) | 0.24 | ||||||
| Intra-abdominal infections | 1.12 (0.52–2.42) | 0.76 | 1.11 (0.56–2.19) | 0.75 | 0.96 (0.50–1.83) | 0.91 | ||||||
| Skin and soft tissue infections | 0.84 (0.34–2.07) | 0.71 | 0.77 (0.34–1.76) | 0.54 | 1.29 (0.71–2.32) | 0.39 | ||||||
| Upper respiratory tract infections | 0.32 (0.04–2.33) | 0.26 | 0.24 (0.03–1.77) | 0.16 | 0.78 (0.28–2.10) | 0.62 | ||||||
| Central nervous system infections | 3.57 (1.31–9.71) | 0.01 | 4.84 (1.38–16.93) | 0.01 | 3.13 (1.15–8.50) | 0.02 | 4.39 (1.28–15.04) | 0.01 | 2.73 (1.01–7.40) | 0.04 | 4.01 (1.19–13.57) | 0.02 |
| Osteomyelitis | 2.41 (0.33–17.33) | 0.38 | 2.04 (0.28–14.64) | 0.47 | 4.07 (1.00–16.45) | 0.04 | ||||||
CTP, Child–Turcotte–Pugh; MELD, Model for End-Stage Liver Disease; HR, hazard ratio; CI, confidence interval.
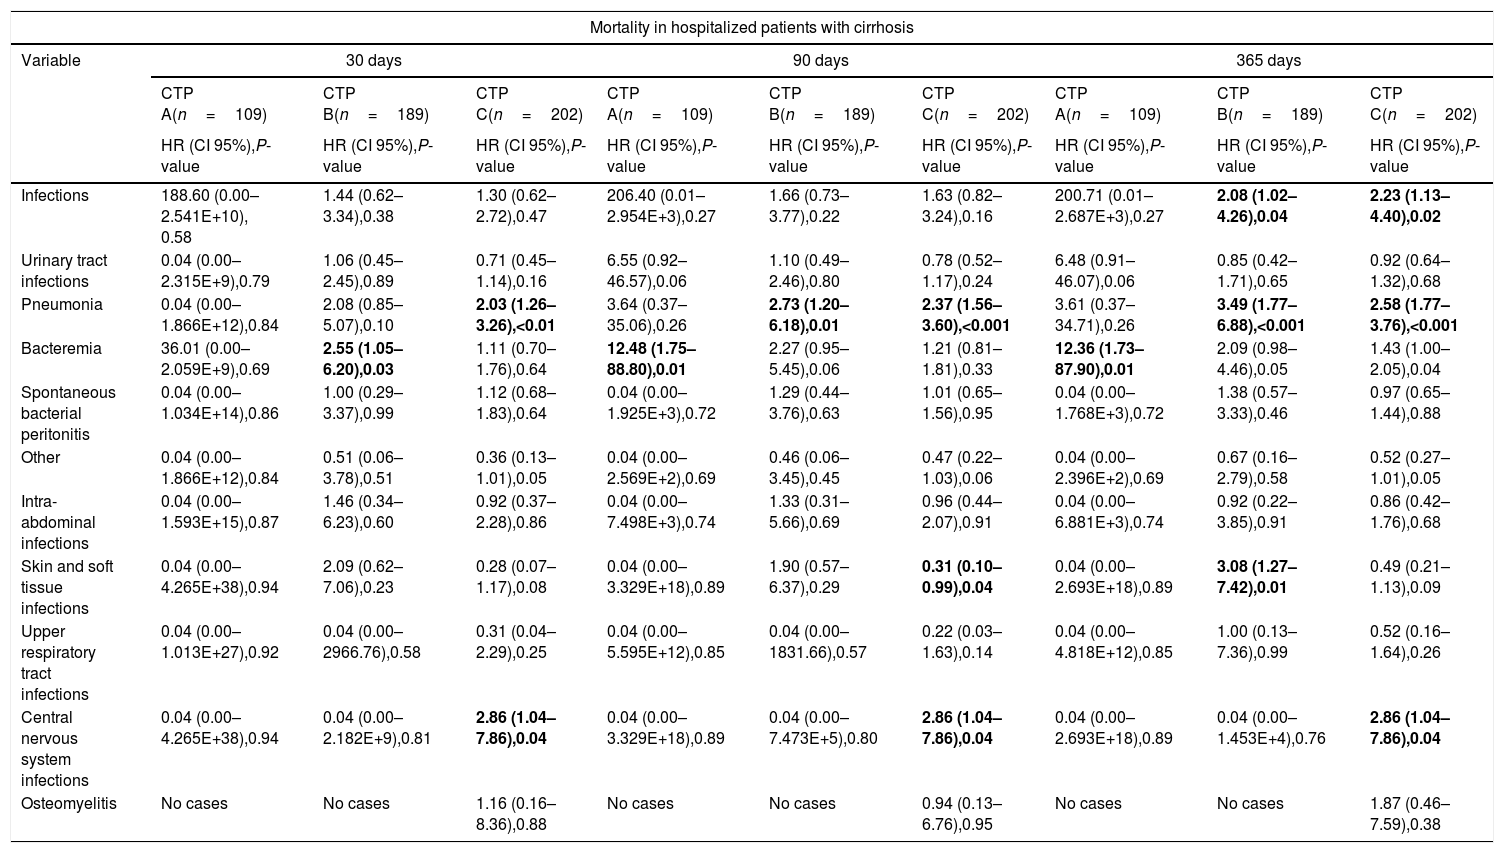
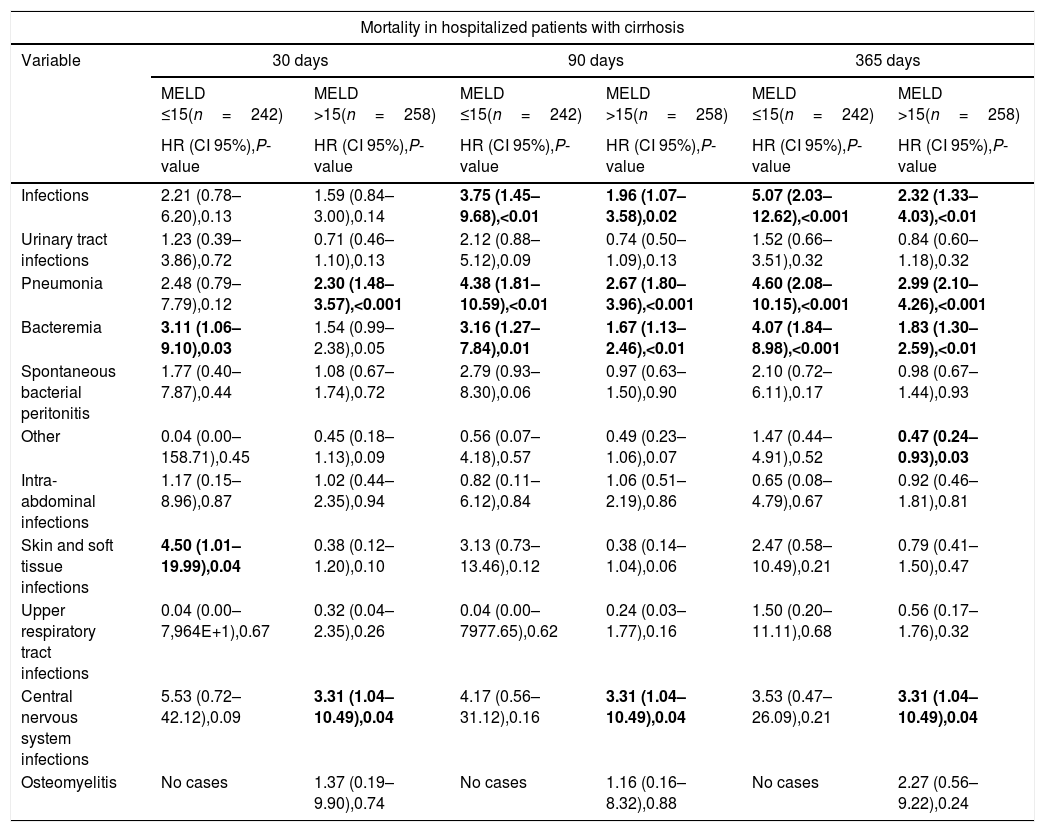
In the sub-group analyses stratified by the CTP and MELD scores, infectious complications were associated with increased mortality at the 1-year follow-up period in the subgroups with advanced stages of cirrhosis (CTP scores B and C), pneumonia was associated with increased mortality at the 3-months and 1-year follow-up periods in the sub-groups with early and intermediate stages of cirrhosis (CTP score B and MELD score <15), and at the three follow-up periods in the sub-groups with advanced stages of cirrhosis (CTP score C and MELD score >15), finally CNS infections were associated with increased mortality at the three follow-up periods in advanced stages of cirrhosis (CTP score C and MELD score >15) (Tables 6 and 7).
Univariate analysis of the impact of infectious complications in the mortality of hospitalized patients with cirrhosis at 30, 90 and 365 days of follow-up, stratified by Child–Turcotte–Pugh Score.
| Mortality in hospitalized patients with cirrhosis | |||||||||
|---|---|---|---|---|---|---|---|---|---|
| Variable | 30 days | 90 days | 365 days | ||||||
| CTP A(n=109) | CTP B(n=189) | CTP C(n=202) | CTP A(n=109) | CTP B(n=189) | CTP C(n=202) | CTP A(n=109) | CTP B(n=189) | CTP C(n=202) | |
| HR (CI 95%),P-value | HR (CI 95%),P-value | HR (CI 95%),P-value | HR (CI 95%),P-value | HR (CI 95%),P-value | HR (CI 95%),P-value | HR (CI 95%),P-value | HR (CI 95%),P-value | HR (CI 95%),P-value | |
| Infections | 188.60 (0.00–2.541E+10), 0.58 | 1.44 (0.62–3.34),0.38 | 1.30 (0.62–2.72),0.47 | 206.40 (0.01–2.954E+3),0.27 | 1.66 (0.73–3.77),0.22 | 1.63 (0.82–3.24),0.16 | 200.71 (0.01–2.687E+3),0.27 | 2.08 (1.02–4.26),0.04 | 2.23 (1.13–4.40),0.02 |
| Urinary tract infections | 0.04 (0.00–2.315E+9),0.79 | 1.06 (0.45–2.45),0.89 | 0.71 (0.45–1.14),0.16 | 6.55 (0.92–46.57),0.06 | 1.10 (0.49–2.46),0.80 | 0.78 (0.52–1.17),0.24 | 6.48 (0.91–46.07),0.06 | 0.85 (0.42–1.71),0.65 | 0.92 (0.64–1.32),0.68 |
| Pneumonia | 0.04 (0.00–1.866E+12),0.84 | 2.08 (0.85–5.07),0.10 | 2.03 (1.26–3.26),<0.01 | 3.64 (0.37–35.06),0.26 | 2.73 (1.20–6.18),0.01 | 2.37 (1.56–3.60),<0.001 | 3.61 (0.37–34.71),0.26 | 3.49 (1.77–6.88),<0.001 | 2.58 (1.77–3.76),<0.001 |
| Bacteremia | 36.01 (0.00–2.059E+9),0.69 | 2.55 (1.05–6.20),0.03 | 1.11 (0.70–1.76),0.64 | 12.48 (1.75–88.80),0.01 | 2.27 (0.95–5.45),0.06 | 1.21 (0.81–1.81),0.33 | 12.36 (1.73–87.90),0.01 | 2.09 (0.98–4.46),0.05 | 1.43 (1.00–2.05),0.04 |
| Spontaneous bacterial peritonitis | 0.04 (0.00–1.034E+14),0.86 | 1.00 (0.29–3.37),0.99 | 1.12 (0.68–1.83),0.64 | 0.04 (0.00–1.925E+3),0.72 | 1.29 (0.44–3.76),0.63 | 1.01 (0.65–1.56),0.95 | 0.04 (0.00–1.768E+3),0.72 | 1.38 (0.57–3.33),0.46 | 0.97 (0.65–1.44),0.88 |
| Other | 0.04 (0.00–1.866E+12),0.84 | 0.51 (0.06–3.78),0.51 | 0.36 (0.13–1.01),0.05 | 0.04 (0.00–2.569E+2),0.69 | 0.46 (0.06–3.45),0.45 | 0.47 (0.22–1.03),0.06 | 0.04 (0.00–2.396E+2),0.69 | 0.67 (0.16–2.79),0.58 | 0.52 (0.27–1.01),0.05 |
| Intra-abdominal infections | 0.04 (0.00–1.593E+15),0.87 | 1.46 (0.34–6.23),0.60 | 0.92 (0.37–2.28),0.86 | 0.04 (0.00–7.498E+3),0.74 | 1.33 (0.31–5.66),0.69 | 0.96 (0.44–2.07),0.91 | 0.04 (0.00–6.881E+3),0.74 | 0.92 (0.22–3.85),0.91 | 0.86 (0.42–1.76),0.68 |
| Skin and soft tissue infections | 0.04 (0.00–4.265E+38),0.94 | 2.09 (0.62–7.06),0.23 | 0.28 (0.07–1.17),0.08 | 0.04 (0.00–3.329E+18),0.89 | 1.90 (0.57–6.37),0.29 | 0.31 (0.10–0.99),0.04 | 0.04 (0.00–2.693E+18),0.89 | 3.08 (1.27–7.42),0.01 | 0.49 (0.21–1.13),0.09 |
| Upper respiratory tract infections | 0.04 (0.00–1.013E+27),0.92 | 0.04 (0.00–2966.76),0.58 | 0.31 (0.04–2.29),0.25 | 0.04 (0.00–5.595E+12),0.85 | 0.04 (0.00–1831.66),0.57 | 0.22 (0.03–1.63),0.14 | 0.04 (0.00–4.818E+12),0.85 | 1.00 (0.13–7.36),0.99 | 0.52 (0.16–1.64),0.26 |
| Central nervous system infections | 0.04 (0.00–4.265E+38),0.94 | 0.04 (0.00–2.182E+9),0.81 | 2.86 (1.04–7.86),0.04 | 0.04 (0.00–3.329E+18),0.89 | 0.04 (0.00–7.473E+5),0.80 | 2.86 (1.04–7.86),0.04 | 0.04 (0.00–2.693E+18),0.89 | 0.04 (0.00–1.453E+4),0.76 | 2.86 (1.04–7.86),0.04 |
| Osteomyelitis | No cases | No cases | 1.16 (0.16–8.36),0.88 | No cases | No cases | 0.94 (0.13–6.76),0.95 | No cases | No cases | 1.87 (0.46–7.59),0.38 |
CTP, Child–Turcotte–Pugh; HR, hazard ratio; CI, confidence interval.
Univariate analysis of the impact of infectious complications in the mortality of hospitalized patients with cirrhosis at 30, 90 and 365 days of follow-up, stratified by Model for End-Stage Liver Disease Score.
| Mortality in hospitalized patients with cirrhosis | ||||||
|---|---|---|---|---|---|---|
| Variable | 30 days | 90 days | 365 days | |||
| MELD ≤15(n=242) | MELD >15(n=258) | MELD ≤15(n=242) | MELD >15(n=258) | MELD ≤15(n=242) | MELD >15(n=258) | |
| HR (CI 95%),P-value | HR (CI 95%),P-value | HR (CI 95%),P-value | HR (CI 95%),P-value | HR (CI 95%),P-value | HR (CI 95%),P-value | |
| Infections | 2.21 (0.78–6.20),0.13 | 1.59 (0.84–3.00),0.14 | 3.75 (1.45–9.68),<0.01 | 1.96 (1.07–3.58),0.02 | 5.07 (2.03–12.62),<0.001 | 2.32 (1.33–4.03),<0.01 |
| Urinary tract infections | 1.23 (0.39–3.86),0.72 | 0.71 (0.46–1.10),0.13 | 2.12 (0.88–5.12),0.09 | 0.74 (0.50–1.09),0.13 | 1.52 (0.66–3.51),0.32 | 0.84 (0.60–1.18),0.32 |
| Pneumonia | 2.48 (0.79–7.79),0.12 | 2.30 (1.48–3.57),<0.001 | 4.38 (1.81–10.59),<0.01 | 2.67 (1.80–3.96),<0.001 | 4.60 (2.08–10.15),<0.001 | 2.99 (2.10–4.26),<0.001 |
| Bacteremia | 3.11 (1.06–9.10),0.03 | 1.54 (0.99–2.38),0.05 | 3.16 (1.27–7.84),0.01 | 1.67 (1.13–2.46),<0.01 | 4.07 (1.84–8.98),<0.001 | 1.83 (1.30–2.59),<0.01 |
| Spontaneous bacterial peritonitis | 1.77 (0.40–7.87),0.44 | 1.08 (0.67–1.74),0.72 | 2.79 (0.93–8.30),0.06 | 0.97 (0.63–1.50),0.90 | 2.10 (0.72–6.11),0.17 | 0.98 (0.67–1.44),0.93 |
| Other | 0.04 (0.00–158.71),0.45 | 0.45 (0.18–1.13),0.09 | 0.56 (0.07–4.18),0.57 | 0.49 (0.23–1.06),0.07 | 1.47 (0.44–4.91),0.52 | 0.47 (0.24–0.93),0.03 |
| Intra-abdominal infections | 1.17 (0.15–8.96),0.87 | 1.02 (0.44–2.35),0.94 | 0.82 (0.11–6.12),0.84 | 1.06 (0.51–2.19),0.86 | 0.65 (0.08–4.79),0.67 | 0.92 (0.46–1.81),0.81 |
| Skin and soft tissue infections | 4.50 (1.01–19.99),0.04 | 0.38 (0.12–1.20),0.10 | 3.13 (0.73–13.46),0.12 | 0.38 (0.14–1.04),0.06 | 2.47 (0.58–10.49),0.21 | 0.79 (0.41–1.50),0.47 |
| Upper respiratory tract infections | 0.04 (0.00–7,964E+1),0.67 | 0.32 (0.04–2.35),0.26 | 0.04 (0.00–7977.65),0.62 | 0.24 (0.03–1.77),0.16 | 1.50 (0.20–11.11),0.68 | 0.56 (0.17–1.76),0.32 |
| Central nervous system infections | 5.53 (0.72–42.12),0.09 | 3.31 (1.04–10.49),0.04 | 4.17 (0.56–31.12),0.16 | 3.31 (1.04–10.49),0.04 | 3.53 (0.47–26.09),0.21 | 3.31 (1.04–10.49),0.04 |
| Osteomyelitis | No cases | 1.37 (0.19–9.90),0.74 | No cases | 1.16 (0.16–8.32),0.88 | No cases | 2.27 (0.56–9.22),0.24 |
MELD, Model for End-Stage Liver Disease; HR, hazard ratio; CI, confidence interval.
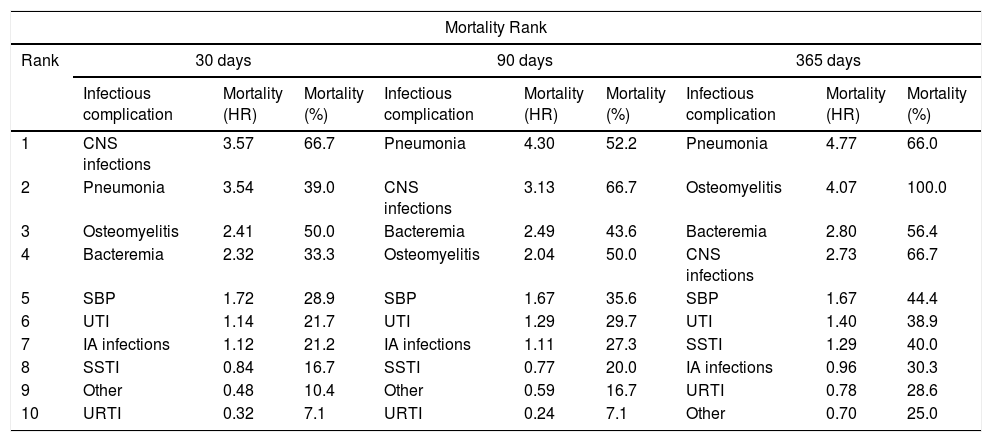
The mortality of the different infectious complications in patients with cirrhosis varied throughout the three different follow-up periods. Those with higher mortality were CNS infections, pneumonia and osteomyelitis at 30 days of follow-up, pneumonia, CNS infections and bacteremia at 60 days of follow-up, and pneumonia, osteomyelitis and bacteremia at 365 days of follow-up (Table 8).
Mortality rank of infectious complications in hospitalized patients with cirrhosis at 30, 90 and 365 days of follow-up.
| Mortality Rank | |||||||||
|---|---|---|---|---|---|---|---|---|---|
| Rank | 30 days | 90 days | 365 days | ||||||
| Infectious complication | Mortality (HR) | Mortality (%) | Infectious complication | Mortality (HR) | Mortality (%) | Infectious complication | Mortality (HR) | Mortality (%) | |
| 1 | CNS infections | 3.57 | 66.7 | Pneumonia | 4.30 | 52.2 | Pneumonia | 4.77 | 66.0 |
| 2 | Pneumonia | 3.54 | 39.0 | CNS infections | 3.13 | 66.7 | Osteomyelitis | 4.07 | 100.0 |
| 3 | Osteomyelitis | 2.41 | 50.0 | Bacteremia | 2.49 | 43.6 | Bacteremia | 2.80 | 56.4 |
| 4 | Bacteremia | 2.32 | 33.3 | Osteomyelitis | 2.04 | 50.0 | CNS infections | 2.73 | 66.7 |
| 5 | SBP | 1.72 | 28.9 | SBP | 1.67 | 35.6 | SBP | 1.67 | 44.4 |
| 6 | UTI | 1.14 | 21.7 | UTI | 1.29 | 29.7 | UTI | 1.40 | 38.9 |
| 7 | IA infections | 1.12 | 21.2 | IA infections | 1.11 | 27.3 | SSTI | 1.29 | 40.0 |
| 8 | SSTI | 0.84 | 16.7 | SSTI | 0.77 | 20.0 | IA infections | 0.96 | 30.3 |
| 9 | Other | 0.48 | 10.4 | Other | 0.59 | 16.7 | URTI | 0.78 | 28.6 |
| 10 | URTI | 0.32 | 7.1 | URTI | 0.24 | 7.1 | Other | 0.70 | 25.0 |
HR, hazard ratio; CNS, central nervous system; SBP, spontaneous bacterial peritonitis; UTI, urinary tract infections; IA, intra-abdominal; SSTI, skin and soft tissue infections; URTI, upper respiratory tract infections.
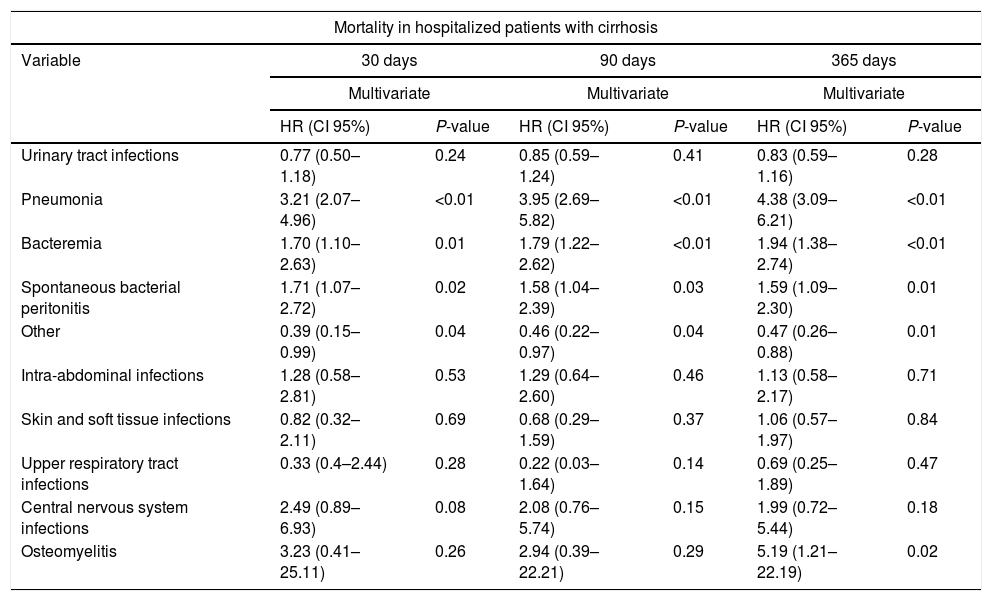
In a secondary multivariate analysis, introducing all the different infectious complications in the same model, pneumonia, bacteremia, SBP and other presented increased mortality (Table 9).
Multivariate analysis of the impact of the different infectious complications in the mortality of hospitalized patients with cirrhosis at 30, 90 and 365 days of follow-up.
| Mortality in hospitalized patients with cirrhosis | ||||||
|---|---|---|---|---|---|---|
| Variable | 30 days | 90 days | 365 days | |||
| Multivariate | Multivariate | Multivariate | ||||
| HR (CI 95%) | P-value | HR (CI 95%) | P-value | HR (CI 95%) | P-value | |
| Urinary tract infections | 0.77 (0.50–1.18) | 0.24 | 0.85 (0.59–1.24) | 0.41 | 0.83 (0.59–1.16) | 0.28 |
| Pneumonia | 3.21 (2.07–4.96) | <0.01 | 3.95 (2.69–5.82) | <0.01 | 4.38 (3.09–6.21) | <0.01 |
| Bacteremia | 1.70 (1.10–2.63) | 0.01 | 1.79 (1.22–2.62) | <0.01 | 1.94 (1.38–2.74) | <0.01 |
| Spontaneous bacterial peritonitis | 1.71 (1.07–2.72) | 0.02 | 1.58 (1.04–2.39) | 0.03 | 1.59 (1.09–2.30) | 0.01 |
| Other | 0.39 (0.15–0.99) | 0.04 | 0.46 (0.22–0.97) | 0.04 | 0.47 (0.26–0.88) | 0.01 |
| Intra-abdominal infections | 1.28 (0.58–2.81) | 0.53 | 1.29 (0.64–2.60) | 0.46 | 1.13 (0.58–2.17) | 0.71 |
| Skin and soft tissue infections | 0.82 (0.32–2.11) | 0.69 | 0.68 (0.29–1.59) | 0.37 | 1.06 (0.57–1.97) | 0.84 |
| Upper respiratory tract infections | 0.33 (0.4–2.44) | 0.28 | 0.22 (0.03–1.64) | 0.14 | 0.69 (0.25–1.89) | 0.47 |
| Central nervous system infections | 2.49 (0.89–6.93) | 0.08 | 2.08 (0.76–5.74) | 0.15 | 1.99 (0.72–5.44) | 0.18 |
| Osteomyelitis | 3.23 (0.41–25.11) | 0.26 | 2.94 (0.39–22.21) | 0.29 | 5.19 (1.21–22.19) | 0.02 |
HR, hazard ratio; CI, confidence interval.
From the 309 patients who presented any infectious complication, 139 patients presented two or more different infectious complications, we also evaluated if patients who presented two or more infectious complications compared to patients who presented only one infectious complication presented higher mortality rates in the follow-up periods, however, we did not observe any statistically significant difference in any of the three follow-up periods evaluated.
4DiscussionInfectious complications in patients with decompensated cirrhosis have generated great interest recently. This is because they have been associated with a decrease in short-term survival, frequently, causing the death of these patients before they can achieve liver transplantation. In recent studies, bacterial infections have been independently associated with an increase in mortality, and on the other hand, they have been identified as triggers of the acute-on-chronic liver failure syndrome, which is also associated with an increase in mortality [6,12]. However, to the best of our knowledge, this is one of the first studies that evaluate the impact of the different infectious complications on the mortality of these patients.
Regarding the baseline characteristics of the patients, those with a more advanced liver disease (CTP C and higher MELD score), were more likely to develop infectious complications, as previously demonstrated in other studies [6,7]. On the other hand, patients with cirrhosis secondary to non-alcoholic fatty liver disease seemed to be less prone to develop infectious complications. However, this seems to be explained by the fact that there were fewer cases with advanced stages of cirrhosis in this sub-group of patients, since only 13 (32.5%) had a CTP score C and 17 (42%) had a MELD score >15.
In the survival analysis, infectious complications in general were associated with an increase in mortality in the three follow-up periods, however, adjusting to the scales of severity of liver disease, this association was lost in all cases, meaning that the increase in mortality might be attributed to the CTP score and MELD score, rather than to the infectious complications. This last result is contradictory to other recently published were infectious complications decreased survival in cirrhotic patients irrespective of liver disease severity [7]. When we analyzed infectious complications in an individual way, pneumonia, SBP, bacteremia and CNS infections presented higher mortality rates in the three follow-up periods, and after performing the multivariate analysis adjusted to the severity scales of liver disease, only pneumonia in the 1-year follow-up period and CNS infections in the three follow-up periods remained with increased mortality. To elucidate the influence of the prognostic scales on the mortality attributed to the infectious complications, an analysis stratified by the different categories of these prognostic scales was performed. In this analysis infectious complications were associated with increased mortality at the 1-year follow-up period in patients with intermediate and advanced stages of cirrhosis (CTP scores B and C), pneumonia increased mortality at the 3-months and 1-year follow-up periods in patients with early and intermediate stages of cirrhosis (CTP score B and MELD score <15), and at the three follow-up periods in patients with advanced stages of cirrhosis (CTP score C and MELD score >15), and CNS infections increased mortality at the three follow-up periods in patients with advanced stages of cirrhosis (CTP score C and MELD score >15). To date it is known that patients with cirrhosis are more likely to develop infections, and that these also present with greater severity, this due to multiple factors intrinsic to the liver disease [31]. By the results of our study, It seems that the patients with a more advanced liver disease, this determined by the CTP and MELD scores, present greater rates of infectious complications, and that these infections increase short and long-term mortality in an independent way, since, in the stratified analysis, this is demonstrated by the increased mortality attributed to the infections in general and some particular infectious complications within some of the categories of the CTP and MELD scores as previously mentioned.
On the other hand, due to the fact that some patients presented more than one infectious complication during their hospitalization, a multivariate analysis was performed including all the infectious complications in the same model to evaluate possible interactions between them, and only pneumonia, bacteremia, SBP and other infections presented an independent association with the increased mortality. Finally, it is worth highlighting the high prevalence of infections from multi-drug-resistant microorganisms, particularly in the case of infectious complications that had some association with mortality, such as pneumonia in which 25% of S. aureus isolates were methicillin-resistant, SBP in which 25% of E. coli isolates were producers of extended-spectrum beta-lactamases and bacteremia in which 33.3% of isolates of S. aureus were methicillin-resistant and 15.6% of isolates of E. coli were producers of extended-spectrum beta-lactamases. This high rate of infections by multi-drug resistant microorganisms could have been related to the increased mortality from certain infections.
These results suggest starting broad-spectrum antibiotic treatment in patients with decompensated cirrhosis with an infectious complication such as pneumonia, bacterial spontaneous peritonitis or bacteremia, considering coverage for methicillin-resistant S. aureus and gram-negative bacteria producers of extended-spectrum beta-lactamases respectively. On the other hand, to always maintain high clinical suspicion for the diagnosis of infections of the CNS, as these seem to be particularly harmful.
This is one of the first studies evaluating the impact of the different infectious complications on the mortality of hospitalized patients with cirrhosis in an independent way, with the strength of achieving a sample size of 500 patients, and also, the fact that the infectious complications were categorized according to recent clinical practice guidelines. On the other hand, none of the patients included in this study underwent liver transplantation during the follow-up period; therefore, this study reflects the natural history of the disease without being influenced by liver transplantation, which would be expected to improve survival in this subset of patients. As weaknesses in our study, first, it was a retrospective study. Secondly, we did not analyze whether the fact that infections were community acquired, nosocomial or health-care associated could have had some influence on the survival outcome. Nor do we analyze if the length of hospitalization or any of the diagnostic or therapeutic procedures performed in some of the patients included in this study could have influenced the incidence of the different infectious complications, and if this in turn could have influenced the mortality analysis. Also, we did not analyze if the severity of each infectious complication could have had some influence in the survival outcome. Further, we analyzed all-cause mortality as primary outcome without taking into account the cause of death. And finally, in some infectious complications, the yield of the cultures was very low, in such a way that the proportions presented in relation to the microbiological isolates and the resistances to antibiotics could be not truly representative.
As topics for future research, it would be interesting, to evaluate if the severity of the infectious complications or if the classification of these as community acquired, nosocomial or health-care associated, present different survival outcomes. Also if the length of hospitalization or diagnostic or therapeutic procedures could influence the incidence of infectious complications and survival outcomes.
5ConclusionThe infectious complications in hospitalized patients with cirrhosis are associated with an increased short-term mortality; however, it seems to be related to the severity of the liver disease. Notwithstanding, pneumonia and CNS infections seem to increase mortality in an independent way, indicating that severity might be related to the location of the infectious complications.AbbreviationsCNS
Central nervous system
CTPChild–Turcotte–Pugh
MELDModel for End-Stage Liver Disease
SBPSpontaneous bacterial peritonitis
FundingThis research did not receive any specific grant from funding agencies in the public, commercial, or not-for-profit sectors.
Conflict of interestNone.


