We read with great interest the study conducted by Hirsh D. The authors aim to explore the association between diabetes and liver fibrosis and steatosis in a primary care population [1]. In this study involving 437 participants, the authors found that diabetes was associated with liver fibrosis and steatosis in a primary care population after adjusting for independent predictors. After reading this article carefully, we noted that the following issues need to be carefully considered.
First, as described, this study aims to explore the association between diabetes and liver fibrosis and steatosis. However, it is indistinct whether those patients included in this study were new-onset diabetes patients or previously diagnosed with diabetes. There is no doubt that the duration of diabetes is related to the severity of liver fibrosis and steatosis, and patients with a longer duration of diabetes will inevitably have a higher degree of liver fibrosis and steatosis than patients with a short duration [2,3]. Therefore, it is recommended to provide the duration of diabetes to relieve readers’ doubts. On the other hand, for the diabetic patients included in this study, were their blood glucose levels controlled within the range recommended by the current guidelines? After all, poor glycemic control could also lead to worsening liver fibrosis [4,5]. Thus, the detailed definition of inclusion criteria and exclusion criteria is helpful to reduce confounding bias.
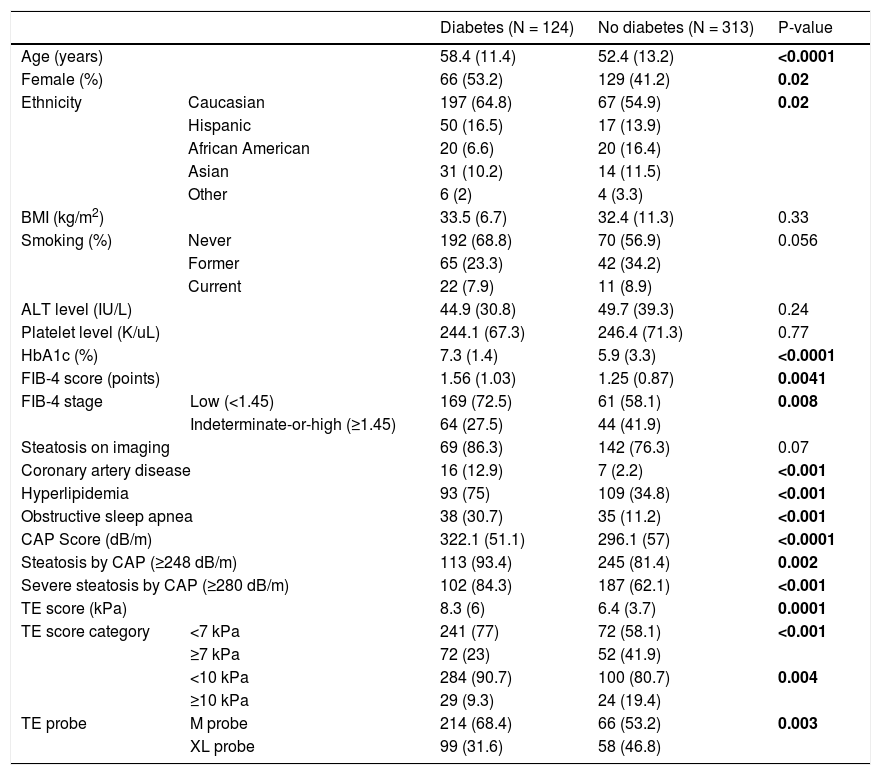
Second, as depicted in Table 1, there were significant differences in some baseline characteristics between diabetic and non diabetic patients. For example, the proportion of female diabetes is significantly higher than that of non-diabetics (53.2% versus 41.2%, P = 0.02), coronary artery disease, hyperlipidemia and obstructive sleep apnea (OAP) in diabetic patients is also considerably higher than that of non-diabetics. Additionally, previous studies have exhibited sex differences in the degree of liver fibrosis, and EZH1 and EZH2 might cause it [6]. Similarly, some scholars have concluded that OAP is associated with liver fibrosis severity [7]. However, in this study, those variables with significant differences between the groups (Table 1) were not included in the multivariate regression analysis for adjustment. There was no explanation for this adjustment strategy, which is highly confusing.
Baseline characteristics of study population.
| Diabetes (N = 124) | No diabetes (N = 313) | P-value | |||
|---|---|---|---|---|---|
| Age (years) | 58.4 (11.4) | 52.4 (13.2) | <0.0001 | ||
| Female (%) | 66 (53.2) | 129 (41.2) | 0.02 | ||
| Ethnicity | Caucasian | 197 (64.8) | 67 (54.9) | 0.02 | |
| Hispanic | 50 (16.5) | 17 (13.9) | |||
| African American | 20 (6.6) | 20 (16.4) | |||
| Asian | 31 (10.2) | 14 (11.5) | |||
| Other | 6 (2) | 4 (3.3) | |||
| BMI (kg/m2) | 33.5 (6.7) | 32.4 (11.3) | 0.33 | ||
| Smoking (%) | Never | 192 (68.8) | 70 (56.9) | 0.056 | |
| Former | 65 (23.3) | 42 (34.2) | |||
| Current | 22 (7.9) | 11 (8.9) | |||
| ALT level (IU/L) | 44.9 (30.8) | 49.7 (39.3) | 0.24 | ||
| Platelet level (K/uL) | 244.1 (67.3) | 246.4 (71.3) | 0.77 | ||
| HbA1c (%) | 7.3 (1.4) | 5.9 (3.3) | <0.0001 | ||
| FIB-4 score (points) | 1.56 (1.03) | 1.25 (0.87) | 0.0041 | ||
| FIB-4 stage | Low (<1.45) | 169 (72.5) | 61 (58.1) | 0.008 | |
| Indeterminate-or-high (≥1.45) | 64 (27.5) | 44 (41.9) | |||
| Steatosis on imaging | 69 (86.3) | 142 (76.3) | 0.07 | ||
| Coronary artery disease | 16 (12.9) | 7 (2.2) | <0.001 | ||
| Hyperlipidemia | 93 (75) | 109 (34.8) | <0.001 | ||
| Obstructive sleep apnea | 38 (30.7) | 35 (11.2) | <0.001 | ||
| CAP Score (dB/m) | 322.1 (51.1) | 296.1 (57) | <0.0001 | ||
| Steatosis by CAP (≥248 dB/m) | 113 (93.4) | 245 (81.4) | 0.002 | ||
| Severe steatosis by CAP (≥280 dB/m) | 102 (84.3) | 187 (62.1) | <0.001 | ||
| TE score (kPa) | 8.3 (6) | 6.4 (3.7) | 0.0001 | ||
| TE score category | <7 kPa | 241 (77) | 72 (58.1) | <0.001 | |
| ≥7 kPa | 72 (23) | 52 (41.9) | |||
| <10 kPa | 284 (90.7) | 100 (80.7) | 0.004 | ||
| ≥10 kPa | 29 (9.3) | 24 (19.4) | |||
| TE probe | M probe | 214 (68.4) | 66 (53.2) | 0.003 | |
| XL probe | 99 (31.6) | 58 (46.8) | |||
BMI: body mass index, ALT: alanine aminotransferase, HbA1c: hemoglobin A1c, CAP: controlled attenuation parameter, TE: transient elastography.
Bold values signifies P value <0.05.
None.
Conflict of interestThe authors have no conflicts of interest to declare.


