


Non-alcoholic fatty liver disease (NAFLD) is the primary contributor to persistent chronic liver disease which derives cardiovascular disease, malignancies, and related mortality. There is an association between red blood cell (RBC) indices and the incidence of NAFLD, but the causal relationship has not been determined. We aimed to investigate the association through prospective and Mendelian randomization (MR) analyses.
Materials and MethodsThe prospective study involved 237,016 participants from the UK Biobank. We employed Cox proportional hazard models and restricted cubic spline models to assess the association between RBC index and NAFLD, and used two-sample MR analysis to identify any causality.
ResultsOver a mean follow-up of 8.64 years, 2,894 participants from UK Biobank developed NAFLD. The prospective study showed significant associations between high levels of hemoglobin (HGB) (hazard ratio [HR], 1.41; 95 % confidence intervals [CI] 1.24–1.60; P < 0.001), RBC count (HR, 1.20; 95 % CI, 1.07–1.36; P = 0.003) and an increased risk of NAFLD. MR analysis indicated a causal relationship between high HGB levels and NAFLD risk (Odds ratio [OR], 1.55; 95 % CI, 1.11–2.18; P = 0.010). However, there was no observed causal relationship between RBC count and NAFLD.
ConclusionsThis prospective and MR analysis demonstrated a positive causal relationship between HGB levels and NAFLD. HGB can predict the risk of NAFLD, which can potentially be used as a large-scale non-invasive tool to dynamically monitor the occurrence and development of NAFLD.
Non-alcoholic fatty liver disease (NAFLD) is the primary contributor to persistent chronic liver disease and represents a significant global health challenge, affecting approximately 25–33 % of the population [1–6]. This condition is characterized by the excessive accumulation of fat in the liver, which is directly related to metabolic risk factors such as insulin resistance [7–9]. Individuals with NAFLD face a higher risk of subsequent cardiovascular disease, malignancies, and associated mortality [10]. Given the high prevalence and the lack of effective treatments, it is of crucial to identify the risk factors for NAFLD and screen the population at high risk in the early stages.
Previous studies have found the association between red blood cell (RBC) indices and risk of NAFLD [11,12]. A study found that an elevated RBC count was independently associated with a higher risk and increased severity of NAFLD [13]. A Chinese cohort study indicated a positive association between high hemoglobin (HGB) level and the risk of developing NAFLD [12]. A retrospective study found that increased HGB level and RBC distribution width (RDW) were associated with the risk of NAFLD [14,15]. However, most of these studies were retrospective and could be confounded by many factors, resulting in spurious associations. The causal relationship between RBC indices and NAFLD remains uncertain.
Genome-wide association studies (GWASs) have identified numerous single nucleotide polymorphisms (SNPs) associated with NAFLD-related traits and circulating RBC levels, which offers an opportunity to investigate potential causal relationships between RBC indices and NAFLD through Mendelian randomization (MR). MR analysis uses the characteristics of human genome, mainly its random allocation and immutable nature, to make causal deductions on the relationship between exposure and disease development [16]. It could be thought of as comparable with randomised controlled trials with random assortment of genotypes acting as a randomisation process to allocate individuals to different levels of exposure. Specifically, we used a two-sample MR design obtaining summary statistics for SNPs of RBC indices and applying them to summary statistics from a GWAS of NAFLD [17,18]. To our knowledge, there has been no MR study exploring the causal relationship between RBC indices and NAFLD.
The association between RBC indices and NAFLD was investigated using prospective analysis and two-sample MR analysis based on five RBC indices: hemoglobin (HGB), RBC count, hemoglobin concentration (MCHC), mean corpuscular volume (MCV), and RDW.
2Materials and methods2.1Data source for the prospective studyThe UK Biobank is a population-based prospective cohort with a baseline age of 40–69 years and more than 500,000 participants. For detailed information regarding the UK Biobank Protocol, please refer to the online resource (http://www.ukbiobank.ac.uk). This research was conducted using application number 92,668. Participants were excluded based on the following criteria: participants without diagnostic data, participants with missing baseline data, participants with pre-existing liver diseases at baseline, and participants who developed NAFLD during the first 2 years of follow-up.
2.2.Definition of NAFLDThe diagnosis of NAFLD and other liver diseases was based on The International Statistical Classification of Diseases and Related Health Problems, 10th Revision (ICD-10). Detailed ICD-10 codes are provided in Supplemental Table 1.
2.3RBC indices and other covariatesRBC indices and other covariates were obtained at baseline visit through blood sample analysis. The RBC indices included HGB, RBC count, RDW, mean corpuscular MCHC, and MCV. According to the World Health Organization criteria, anemia was classified as HGB <13 g/dL for males and <12 g/dL for females. At baseline, age was determined by date of birth, and self-reported sex was recorded. Body mass index (BMI) was calculated based on height and weight measurements taken at baseline. Physical exercise was categorized as either “yes” or “no,” depending on whether the metabolic equivalent task scores indicated activity levels exceeding moderate/vigorous at baseline. The frequency of alcohol intake was also self-reported at baseline and categorized into 5 categories: daily/almost daily, 3–4 times a week, once/twice a week, 1–3 times a month, special occasions only and never. Blood samples collected at recruitment were used to measure alanine aminotransferase, aspartate aminotransferase, albumin, triglyceride (TG), high-density lipoprotein (HDL), low-density lipoprotein (LDL), cholesterol (CHOL), and glycated hemoglobin (HbA1c) levels. A cumulative dietary risk factor score was applied, ranging from 0 (most healthy) to 9 (least healthy). This score was derived from 9-food items based on current UK guidelines using baseline data and has been described elsewhere [19].
2.4Data source of MR analysisSummary-level data (i.e., beta coefficient and corresponding standard error) for HGB, RBC count, MCHC, MCV, and RDW were extracted from the GWAS conducted by the UK Biobank. Summary-level data on the association of exposure-associated SNPs with NAFLD were extracted from the GWAS conducted by Finngen. Detailed information on the summary-level data is provided in Supplemental Table 2.
2.5Instrumental variable selectionFirst, we obtained SNPs strongly associated with the exposure (P < 5 × 10⁻⁸), and palindrome SNPs were excluded from our study. SNPs in linkage disequilibrium (defined as r 2 > 0.01 or clump distance <10,000 kb) with weaker associations with the exposure were removed. The PhenoScanner database (http://www. phenoscaner. medschl. cam. acclusion; accessed on July 15, 2023) was used to manually screen and eliminate SNPs related to confounding factors (specifically BMI, blood lipids, and iron state) and NAFLD outcomes. Data were harmonized to exclude ambiguous SNPs with non-concordant alleles. Finally, we identified 197 SNPs related to hemoglobin, 45 related to RBC count, 10 related to MCV, 7 related to MCHC, and 6 related to RDW. Detailed information on the SNPs used is presented in Supplemental Tables 3–7.
2.6Statistical analysesCategorical variables are expressed as numbers and percentages, while continuous variables are expressed as mean ± standard deviation. Prospective analyses involved the use of Cox regression models to calculate hazard ratios (HRs) and their corresponding 95 % confidence intervals (CIs) for the association between RBC indices and the risk of NAFLD. The non-linear relationship between the RBC indices and NAFLD was assessed using a restricted cubic spline based on Cox models with adjusted covariates. We applied four models for adjustment: Model 1 was a crude model; Model 2 was adjusted for age and sex; Model 3 was adjusted for physical exercise and BMI based on Model 2; and Model 4 was adjusted for aspartate aminotransferase, alanine aminotransferase, TG, HDL, LDL, CHOL, and HbA1c based on Model 3. In order to avoid the impact of lifestyle factors on the relationship between RBC, HGB and NAFLD, we further adjusted the dietary risk factor score and alcohol intake frequency for these two indicators.
The “TwoSampleMR” R package was used for two-sample MR analysis between exposures and outcomes. Inverse-variance weighted (IVW) random effects analysis, which provides the most precise estimates by assuming that all SNPs are valid instruments, was used as the main analytical method. The MR–Egger, weighted medians, and MR pleiotropy residual sum and outlier text (MR-PRESSO) tests were used as supplementary analytical methods. MR–Egger regression was used to detect and adjust for pleiotropy, although its estimation accuracy is typically low [20]. MR-PRESSO was used to correct horizontal pleiotropy via outlier removal. A significant result with the IVW method (P < 0.05), even in the absence of significant results from other methods and with no identified pleiotropy or heterogeneity, was considered positive, provided that the beta values from the other methods were in the same direction [21].
Several sensitivity analyses were used to detect and correct for pleiotropy in the causal estimates. Cochran's Q was computed to quantify heterogeneity across the individual causal effects, with P ≤ 0.05 indicating the presence of pleiotropy and consequently necessitating the use of random-effects IVW MR analysis [22,23]. The Egger intercept test was used to indicate the presence of directional pleiotropy [24]. Leave-one-SNP-out analysis was used to identify SNPs with a potential impact and to assess the reliability of the results [25]. All statistical analyses were performed using the R software (version 4.2.2; R Foundation, Vienna, Austria).
2.7Ethical statementThe UK Biobank study was approved by the Northwest Multi-Centre Research Ethics Committee and all participants provided written informed consent to participate in the UK Biobank study. The study protocol is available online (http://www.ukbiobank.ac.uk/). This research was conducted using the application number 92,668. All participants provided written informed consent to participate in the UK Biobank study.
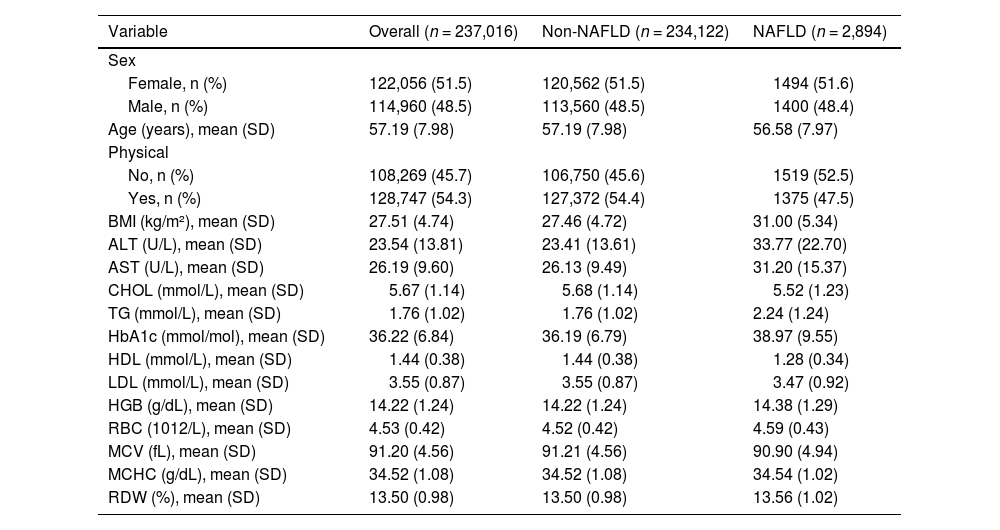
3Results3.1Baseline characteristicsAfter excluding individuals who did not meet the inclusion criteria, 237,016 participants from the UK Biobank were included in this prospective study. A flowchart illustrating the study design is shown in Supplemental Figure 1. The baseline characteristics stratified by NAFLD status are shown in Table 1. Overall, the mean age of participants was 57.19 ± 7.98 years; 114,960 (48.5 %) were males, and 122,056 (51.5 %) were females. Over a mean follow-up period of 8.64 years, 2,894 participants developed NAFLD. Participants with NAFLD had notably higher BMI values (31.00 ± 5.34 kg/m²). Significant differences in laboratory parameters were also observed between the two groups. For example, patients with NAFLD exhibited elevated levels of serum liver function-related biomarkers, TG, HbA1c, and HGB.
Baseline characteristics of the UK Biobank participants by NAFLD status.
| Variable | Overall (n = 237,016) | Non-NAFLD (n = 234,122) | NAFLD (n = 2,894) |
|---|---|---|---|
| Sex | |||
| Female, n (%) | 122,056 (51.5) | 120,562 (51.5) | 1494 (51.6) |
| Male, n (%) | 114,960 (48.5) | 113,560 (48.5) | 1400 (48.4) |
| Age (years), mean (SD) | 57.19 (7.98) | 57.19 (7.98) | 56.58 (7.97) |
| Physical | |||
| No, n (%) | 108,269 (45.7) | 106,750 (45.6) | 1519 (52.5) |
| Yes, n (%) | 128,747 (54.3) | 127,372 (54.4) | 1375 (47.5) |
| BMI (kg/m²), mean (SD) | 27.51 (4.74) | 27.46 (4.72) | 31.00 (5.34) |
| ALT (U/L), mean (SD) | 23.54 (13.81) | 23.41 (13.61) | 33.77 (22.70) |
| AST (U/L), mean (SD) | 26.19 (9.60) | 26.13 (9.49) | 31.20 (15.37) |
| CHOL (mmol/L), mean (SD) | 5.67 (1.14) | 5.68 (1.14) | 5.52 (1.23) |
| TG (mmol/L), mean (SD) | 1.76 (1.02) | 1.76 (1.02) | 2.24 (1.24) |
| HbA1c (mmol/mol), mean (SD) | 36.22 (6.84) | 36.19 (6.79) | 38.97 (9.55) |
| HDL (mmol/L), mean (SD) | 1.44 (0.38) | 1.44 (0.38) | 1.28 (0.34) |
| LDL (mmol/L), mean (SD) | 3.55 (0.87) | 3.55 (0.87) | 3.47 (0.92) |
| HGB (g/dL), mean (SD) | 14.22 (1.24) | 14.22 (1.24) | 14.38 (1.29) |
| RBC (1012/L), mean (SD) | 4.53 (0.42) | 4.52 (0.42) | 4.59 (0.43) |
| MCV (fL), mean (SD) | 91.20 (4.56) | 91.21 (4.56) | 90.90 (4.94) |
| MCHC (g/dL), mean (SD) | 34.52 (1.08) | 34.52 (1.08) | 34.54 (1.02) |
| RDW (%), mean (SD) | 13.50 (0.98) | 13.50 (0.98) | 13.56 (1.02) |
NAFLD: non-alcoholic fatty liver disease; BMI: body mass index; AST: aspartate aminotransferase; ALT: alanine aminotransferase; CHOL: total cholesterol; HDL: high-density lipoprotein; LDL: low-density lipoprotein; TG:triglyceride; HbA1c: glycated haemoglobin; RBC: red blood cell count; HGB: haemoglobin; RDW: Red blood cell distribution width; MCHC: mean corpuscular haemoglobin concentration; MCV: mean corpuscular volume.
This prospective study investigated the relationship between RBC indices and the incidence of NAFLD using four different Cox models (Fig. 1and Supplemental Table 8). In Model 1, elevated HGB levels (HR 1.12, 95 % CI 1.08–1.15, P < 0.001), RBC count (HR 1.51, 95 % CI 1.39–1.65, P < 0.001), and RDW (HR 1.06, 95 % CI 1.02–1.09, P = 0.002) were associated with higher NAFLD incidence. In Model 4, elevated HGB levels (HR 1.11, 95 % CI 1.08–1.16, P< 0.001) and RBC count (HR 1.25, 95 % CI 1.13–1.38, P < 0.001) remained associated with higher NAFLD incidence. However, there was no significant association between MCV, MCHC, RDW, and anemia and the incidence of NAFLD in Model 4 (P > 0.05).

We identified linear relationships between HGB (P for non-linearity = 0.200; Supplemental Figure 2A) and RBC count (P for non-linearity = 0.186; Supplemental Figure 2B) with incident NAFLD. As HGB and RBC count increased, the risk of NAFLD also increased. Non-linear relationships were observed between MCV (non-linear P = 0.002; Supplemental Figure 2D), RDW (non-linear P = 0.001; Supplemental Figure 2E), and the incidence of NAFLD.
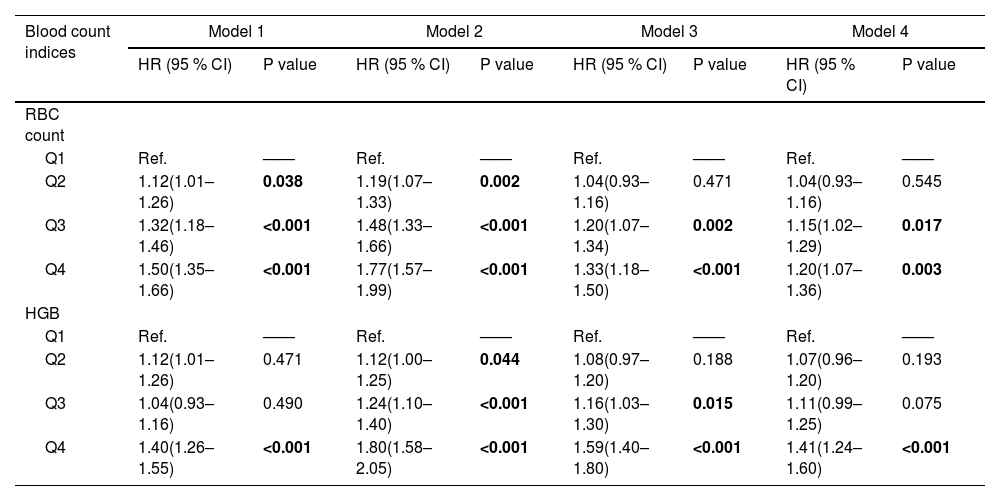
To further assess the relationship, we divided the RBC count and HGB levels into quartiles based on the sample distribution and analyzed the association between them and the risk of NAFLD based on different models. For RBC count, the adjusted HRs for quartiles 3 and 4 were 1.15 (95 % CI 1.02–1.29; P = 0.017) and 1.20 (95 % CI 1.07–1.36; P = 0.003) respectively. For HGB, the adjusted HR for quartile 4 was 1.41 (95 % CI 1.24–1.60; P < 0.001) (Table 2). To avoid the impact of lifestyle factors on the relationship between RBC, HGB and NAFLD, we further adjusted the dietary risk factor score and alcohol intake frequency for these two indicators (Supplemental Table 9). It can be seen that higher RBC (HR 1.20, 95 % CI 1.08–1.132, P < 0.001) and higher HGB (HR 1.51, 95 % CI 1.35–1.68, P < 0.001) is still associated with the incidence of NAFLD.
Hazard ratios (95 % CI) of NAFLD across quartiles of HGB and RBC in prospective study.
| Blood count indices | Model 1 | Model 2 | Model 3 | Model 4 | ||||
|---|---|---|---|---|---|---|---|---|
| HR (95 % CI) | P value | HR (95 % CI) | P value | HR (95 % CI) | P value | HR (95 % CI) | P value | |
| RBC count | ||||||||
| Q1 | Ref. | —— | Ref. | —— | Ref. | —— | Ref. | —— |
| Q2 | 1.12(1.01–1.26) | 0.038 | 1.19(1.07–1.33) | 0.002 | 1.04(0.93–1.16) | 0.471 | 1.04(0.93–1.16) | 0.545 |
| Q3 | 1.32(1.18–1.46) | <0.001 | 1.48(1.33–1.66) | <0.001 | 1.20(1.07–1.34) | 0.002 | 1.15(1.02–1.29) | 0.017 |
| Q4 | 1.50(1.35–1.66) | <0.001 | 1.77(1.57–1.99) | <0.001 | 1.33(1.18–1.50) | <0.001 | 1.20(1.07–1.36) | 0.003 |
| HGB | ||||||||
| Q1 | Ref. | —— | Ref. | —— | Ref. | —— | Ref. | —— |
| Q2 | 1.12(1.01–1.26) | 0.471 | 1.12(1.00–1.25) | 0.044 | 1.08(0.97–1.20) | 0.188 | 1.07(0.96–1.20) | 0.193 |
| Q3 | 1.04(0.93–1.16) | 0.490 | 1.24(1.10–1.40) | <0.001 | 1.16(1.03–1.30) | 0.015 | 1.11(0.99–1.25) | 0.075 |
| Q4 | 1.40(1.26–1.55) | <0.001 | 1.80(1.58–2.05) | <0.001 | 1.59(1.40–1.80) | <0.001 | 1.41(1.24–1.60) | <0.001 |
NAFLD: non-alcoholic fatty liver disease; RBC: red blood cell count; HGB: haemoglobin; HR: hazards ratio; CI: confidence interval.
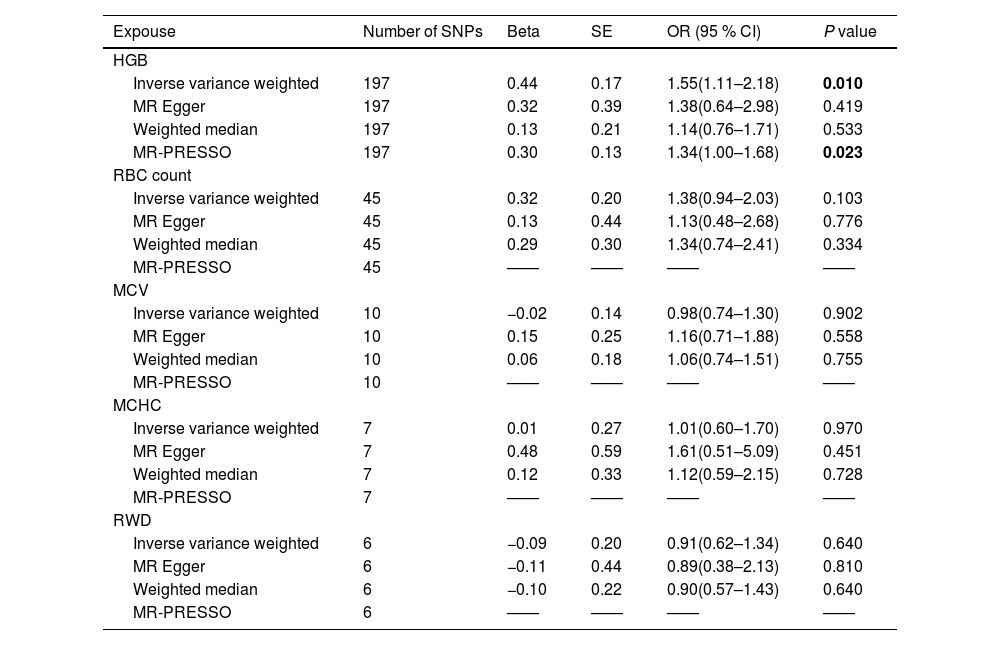
Next, we investigated the causal relationships between RBC indices and NAFLD using two-sample MR analysis (Table 3). IVW analysis suggested that higher HGB levels were positively correlated with NAFLD (odds ratio [OR] 1.55, 95 % CI 1.11–2.18, P = 0.010), and the directions of MR–Egger, weighted median, and MR-PRESSO were consistent with the direction of IVW analysis. The scatter plot illustrating the causal effects of HGB level-associated SNPs on NAFLD is shown in Supplemental Figure 3. However, we did not find a causal relationship between RBC count, MCHC, MCV, RDW and NAFLD. Detailed MR results for RBC count, MCHC, MCV, and RDW are presented in Table 3 and Supplemental Figures 5–8.
Main result of MR analyses testing effect of RBC indices on NAFLD.
| Expouse | Number of SNPs | Beta | SE | OR (95 % CI) | P value |
|---|---|---|---|---|---|
| HGB | |||||
| Inverse variance weighted | 197 | 0.44 | 0.17 | 1.55(1.11–2.18) | 0.010 |
| MR Egger | 197 | 0.32 | 0.39 | 1.38(0.64–2.98) | 0.419 |
| Weighted median | 197 | 0.13 | 0.21 | 1.14(0.76–1.71) | 0.533 |
| MR-PRESSO | 197 | 0.30 | 0.13 | 1.34(1.00–1.68) | 0.023 |
| RBC count | |||||
| Inverse variance weighted | 45 | 0.32 | 0.20 | 1.38(0.94–2.03) | 0.103 |
| MR Egger | 45 | 0.13 | 0.44 | 1.13(0.48–2.68) | 0.776 |
| Weighted median | 45 | 0.29 | 0.30 | 1.34(0.74–2.41) | 0.334 |
| MR-PRESSO | 45 | —— | —— | —— | —— |
| MCV | |||||
| Inverse variance weighted | 10 | −0.02 | 0.14 | 0.98(0.74–1.30) | 0.902 |
| MR Egger | 10 | 0.15 | 0.25 | 1.16(0.71–1.88) | 0.558 |
| Weighted median | 10 | 0.06 | 0.18 | 1.06(0.74–1.51) | 0.755 |
| MR-PRESSO | 10 | —— | —— | —— | —— |
| MCHC | |||||
| Inverse variance weighted | 7 | 0.01 | 0.27 | 1.01(0.60–1.70) | 0.970 |
| MR Egger | 7 | 0.48 | 0.59 | 1.61(0.51–5.09) | 0.451 |
| Weighted median | 7 | 0.12 | 0.33 | 1.12(0.59–2.15) | 0.728 |
| MR-PRESSO | 7 | —— | —— | —— | —— |
| RWD | |||||
| Inverse variance weighted | 6 | −0.09 | 0.20 | 0.91(0.62–1.34) | 0.640 |
| MR Egger | 6 | −0.11 | 0.44 | 0.89(0.38–2.13) | 0.810 |
| Weighted median | 6 | −0.10 | 0.22 | 0.90(0.57–1.43) | 0.640 |
| MR-PRESSO | 6 | —— | —— | —— | —— |
MR: Mendelian randomization; HGB: hemoglobin; RBC:red blood cell; MCHC: mean corpuscular haemoglobin concentration; MCV:mean corpuscular volume; RDW: red blood cell distribution width; OR: odds ratio; CI: confidence interval.
Sensitivity analyses were conducted to verify the reliability of the IVW results. The MR–Egger intercept test for HGB showed no evidence of pleiotropy (Egger intercept: 0.002, P = 0.731). Cochran's Q revealed heterogeneity in MR analysis results between HGB and NAFLD, with a P-value <0.05. Consequently, we performed random-effects IVW MR analysis and the results remained consistent with IVW MR analysis (OR 1.55, 95 % CI 1.11–2.18, P = 0.010). Leave-one-SNP-out analysis indicated the reliability of the results (Supplemental Figure 4).
4DiscussionThis study is the first to explore the causal association between RBC indices and NAFLD based on summary level data from large cohorts. In the prospective analysis, RBC count and HGB were found to be associated with the occurrence of NAFLD. The two-sample MR analysis showed that HGB level was causally associated with NAFLD [26].
Emerging evidence suggests that hemoglobin plays a key role in the pathogenesis of NAFLD [27,28]. One study suggested that after adjusting for potential confounding factors, increased hemoglobin levels were the main predictor of non-alcoholic steatohepatitis and liver fibrosis in lean NAFLD [29]. Another study including 2216 individuals reported that higher serum hemoglobin levels were associated with an elevated risk of developing incidental NAFLD in men during a 5-year follow-up period [14]. A landmark proteomic study demonstrated that free hemoglobin subunits could serve as serum biomarkers for assessing the severity of liver damage in obese non-alcoholic patients [30]. However, previous studies were limited by their retrospective design or small sample sizes and did not explore the causal relationship between hemoglobin and NAFLD. The present study prospectively analyzed the relationship between high hemoglobin levels and NAFLD risk using a large sample size and confirmed the causal relationship between hemoglobin levels and NAFLD through two-sample MR analysis. Therefore, the results of this study are highly reliable. Previous studies found that RDW is associated with the risk of developing NAFLD [14,31]. However, this present prospective study with a larger population suggests that RDW is not associated with incident NAFLD. Furthermore, the MR analysis showed that neither RBC count, MCHC, MCV, nor RDW are causally related to NAFLD, which is a more credible outcome.
The precise mechanism linking hemoglobin levels to NAFLD remains unclear. There are several possible explanations for this. Firstly, free hemoglobin can upregulate the expression of functional tissue factors in macrophages and render these factors less responsive to antioxidants such as glutathione or serum [32]. In addition, free hemoglobin can scavenge nitric oxide, thereby impairing its regulatory effects on endothelial dysfunction and disrupting normal physiological processes in liver cells [33]. Despite its essential role in oxygenation, free hemoglobin is directly harmful to cells through lipid peroxidation, potentially resulting in liver cell damage[34,35]. Previous studies have attributed the relationship between hemoglobin and NAFLD to iron status[14]. Nevertheless, after eliminating instrumental variables associated with iron-state biomarkers, our MR analysis revealed a causal relationship between hemoglobin levels and NAFLD. Therefore, the relationship between elevated hemoglobin levels and the risk of NAFLD may not be solely attributed to iron status.
This study has some limitations. First, residual confounding may persist, even though we performed extensive covariate correction in a prospective study. Second, it remains challenging to entirely rule out potential horizontal pleiotropy, which could introduce biased estimates. Third, a risk of bias due to measurement error may exist for the MR–Egger regression. Finally, most UK Biobank participants are Europeans and the MR analysis was confined to this population, which limits the generalizability of our findings.
5ConclusionsIn conclusion, while further research is warranted to comprehensively uncover the underlying mechanisms, our study provides robust evidence suggesting heightened vigilance among individuals with high HGB concerning the development of NAFLD. Furthermore, our findings suggest that HGB can potentially be used as a large-scale non-invasive tool to dynamically monitor the occurrence and development of NAFLD.
FundingThis work was supported by National Key R&D Program of China (No. 2020YFC2006400), the National Nature Science Foundation of China (No. 82172751, 82404077, 82400664), Guangzhou Science and Technology Project (No. 202201011183), Guangdong Natural Science Foundation (No. 2022A1515110656), the Postdoctoral Fellowship Program of CPSF (Grant No. GZC20240663) and Guangdong Province College Students’ Innovative Entrepreneurial Training Program (Grant No. S202312121118).
CRediT authorship contribution statementRui-ning Li: Methodology, Visualization, Writing – original draft, Writing – review & editing. Qi-mei Li: Conceptualization, Data curation, Writing – original draft. Sheng-xing Liang: Writing – original draft, Methodology, Software. Chang Hong: Formal analysis, Visualization, Writing – review & editing. Rong-feng Zhang: Writing – review & editing. Jia-ren Wang: Conceptualization, Data curation. Hong-bo Zhu: Methodology, Software. Hao Cui: Data curation. Jing-zhe He: Data curation. Yan Li: Investigation. Xue-jing Zou: Investigation. Wen-yuan Li: Investigation, Supervision. Lin Zeng: Formal analysis, Investigation. Li Liu: Funding acquisition, Project administration, Supervision. Lu-shan Xiao: Conceptualization, Funding acquisition.
We thank all participants and investigators involved in the UK Biobank and the FinnGen study for sharing data.


