


Se estimó la captura y emisión de CO2 de tres especies (Buddleia cordata, Senecio praecox y Echeveria gibbiflora) en la Reserva Ecológica del Pedregal de San Ángel. El muestreo se realizó durante los meses de febrero, marzo, abril y noviembre (temporada seca) y de julio a octubre (temporada de lluvias) en 2010. En la temporada seca B. cordata y S. praecox capturaron 16.14 y 3.25kg de CO2, respectivamente, en tanto que E. gibbiflora emitió 45.76kg de CO2. En la temporada de lluvias el intercambio de CO2 fue diferente para las tres especies. La tasa de fotosíntesis durante la temporada seca y de lluvias fue respectivamente de 22 y 6μmol CO2 m–2 s–1 para B. cordata, 27 y 5.25μmol CO2 m–2 s–1 para S. praecox, y 29 y 3μmol CO2 m–2 s–1 para E. gibbiflora. Adicionalmente, se estimó el índice de vegetación de diferencia normalizada con datos de MODIS. Los resultados indican que la intensidad del verdor en el sitio aumentó durante los meses de lluvia. En este trabajo se explica la contribución de dichas plantas al ciclo de carbono en un ecosistema ubicado dentro de una zona urbana, así como la relación de variables ambientales como temperatura, densidad del flujo fotosintético de fotones y humedad relativa en la captura o emisión de CO2. Este trabajo proporciona información sobre la dinámica del ciclo del carbono en ecosistemas urbanos, lo cual puede ser útil para estudios futuros sobre la mitigación del cambio climático.
Capture and emission of carbon dioxide of three species (Buddleia cordata, Senecio praecox and Echeveria gibbiflora) in the Reserva Ecológica del Pedregal de San Ángel (Ecological Reserve of the Pedregal de San Ángel), were estimated. CO2 sampling was carried out in 2010 during the dry (February, March, April and November) and rainy seasons (July to October). On the dry season B. cordata and S. praecox captured 16.14 and 3.25kg CO2, respectively, whereas E. gibbiflora emitted 45.76kg CO2. In the rainy season the exchange of CO2 was different for the three species. In the dry season, the photosynthetic rate was 22μmol CO2 m–2 s–1 for B. cordata, 27μmolCO2 m–2 s–1 for S. praecox and 29μmolCO2 m–2 s–1 for E. gibbiflora. In the rainy season they were 6, 5.25 and 3μmol CO2 m–2 s–1, respectively. In addition, MODIS data were used to estimate the normalized difference vegetation index (NDVI), indicating that the intensity of greenery at the site increased during the rainy months. This paper explains the contribution of studied plants to the carbon cycle of an ecosystem located within an urban area, and the relationship of environmental variables such as temperature, density photosynthetic photon flux and relative humidity in the capture or emission of CO2. This work provides valuable information about the carbon cycle dynamics on urban ecosystems, which can be useful in future studies for climate change mitigation.
The global warming phenomenon, which is caused by emissions of greenhouse gases (GHGs) that contribute to an increase in earth surface temperature, is presented nowadays as a problem for the development of life on earth. Carbon dioxide (CO2) is one of the gases that most favors the heating process, and its concentration has increased in recent years mainly due to anthropogenic activities, going from 280 ppm in pre-industrial times to 398.72 ppm in 2014 (IPCC, 2007;NOAA, 2014). According to the national inventory of GHGs of Mexico, the total CO2 emissions were 493.45 Mt in 2010, contributing with 65.9% to the total inventory and having an increase of 23.6% compared to 1990 (INE, 2010).
There are various carbon sinks in the world that have been associated to an important contribution of forests, which are responsible for 60% of the net sequestration of carbon dioxide (Nobel, 2009). It is estimated that the world's forests capture over 650 Mt of carbon, which helps to mitigate climate change and preserve biodiversity (FAO, 2010). However, not only forests sequestrate CO2; it has been shown in several studies that the presence of trees in urban areas favors the reduction of some air pollutants and contributes to carbon sequestration (Yang et al., 2005;Kordowski and Kuttler, 2010;Velasco et al., 2013). There are several techniques for estimating carbon sequestration; one of them is through the use of technologies such as satellite imagery from the Moderate Resolution Imaging Spectroradiometer (MODIS), whose purpose is to model carbon and water cycles globally. Furthermore, MODIS allows measuring ecosystem's primary productivity, vegetation indices and other environmental variables (Zhao et al., 2005).
The captured carbon is also estimated using different models, which evaluate photosynthetic and environmental parameters (Kim and Lieth, 2003;Schultz, 2003;Xu and Baldocchi, 2003;Sharkey et al., 2007), whereas others evaluate the carbon balance between plants and the atmosphere (Harnos et al., 2006). Several experimental studies of photosynthesis use CO2 analyzers and measurements in situ (Myers et al., 1999;Long and Bernacchi, 2003;Kitao et al., 2007). However, few studies have evaluated the importance of individual species concerning their contribution to CO2 capture and emission in the environment. This information provides knowledge over the role of vegetation. Urban forests can contribute significantly to the reduction of air pollution by relieving the intensity of the heat island (Yang et al., 2005). Velasco et al. (2013) mentioned that vegetation in an urban area contributes to the capture of CO2 during the day and promotes local air cooling due to transpiration, serving as an alternative mitigation for climate change.
In this study our objective was to estimate CO2 capture and emission through the photosynthetic rate of three endemic plants (E. gibbiflora, B. cordata, and S. praecox) and the relationship between temperature (T), density photosynthetic photon flux (DPPF), and relative humidity (RH) in dry and rainy seasons at the Reserva Ecológica del Pedregal de San Ángel (Ecological Reserve of the Pedregal de San Ángel, REPSA); we also estimated the contribution to the carbon cycle to understand the role of urban plant ecosystems in climate change mitigation. This site was chosen because it is one of the few protected natural reserves located in a megacity; moreover, it is of great value for the conservation of biodiversity and it provides environmental services to the south of the metropolitan area of Mexico City. It also has a special ecosystem, a xerophilus shrubland settled into a basaltic substrate whose soils are scarce and shallow (Rzedowski, 1954), which is the reason why this work is focused on the aboveground biomass. The carbon cycle in vegetation starts with CO2 fixation mainly in the photosynthetic processes in which the plants absorb CO2 from the atmosphere to produce oxygen and carbohydrates through solar radiation. We hypothesized that different climatic conditions produce significant changes regarding the carbon balance during the dry and rainy seasons.
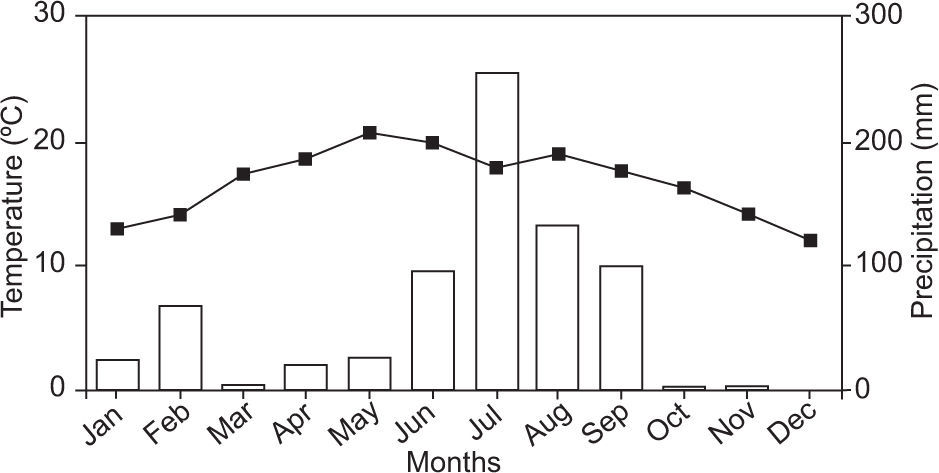
2Experimental2.1Sampling site descriptionThis study was conducted in the REPSA, located southeast of Mexico City (19° 17’ N, 99° 11’ W). It covers an area of approximately 273 hectares and its nominal elevation is 2329 masl. The vegetation consists of xerophilous shrubs and dominant life forms are herbs and shrubs (Castillo-Argüero et al., 2007;Chávez and Ceballos, 2009). According to Jáuregui (2000) the climate has dry and rainy seasons. The dry season runs from November to May and the rainy season from June to October. The average annual precipitation is 803mm and mean annual temperature is 15.6 °C.
Figure 1 shows monthly average temperature and precipitation for 2010, obtained from a weather station near the sampling point. The highest temperature during that year was recorded in May with an average value of 20 °C, and the lowest was 12 °C in December. The highest precipitation was 255mm in July and the lowest values were 3 and 0mm in November and December, respectively.
2.2Sampling
The studies of CO2 exchange were made on three sampling times: T1 (7:30-9:30 LT), T2 (11:30-13:30 LT) and T3 (15:30-17:30 LT). The sampling times were chosen because two of the selected plants have C3 metabolism and light saturation curves ranged from 500 to 1000μmol m–2s–1. The experimental campaign was conducted during 2010, on February 8-12, March 8-12, April 12-16, July 5-9, August 16-20, September 6-10, October 11-15, and November 8-12.
The photosynthetic rate (PR), temperature (T), and relative humidity (RH) were measured with a LI-6400 CO2 analyzer (LI-COR Inc., NE, USA) on leaves of each species exposed to sun. Additionally, the photosynthetic photon flux density (PPFD) was measured with an LI-190SA external sensor (LI-COR Inc., NE, USA). The experimental measurements consisted of three replicates per plant during the three sampling times.
2.3PlantsMeasurements were conducted in situ considering three native and abundant REPSA's species. E. gibbiflora is a perennial plant with succulent leaves and stems, belonging to the Loganiaceae family (Carrillo-Reyes et al., 2009). This plant blooms from November to February, and its leaves have a 24-30 cm long diameter forming a rosette (Pérez-Calix, 2008). B. cordata is an evergreen small tree, belonging to the Loganiaceae family; it blooms from July to October with oblong and pubescent leaves (5-24 cm long, 1.5-10.5 cm wide). S. praecox belongs to the Asteraceae family, and it has a similar lifestyle to B. cordata specie with oblong leaves 2-18 cm long and 2-10 cm wide, which reduces its canopy leaf area during the dry season. E. gibbiflora has a Crassula- ceae acid metabolism known as CAM which allows the fixation of CO2 at night, while in the light period it assimilates CO2 into chloroplasts by the C3 cycle (Taiz and Zeigel, 2006). S. praecox and B. cordata have a Calvin-Benson cycle metabolism, allowing the fixation and assimilation of CO2 to form organic compounds, and the photosynthesis takes place in chloroplasts (Nobel, 2009).
2.4Population and densityIn order to estimate the number of individuals from each species in the REPSA, eight quadrants of 10 by 10 m were selected. The sampling method was selective: the numbers of individuals, branches and leaves were counted in each quadrant for the three species in both climatic seasons.
In order to calculate the total CO2 captured and emitted by the REPSA, we averaged the number of individuals for each species in eight quadrants. The results (six, seven and 79 for B. cordata, S. praecox, and E. gibbiflora, respectively) were then extrapolated to the REPSA. We also used the average leaf area (LA) to calculate the surface and average branches per species, in order to estimate the total contribution of REPSA. Applying a destructive method, samples and branches were taken randomly from each species in all quadrants, and then the leaf area was measured using a LI-3000 (LI-COR Inc., NE, USA).
2.5Estimation of CO2 (capture and emission)The CO2 exchange between the species and the atmosphere was estimated using average values of the photosynthetic rate, plant population and leaf area of each plant during three schedules in both seasons (dry and rainy). The estimation of CO2 was performed with the following equation:

where PR represents the photosynthetic rate (kg CO2), t the sampling time (s), LA the leaf area (m2), and RA the REPSA area (m2). Positive values of CO2 indicate capture and negative values represent emissions from the plant to the environment.
2.6Statistical analysisCorrelation coefficient was used to test relations of PR among temperature, PPFD and relative humidity (Statistics R2015a, Matlab). Data are presented as the means of three tests and standard error.
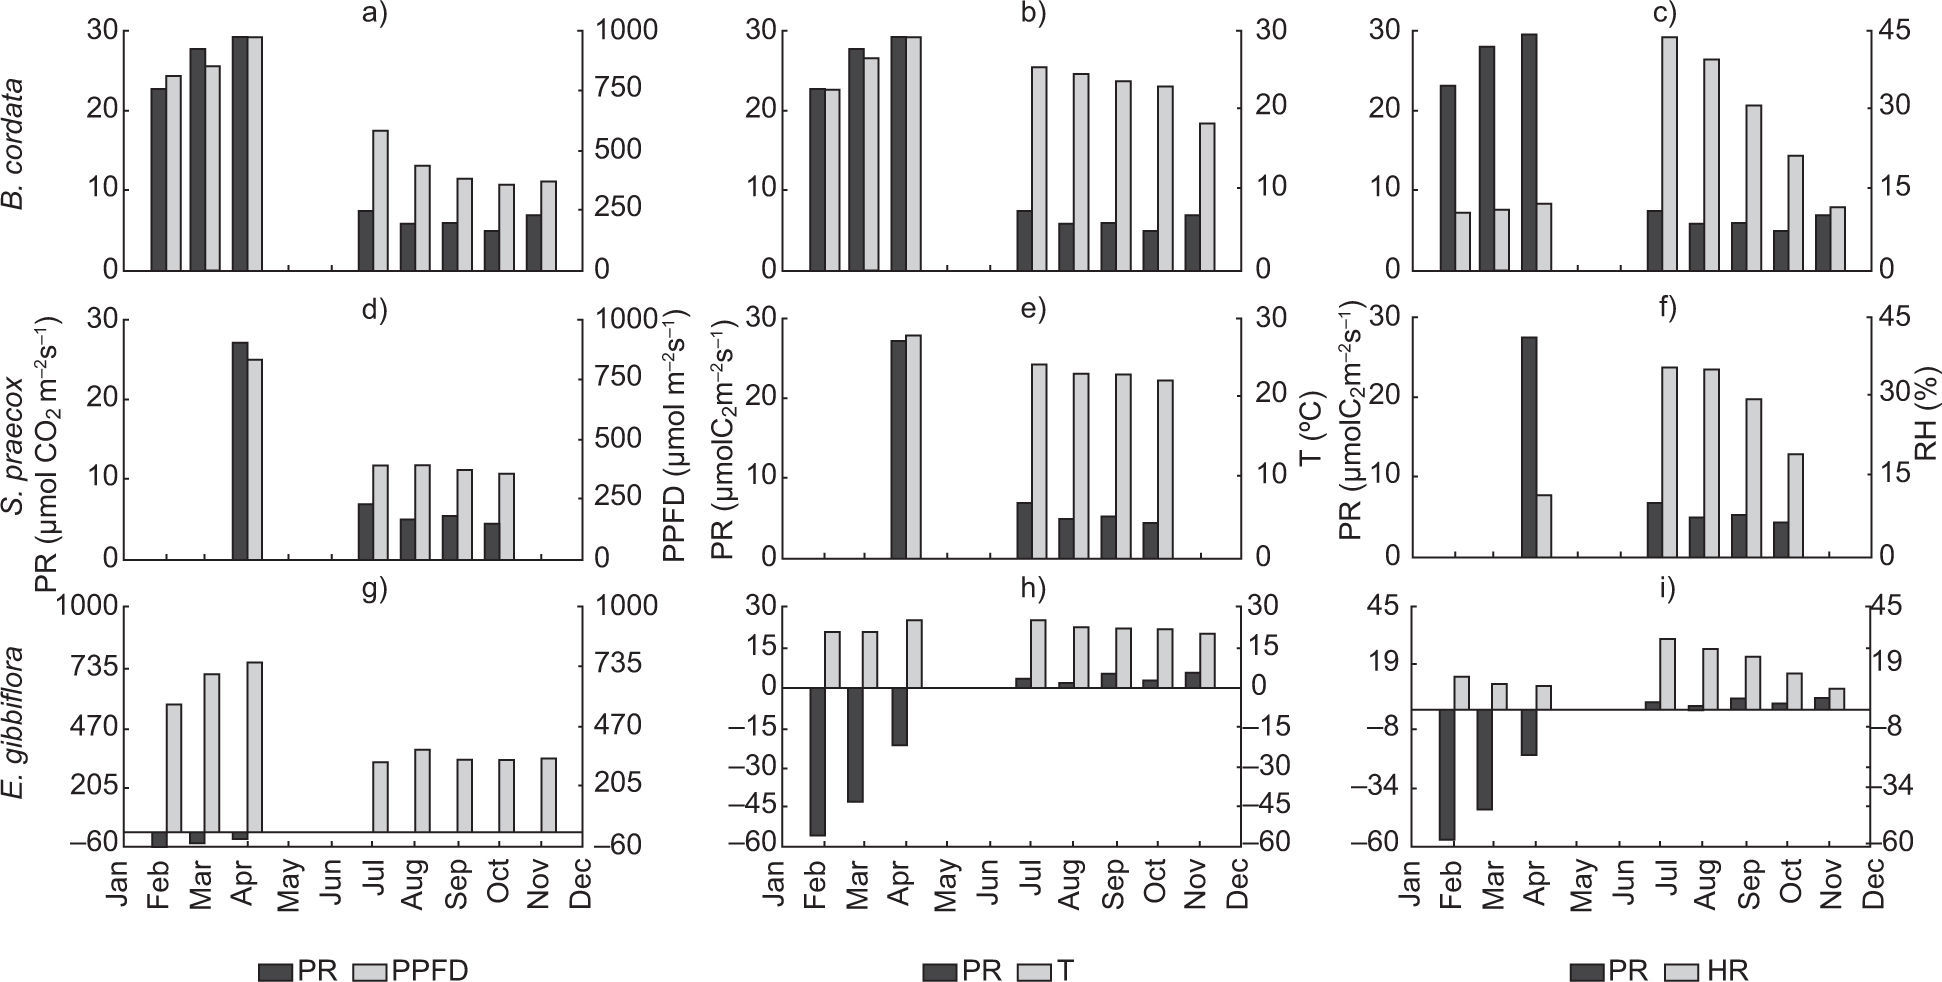
3Results and discussion3.1Photosynthetic rate, photosynthetic photon flux density, temperature and relative humidityThe maximum average temperature was 27 °C in April (dry season), while the minimum was 22 °C measured in September, at the end of the rainy season. Figure 2 shows the averages of PR, PPFD, T and RH for the three sampling times. We also analyzed the correlation coefficients between these variables.
; photosynthetic rate vs. temperature (b, e and h), and photosynthetic rate vs. relative humidity (c, f and i) for B. cordata, S. praecox and E. gibbiflora, respectively.")
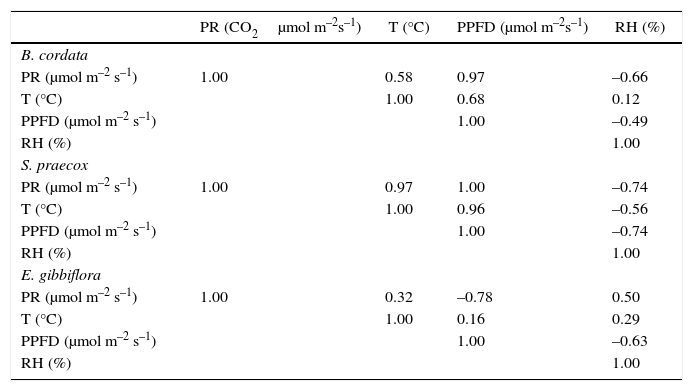
The PR changed both in the dry and rainy seasons for all species (Fig. 2a, d, g). B. cordata had a maximum PR of 29μmol CO2 m–2s–1 in April and a minimum of 5μmol CO2 m–2s–1 in October (Fig. 2a); it also showed a good correlation between PR and PPFD. However, T and RH showed very poor correlations (Table I). S. praecox loses its leaves during the dry season; in April PR reached 27μmol CO2 m–2s–1, in October it decreased to 4μmol CO2 m–2s–1, from July to October it ranged from 6.72 to 4.28μmol CO2 m–2s–1, and in April it increased to 27μmol CO2 m–2s–1 showing a strong change from one season to another (Fig. 2d). Temperature range was 21-23 °C in the rainy season and 28 °C in the dry season (Fig. 2e), both cases showing a good correlation coefficient among PR, PPFD, and T (r=0.96, Table I). E. gibbiflora had a totally different behavior and the correlation coefficients of PR indicated respiration instead of photosynthesis processes. PR increased from –57 to –21μmol CO2 m–2s–1 from February to April, but in the rainy season it was positive, ranging from 1-5μmol CO2 m–2s–1. Also, PPFD changed from 600μmol m–2s–1 during the dry season to 350μmol m–2s–1 in the rainy season (Fig. 2g). PR and PPFD had an r=– 0.78, perhaps indicating an inverse relationship between both variables.
Cross correlation of variables for B. cordata, S. praecox and E. gibbiflora.
| PR (CO2μmol m–2s–1) | T (°C) | PPFD (μmol m–2s–1) | RH (%) | |
|---|---|---|---|---|
| B. cordata | ||||
| PR (μmol m–2 s–1) | 1.00 | 0.58 | 0.97 | –0.66 |
| T (°C) | 1.00 | 0.68 | 0.12 | |
| PPFD (μmol m–2 s–1) | 1.00 | –0.49 | ||
| RH (%) | 1.00 | |||
| S. praecox | ||||
| PR (μmol m–2 s–1) | 1.00 | 0.97 | 1.00 | –0.74 |
| T (°C) | 1.00 | 0.96 | –0.56 | |
| PPFD (μmol m–2 s–1) | 1.00 | –0.74 | ||
| RH (%) | 1.00 | |||
| E. gibbiflora | ||||
| PR (μmol m–2 s–1) | 1.00 | 0.32 | –0.78 | 0.50 |
| T (°C) | 1.00 | 0.16 | 0.29 | |
| PPFD (μmol m–2 s–1) | 1.00 | –0.63 | ||
| RH (%) | 1.00 | |||
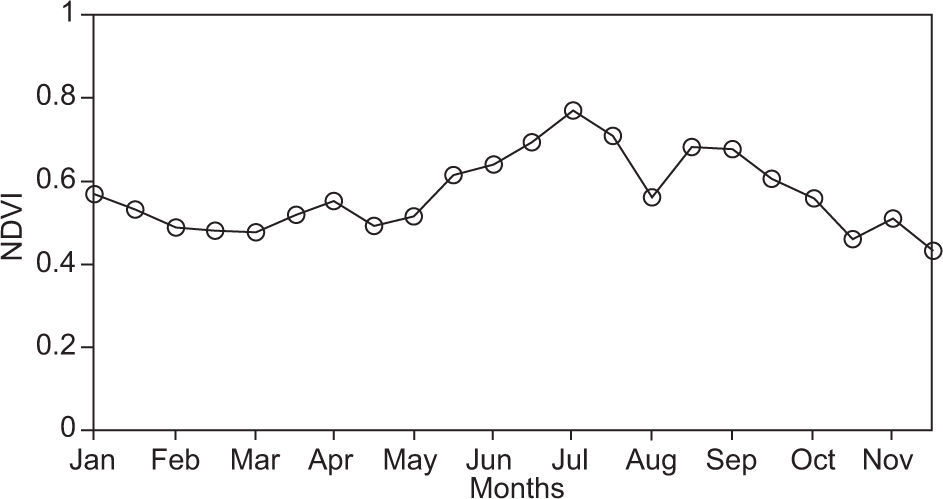
Analysis of normalized difference vegetation indexes (NDVI) was also performed to identify changes of greenery in both measuring seasons, using information of the MODIS from the Earth Observing System (EOS). Figure 3 shows the results and changes on greenery along the year. July presented the highest value of the rainy season.
3.2Estimated CO2 (capture and emission)
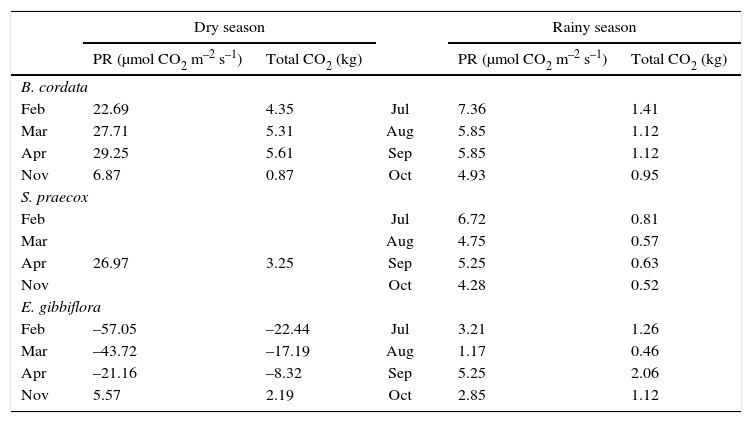
Table II shows the results of CO2 fluxes (capture and emission) estimated in the REPSA. B. cordata and S. praecox species had similar behavior in capturing CO2 during both seasons, with 4.03 and 3.25kg CO2 in the three sampling times. During the rainy season there was a reduction in the capture of CO2, decreasing to 3.25kg for B. cordata and 0.63kg for S. praecox. On the other hand, E. gibbiflora showed negative values in February, March, and April, indicating respiration processes, so the average emitted CO2 was 11.44kg in the dry season and the average captured CO2 was 1.12kg in the rainy season.
Estimation of CO2 fluxes by B. cordata, S. praecox and E. gibbiflora in both seasons.
| Dry season | Rainy season | ||||
|---|---|---|---|---|---|
| PR (μmol CO2 m–2 s–1) | Total CO2 (kg) | PR (μmol CO2 m–2 s–1) | Total CO2 (kg) | ||
| B. cordata | |||||
| Feb | 22.69 | 4.35 | Jul | 7.36 | 1.41 |
| Mar | 27.71 | 5.31 | Aug | 5.85 | 1.12 |
| Apr | 29.25 | 5.61 | Sep | 5.85 | 1.12 |
| Nov | 6.87 | 0.87 | Oct | 4.93 | 0.95 |
| S. praecox | |||||
| Feb | Jul | 6.72 | 0.81 | ||
| Mar | Aug | 4.75 | 0.57 | ||
| Apr | 26.97 | 3.25 | Sep | 5.25 | 0.63 |
| Nov | Oct | 4.28 | 0.52 | ||
| E. gibbiflora | |||||
| Feb | –57.05 | –22.44 | Jul | 3.21 | 1.26 |
| Mar | –43.72 | –17.19 | Aug | 1.17 | 0.46 |
| Apr | –21.16 | –8.32 | Sep | 5.25 | 2.06 |
| Nov | 5.57 | 2.19 | Oct | 2.85 | 1.12 |
PR and PPFD for B. cordata and S. praecox showed a similar behavior on both the dry and rainy seasons. Those species had higher PR in the dry than in the rainy season. The results show the relevance of solar radiation by increasing the photosynthetic rate for this species (Larcher, 2003;Marur and Faria, 2006).
E. gibbiflora had a totally different behavior, PR showed negative values on the dry season, indicating respiration and therefore CO2 released to the environment. The results are related to the facultative metabolism (Crassulacean acid metabolism) that captures CO2 during the night to prevent the loss of water and also decreases its photosynthetic rate during the day. However, in the rainy season, this species showed photosynthetic activity capturing carbon dioxide probably caused by stomatal opening in short periods of the day (Geydan and Melgarejo, 2005;Andrade et al., 2007).
Temperature has a direct influence on the activities of plants; it promotes physiological activities, increasing the photosynthetic rate (Lambers et al., 2008), but high temperatures cause stomata closure reducing gas exchange. The environmental temperature average throughout the measuring campaign was 25 °C, thus favoring the photosynthetic activity of B. cordata and S. praecox in this microenvironment.
Photosynthesis cycles are influenced by seasonal changes, which increase in the first months of the year and decrease during fall, with the loss of leaves (Lambers et al., 2008). However, environmental variables such as temperature, PPFD and RH are determinant for photosynthesis responses. According to the results, the RH average was 11% during the dry season, suggesting that low RH values are appropriate for CO2 capture by B. cordata and S. praecox. Average RH during rainy season increased to 40%, reducing plant transpiration and preventing water loss. Some studies show that in forests, clouds dipping favors photosynthesis (Letts and Mulligan, 2005;Johnson and Smith, 2008), but in these species sunny days are essential. NDVI showed that in the reserve, greenness intensity is greater than 0.4; this value is an indicator that suggests photosynthesis and secures primary productivity in this place.
The results showed a decrease of PR and PPFD during the rainy season for the species B. cordata and S. praecox. It has been suggested that clouds present in this season affect the processes of photosynthesis. It was also observed that the microenvironment and physiological variables of these species are critical in their response to photosynthesis. The contribution of the reserve according to the estimates, allows knowing the CO2 balance of these two species during the dry and rainy seasons, which was 3.86 and 3.03kg CO2, respectively.
4ConclusionsResults are a first approximation to CO2 exchange in an urban ecosystem. This information could be integrated into ecosystem models to update and validate data. B. cordata and S. praecox have a similar behavior in CO2 exchange, but E. gibbiflora shows a totally different behavior that could overestimate the CO2 capture in the REPSA. For a better understanding of CO2 exchange in this reserve, we recommend that night measurements should be performed too.
We thank M. I. Saavedra for her technical assistance; also H. Padilla, J. García, E. Montes, A. Ysunza, J. Rosas, R. López, E. Galindo, and T. Castillo for their help during the measuring campaign.