


Debido al interés creciente del público general por acceder a servicios comerciales de pronóstico meteorológico a través de diversos medios de comunicación, y al impulso que ha cobrado la promoción del turismo en Arabia Saudita (AS), se hace un primer intento de comparar aptitudes para el pronóstico de la temperatura superficial en cuatro ciudades situadas en la costa oeste de AS (Wejh, Yenbo, Jeddah, y Giza), centrado en la fase de transición de 61 días (del 16 de enero al 16 de marzo) entre los periodos diciembre-enero-febrero y marzo-abril-mayo. Se utiliza un método sencillo de comparación de puntajes para evaluar los pronósticos de temperatura superficial de 24 h realizados por seis proveedores comerciales de pronósticos del tiempo basados en un modelo numérico. Todos los proveedores que utilizaron el modelo numérico de predicción del tiempo obtuvieron mejores resultados que la climatología diaria para la estación correspondiente. Dependiendo del proveedor y la estación, la diferencia absoluta en los promedios de temperatura máxima entre los pronósticos y las observaciones fue menor a 2 °C. Los pronósticos diarios de temperatura superficial obtenidos a partir de dos versiones de un modelo de circulación general océano-atmósfera también se comparan para evaluar su desempeño en estas localidades costeras.
Given the growing interest of the general public in accessing commercial weather forecasts through various media outlets and the available impetuses for promoting tourism in Saudi Arabia (SA), a first attempt is made to present a forecast skill comparison for surface temperature in four cities (Wejh, Yenbo, Jeddah, and Gizan) along the west coast of SA, for the 61-day transitional period (from January 16 to March 16) between the December-January-February (DJF) and the March-April-May (MAM) seasons. A simple skill score comparison method is used to assess the next-day city forecasts for surface temperature from six commercial weather forecast providers based on the operational numerical weather prediction (NWP) model outputs. All the NWP model forecast providers performed better than the respective daily climatology (Clm) for each station. Depending upon the station and the provider, the absolute average maximum daily surface temperature difference between the forecasts and the observations was less than 2 °C. Daily surface temperature forecasts from two versions of an atmospheric-ocean general circulation model are also compared to assess their performance for these coastal locations.
The uncertainty in temperature forecast is deep-rooted theoretically; the temperature forecast is inherently related to the preciseness of the initial conditions (see, for instance, Palmer, 2000; Slingo and Palmer, 2011, and references therein). A possible way to address/reduce this uncertainty is to compare various temperature forecasts based on a skill comparison metric, preferably all under the same spatiotemporal conditions, and to attempt to identify and rectify the sources of impreciseness (Casati et al., 2008). The temperature forecast verification analysis is beneficial not only from the research point of view but also from the socio-economic point of view (for a recent review, see, for instance, Jolliffe and Stephenson, 2003, and references therein; Curtis et al., 2011). Thus, a purpose for a forecast verification study is to provide information that may be relevant for the modelers, forecasters, and the general public, provided a well judged objective forecast comparison is performed. The continual temperature forecast verification comparisons could also indicate a trend in temperature forecast quality (Sanders, 1986; Maglaras, 1998, 1999). Furthermore, the range of issues associated with accurate forecasts is large enough: from improved communication to dissemination of information geared towards specific cultural values and user needs (see, for instance, Keller et al., 2007; Pennesi, 2007; Morss et al., 2008).
There is growing evidence of general public interest in Saudi Arabia (SA) to check for weather updates using the Internet (see, instance, Saudi Gazette, 2012). In particular, this includes personnel from the growing sector of tourism in SA (see, for instance, Arab News, 2012a, b). The successful verification of the weather forecast has thus direct implications for regional economics (Casati et al., 2008). Surface temperature is a key weather variable affecting daily life in SA; it determines many regional socio-economic factors including the energy and tourism sectors (see, for instance, Bigano et al., 2006). In particular, transitional periods are considered as one of the best times of the year to visit the coastal SA for tourism, because of less extreme temperatures (Arab News, 2012c, d).
The regional stormy weather forecast comparisons have been reported extensively; these include short-lived tornados, and/or rain/hail/snow bringing storms (see, for instance, Evans and Grumm, 2000; Czarnetzki, 2001). The analyses of relatively recent long-lived heat waves/cold spells are also presented (e.g., Karl and Knight, 1997; Thornes and Stephen-son, 2001; Athar and Lupo, 2010; Lupo et al., 2012). On the other hand, the non-extreme events forecasts and their skill comparisons also have considerable socio-economic implications (Casati et al., 2008).
Numerous deterministic forecast skill comparison metrics exist and have been applied to compare the skill of forecasts (see, for instance, Mailier et al., 2008). The selection of a particular metric is essentially an open question, mainly determined by the addressed implication (see, for instance, Roebber and Bosart, 1996). Although various aspects of temperature forecast verification geared towards assessing responses of widely varying interest sectors of general public are discussed for different locations (Brooks et al., 1997), there is no such study available for SA. Also, unlike the customary tradition in North America, of having city forecast competition/game as a part of under graduate/graduate course work (see, for instance, Driscoll, 1988; Athar and Sara, 2013), there is no such established custom in SA universities. The present analysis may thus serve as a reference document to possibly initiate such a practice in university education in SA and/or at general public level (for the quality assessment of commercial weather forecast, see, for instance, Mailier et al., 2008). In particular, as of now, King Abdulaziz University is the only educational institute in the region offering a formal education in meteorology.
A relevant question may be why such a study needs to be carried out when automated statistical analysis software packages and large weather information based dataset archives already exist. Since efforts for forecasting weather have essentially the single aim of informing the general public with the latest state of the lower atmosphere, so that they may prepare in advance for any weather change, one might wonder which commercial weather forecast provider is comparatively better. The commercial weather forecast providers do not provide an archive of the displayed daily weather information to the general public (which is the topic addressed in this paper). A short (and first) archived study is thus welcome, to initiate and to possibly promote intercultural response. Furthermore, with the rapid growth of the tourism sector in the region, the utility of such comparative studies is and will be enormous (Arab News, 2012e, f).
In this paper, a relative forecast skill comparison analysis for the surface temperature of coastal SA is presented, which is considered as a continuous variable. Concentrating on a single weather variable helps to assess the relative robustness of a single variable forecast via several considered commercial weather forecast providers, based on numerical weather prediction (NWP) models. Given the perceived usefulness of temperature variables, all three daily temperature variables (maximum, minimum and mean temperature, abbreviated as Tmax, Tmin, and Tmean, respectively) are analyzed separately. Tmax and Tmin are more apt for the study of temperature extremes (see, for instance, Athar, 2012).
The remainder of this paper is organized as follow: section 2 presents the details of the characteristics of temperature regimes along the west coast of SA. Section 3 provides the description of the datasets used, including the Atmospheric-Ocean General Circulation Model (AOGCM) datasets, and the employed methodology. The points-based subjective assignment method used to assess and compare surface temperature forecast skills for commercial weather forecast providers, is mentioned in section 3 only to possibly initiate a regional academic discussion, in line with one of the motivations presented in this section. Section 4 displays and discusses the results of surface temperature forecast skill comparisons based on point assignments and linear correlations, as well as the computed biases. Section 5 summarizes our findings.
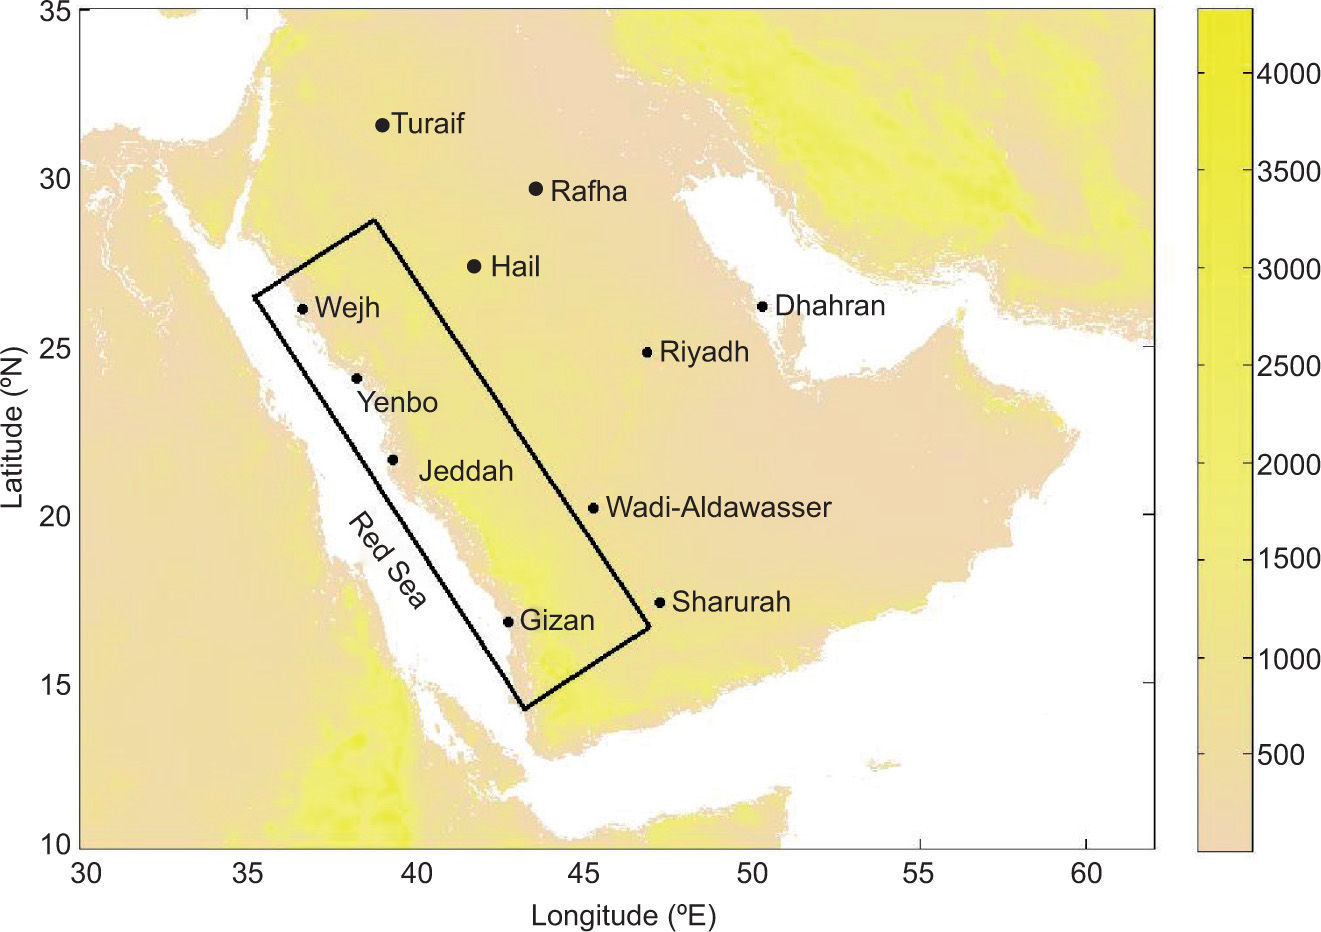
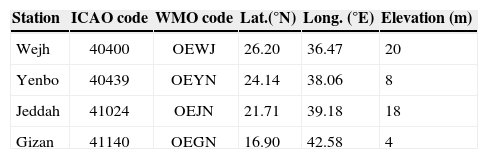
2Temperature regimes of the west coast of Saudi Arabia2.1The west coast of Saudi ArabiaThe geographic and topographic details of the four selected west coast stations (Wejh, Yenbo, Jeddah and Gizan) are displayed in Table I and in Figure 1, respectively. Table I lists the details of the four selected stations including the International Civil Aviation Organization (ICAO) code, the World Meteorological Organization (WMO) code, latitude (°N), longitude (°E), and height (m) above the mean sea level. The selected stations exhibit similar climatic conditions but with different weather features (Al-Jerash, 1985; Ahmed, 1997). The distance between southernmost and northernmost stations in cities of Gizan and Wejh is approximately 1211 km. Wejh and Yenbo are in northern SA, whereas Jeddah and Gizan, are in southern SA, based on the rainfall occurrence patterns (Almazroui et al., 2012a, b). The latitude separation between Gizan and Wejh, is approximately 10º, with the north-south oriented Asir mountain range to the east side of the stations, and the Red Sea on the west side (Fig. 1). The widely varied latitude between Wejh and Gizan allows to assess the relative robustness of the coastal temperature forecasts during the transitional period. The station at Gizan is more under the influence of tropical/monsoonal climate in the transitional period (Walters and Sjoberg, 1988).
Detailed geographical description of the stations along the west coast of SA, used for surface temperature forecast comparison in this study.
| Station | ICAO code | WMO code | Lat.(°N) | Long. (°E) | Elevation (m) |
|---|---|---|---|---|---|
| Wejh | 40400 | OEWJ | 26.20 | 36.47 | 20 |
| Yenbo | 40439 | OEYN | 24.14 | 38.06 | 8 |
| Jeddah | 41024 | OEJN | 21.71 | 39.18 | 18 |
| Gizan | 41140 | OEGN | 16.90 | 42.58 | 4 |
 are marked with a rectangle.")
In SA, the four conventional seasons are: December-January-February (DJF), March-April-May (MAM), June-July-August (JJA), and September-October-November (SON). Though the analysis of climatic features in SA (such as long term seasonal and annual variability, and trends of surface temperatures, in addition to rainfall) have recently become available (see, for instance, Almazroui et al., 2012a, b, and references therein), station-based temperature forecast skill comparison has not yet been presented.
A characteristic feature of the west coast climate of SA is the change in surface temperature regimes, which occurs twice in a calendar year (Walters and Sjoberg, 1988; Fisher and Membery, 1998; Vincent, 2008). The two transitional periods of temperature changes are defined with respect to the conventional four seasons, namely: DJF, MAM, JJA, and SON. The first transitional period is from January 16 to March 16, between DJF and MAM (hereafter referred to as transitional period). The second transitional period is from September 16 to November 15 between JJA and SON. During the transitional periods, the Mediterranean depressions and Asian monsoon based weather systems simultaneously determine the temperature regimes along the west coast of SA (Athar, 2012).
Intense and erratic rainfall during the second transitional period, and prolonged heat spells during the summer season offer less possibilities for tourism in SA, as compared to the first transitional period (see, for instance, Bigano et al., 2006; Almazroui et al., 2012a, b). Furthermore, between the first transitional period and the summer season, massive sand storms are common (for a recent discussion, see, for instance, Maghrabi et al., 2011; Alharbi et al., 2013, and references therein).
The ability of a meso/regional scale climate model to simulate mean daily temperatures and their variability during these months, in particular along the coastal regions, may thus provide a sensitive test bed to assess the performance of a given meso/regional-scale climate model. In SA, surface temperatures in transitional periods are also affected (up to ± 1-1.5 °C) by the passage of mid-latitude migratory anticyclones, more often in northern SA (Athar et al., 2013). The west coast of SA is meteorologically active during the transitional period; concurrently and/or with the termination of short cold spells, series of secondary lows and highs occur along with sand/dust storms and blowing sand (Walters and Sjoberg, 1988).
One of the motivations for selecting four coastal stations (in SA) is to assess the relative temperature forecast skill of several meso/regional-scale weather and climate forecasting models, since these models are known to have biases in forecasting surface temperatures in the planetary boundary layer due to land-sea contrast in coastal areas (see, for instance, Cox et al., 1998; Fildes and Kourentzes, 2011; Kerr, 2011; O’Brien et al., 2012). To reduce and isolate the impacts of model simulations of the strong diurnal cycle present for stations in the inland SA, the selected four stations belong to the same climatic zone in the coastal areas, even though a strong north-south temperature gradient exists (Al-Jerash, 1985). Furthermore, a large fraction of SA population is located along the coastal areas, and a first temperature forecast skill comparison is thus more pertinent primarily for coastal cities (Vincent, 2008).
2.3Climatological considerationsThe observed datasets for the daily Tmin and Tmax for a 31-yr period (1978-2008) were obtained from the Presidency of Meteorology and Environment of Jeddah, SA, for the four selected stations. Quality control of the obtained observed daily temperature datasets was performed before preparing the daily and monthly climatology (Clm), following Athar (2013). The daily Clm for the transitional period was obtained by averaging over 31 years for each calendar day. The monthly Clm was subsequently prepared using the daily Clm for the transitional period. Tmean is computed by averaging Tmax and the Tmin values over the corresponding day.
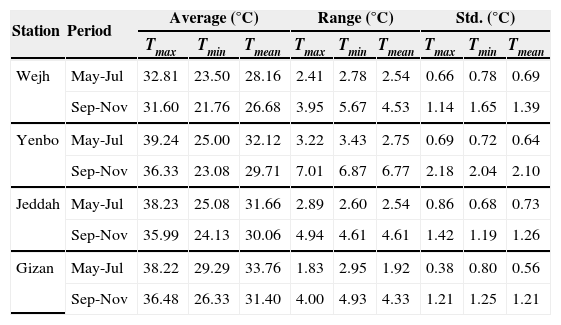
Table II displays the three key statistics for a selected non-transitional period during summer and during the second transitional period, for all the three temperature variables, based on the 31-yr period Clm. The relatively larger difference in the range as well as in the observed one sigma standard deviation during the second transitional period is evident as compared to the non-transitional period. During the second transitional period, Tmax is in the upper 30s, except for the station at Wejh, where it is in the lower 30s.
Average temperature value, range, and one sigma standard deviation (Std.), of all the three temperature variables for Wejh, Yenbo, Jeddah and Gizan for the periods May 16 to July 15, and September 16 to November 15, based on a 31-yr climatology period.
| Station | Period | Average (°C) | Range (°C) | Std. (°C) | ||||||
|---|---|---|---|---|---|---|---|---|---|---|
| Tmax | Tmin | Tmean | Tmax | Tmin | Tmean | Tmax | Tmin | Tmean | ||
| Wejh | May-Jul | 32.81 | 23.50 | 28.16 | 2.41 | 2.78 | 2.54 | 0.66 | 0.78 | 0.69 |
| Sep-Nov | 31.60 | 21.76 | 26.68 | 3.95 | 5.67 | 4.53 | 1.14 | 1.65 | 1.39 | |
| Yenbo | May-Jul | 39.24 | 25.00 | 32.12 | 3.22 | 3.43 | 2.75 | 0.69 | 0.72 | 0.64 |
| Sep-Nov | 36.33 | 23.08 | 29.71 | 7.01 | 6.87 | 6.77 | 2.18 | 2.04 | 2.10 | |
| Jeddah | May-Jul | 38.23 | 25.08 | 31.66 | 2.89 | 2.60 | 2.54 | 0.86 | 0.68 | 0.73 |
| Sep-Nov | 35.99 | 24.13 | 30.06 | 4.94 | 4.61 | 4.61 | 1.42 | 1.19 | 1.26 | |
| Gizan | May-Jul | 38.22 | 29.29 | 33.76 | 1.83 | 2.95 | 1.92 | 0.38 | 0.80 | 0.56 |
| Sep-Nov | 36.48 | 26.33 | 31.40 | 4.00 | 4.93 | 4.33 | 1.21 | 1.25 | 1.21 | |
For comparison, during the (first) transitional period, the northernmost station at Wejh has a 31-yr average Tmax of 25 °C, Tmin of 15 °C, and a Tmean of 20 °C. The southern most station at Gizan is influenced by the tropical climate, with a 31-yr average Tmax of 31 °C, Tmin of 23 °C, and a Tmean of 27 °C; whereas the remaining two stations (Yenbo and Jeddah) are more under the influence of arid climatic conditions. The three temperature variables have quite similar values for a 31-yr average for Yenbo (Jeddah): Tmax of 29 °C (30 °C), Tmin of 15 °C (18 °C), and a Tmean of 22 °C (24 °C), respectively.
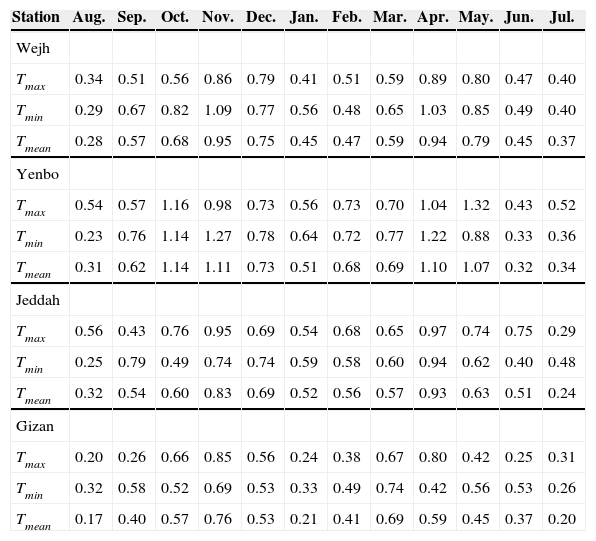
Table III displays the monthly one sigma standard deviation values for all four stations based on a 31-yr period climatology. Relative variations in the standard deviation values can be noticed during the transitional periods. To further quantify the relative transitional nature of temperature in the two transitional periods, three statistics (mean, range, and standard deviation) during the transitional periods were compared with those during the non-transitional periods. The Clm standard deviation values for a selected non-transitional period (May 16 to July 15) displayed relatively lower spreads as compared to those during the two transitional periods, for all the three temperature variables at the four coastal stations; indicating more variability during the transitional periods (not shown). The Clm range values were also compared for all the three temperature variables at the four locations, and relatively larger values were found during the two transitional periods as compared to the selected non-transitional period, with comparatively larger values during the second transitional period (not shown).
One sigma standard deviation values of three temperature variables (oC) for Wejh, Yenbo, Jeddah, and Gizan, for the 31-yr climatology period.
| Station | Aug. | Sep. | Oct. | Nov. | Dec. | Jan. | Feb. | Mar. | Apr. | May. | Jun. | Jul. |
|---|---|---|---|---|---|---|---|---|---|---|---|---|
| Wejh | ||||||||||||
| Tmax | 0.34 | 0.51 | 0.56 | 0.86 | 0.79 | 0.41 | 0.51 | 0.59 | 0.89 | 0.80 | 0.47 | 0.40 |
| Tmin | 0.29 | 0.67 | 0.82 | 1.09 | 0.77 | 0.56 | 0.48 | 0.65 | 1.03 | 0.85 | 0.49 | 0.40 |
| Tmean | 0.28 | 0.57 | 0.68 | 0.95 | 0.75 | 0.45 | 0.47 | 0.59 | 0.94 | 0.79 | 0.45 | 0.37 |
| Yenbo | ||||||||||||
| Tmax | 0.54 | 0.57 | 1.16 | 0.98 | 0.73 | 0.56 | 0.73 | 0.70 | 1.04 | 1.32 | 0.43 | 0.52 |
| Tmin | 0.23 | 0.76 | 1.14 | 1.27 | 0.78 | 0.64 | 0.72 | 0.77 | 1.22 | 0.88 | 0.33 | 0.36 |
| Tmean | 0.31 | 0.62 | 1.14 | 1.11 | 0.73 | 0.51 | 0.68 | 0.69 | 1.10 | 1.07 | 0.32 | 0.34 |
| Jeddah | ||||||||||||
| Tmax | 0.56 | 0.43 | 0.76 | 0.95 | 0.69 | 0.54 | 0.68 | 0.65 | 0.97 | 0.74 | 0.75 | 0.29 |
| Tmin | 0.25 | 0.79 | 0.49 | 0.74 | 0.74 | 0.59 | 0.58 | 0.60 | 0.94 | 0.62 | 0.40 | 0.48 |
| Tmean | 0.32 | 0.54 | 0.60 | 0.83 | 0.69 | 0.52 | 0.56 | 0.57 | 0.93 | 0.63 | 0.51 | 0.24 |
| Gizan | ||||||||||||
| Tmax | 0.20 | 0.26 | 0.66 | 0.85 | 0.56 | 0.24 | 0.38 | 0.67 | 0.80 | 0.42 | 0.25 | 0.31 |
| Tmin | 0.32 | 0.58 | 0.52 | 0.69 | 0.53 | 0.33 | 0.49 | 0.74 | 0.42 | 0.56 | 0.53 | 0.26 |
| Tmean | 0.17 | 0.40 | 0.57 | 0.76 | 0.53 | 0.21 | 0.41 | 0.69 | 0.59 | 0.45 | 0.37 | 0.20 |
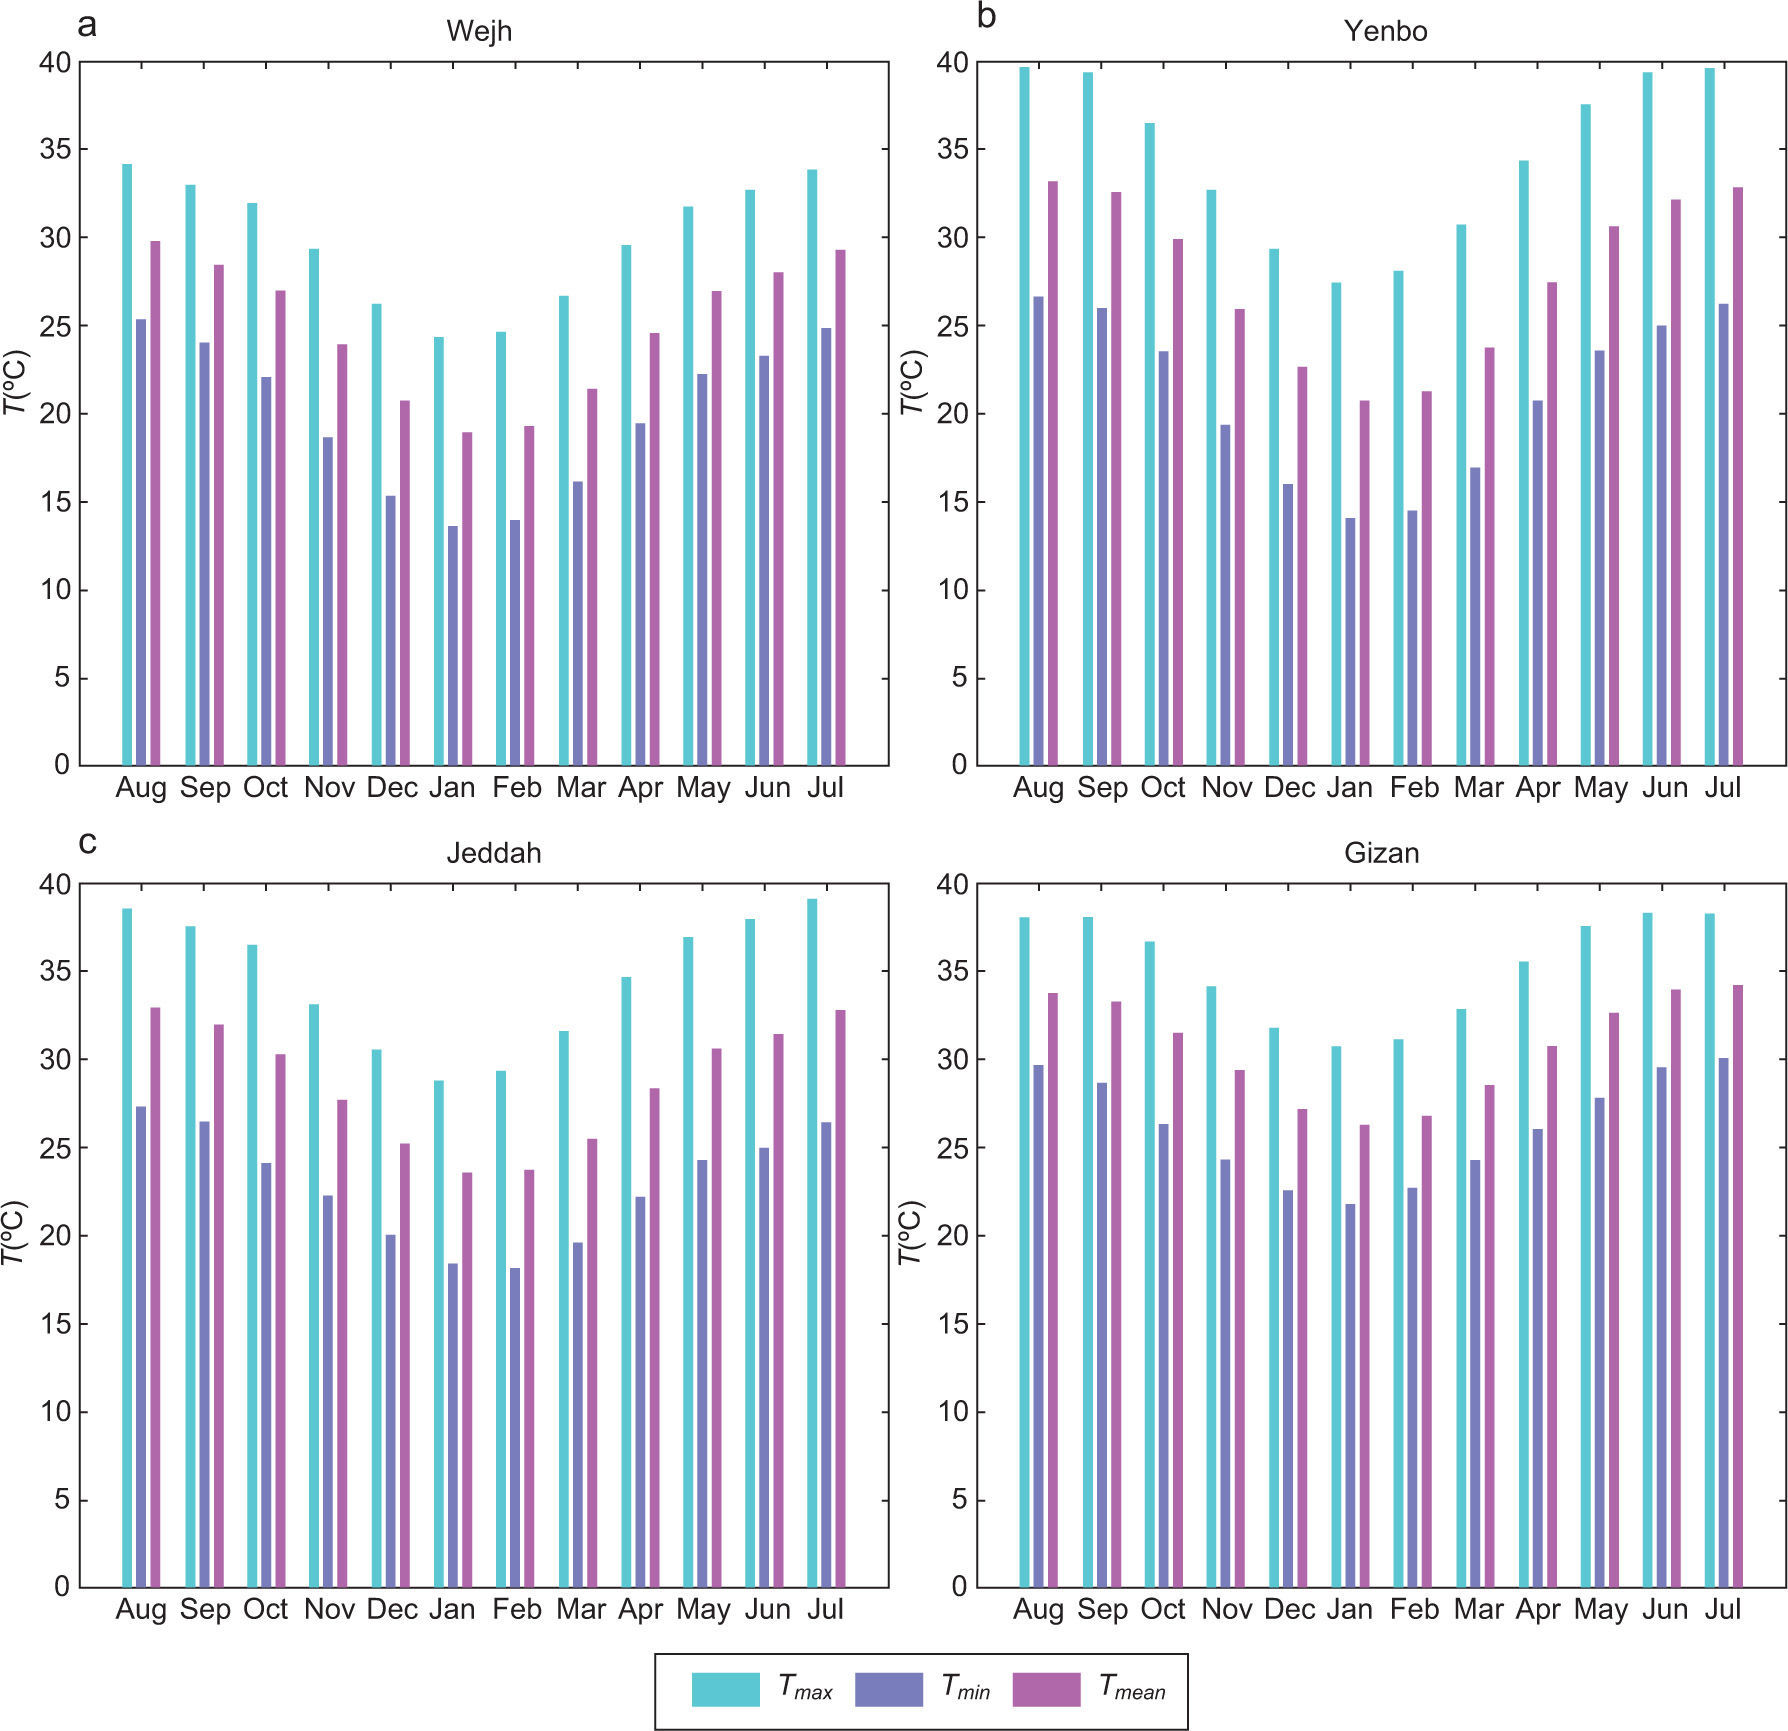
Figure 2 displays the annual cycle of the three temperature variables for each of the stations based on the 31-yr period Clm. It is clear from Figure 2 that during the transitional period under study (January-March), the three temperature variables are at their relative minima. In particular, Tmax typically ranges between lower to upper 30s during these months. In contrast, during the May to August period, temperature variables are at their relative maxima. Also, during the second transitional period, all three temperature variables are displaying relative higher values as compared to the (first) transitional period.
 climatology.")
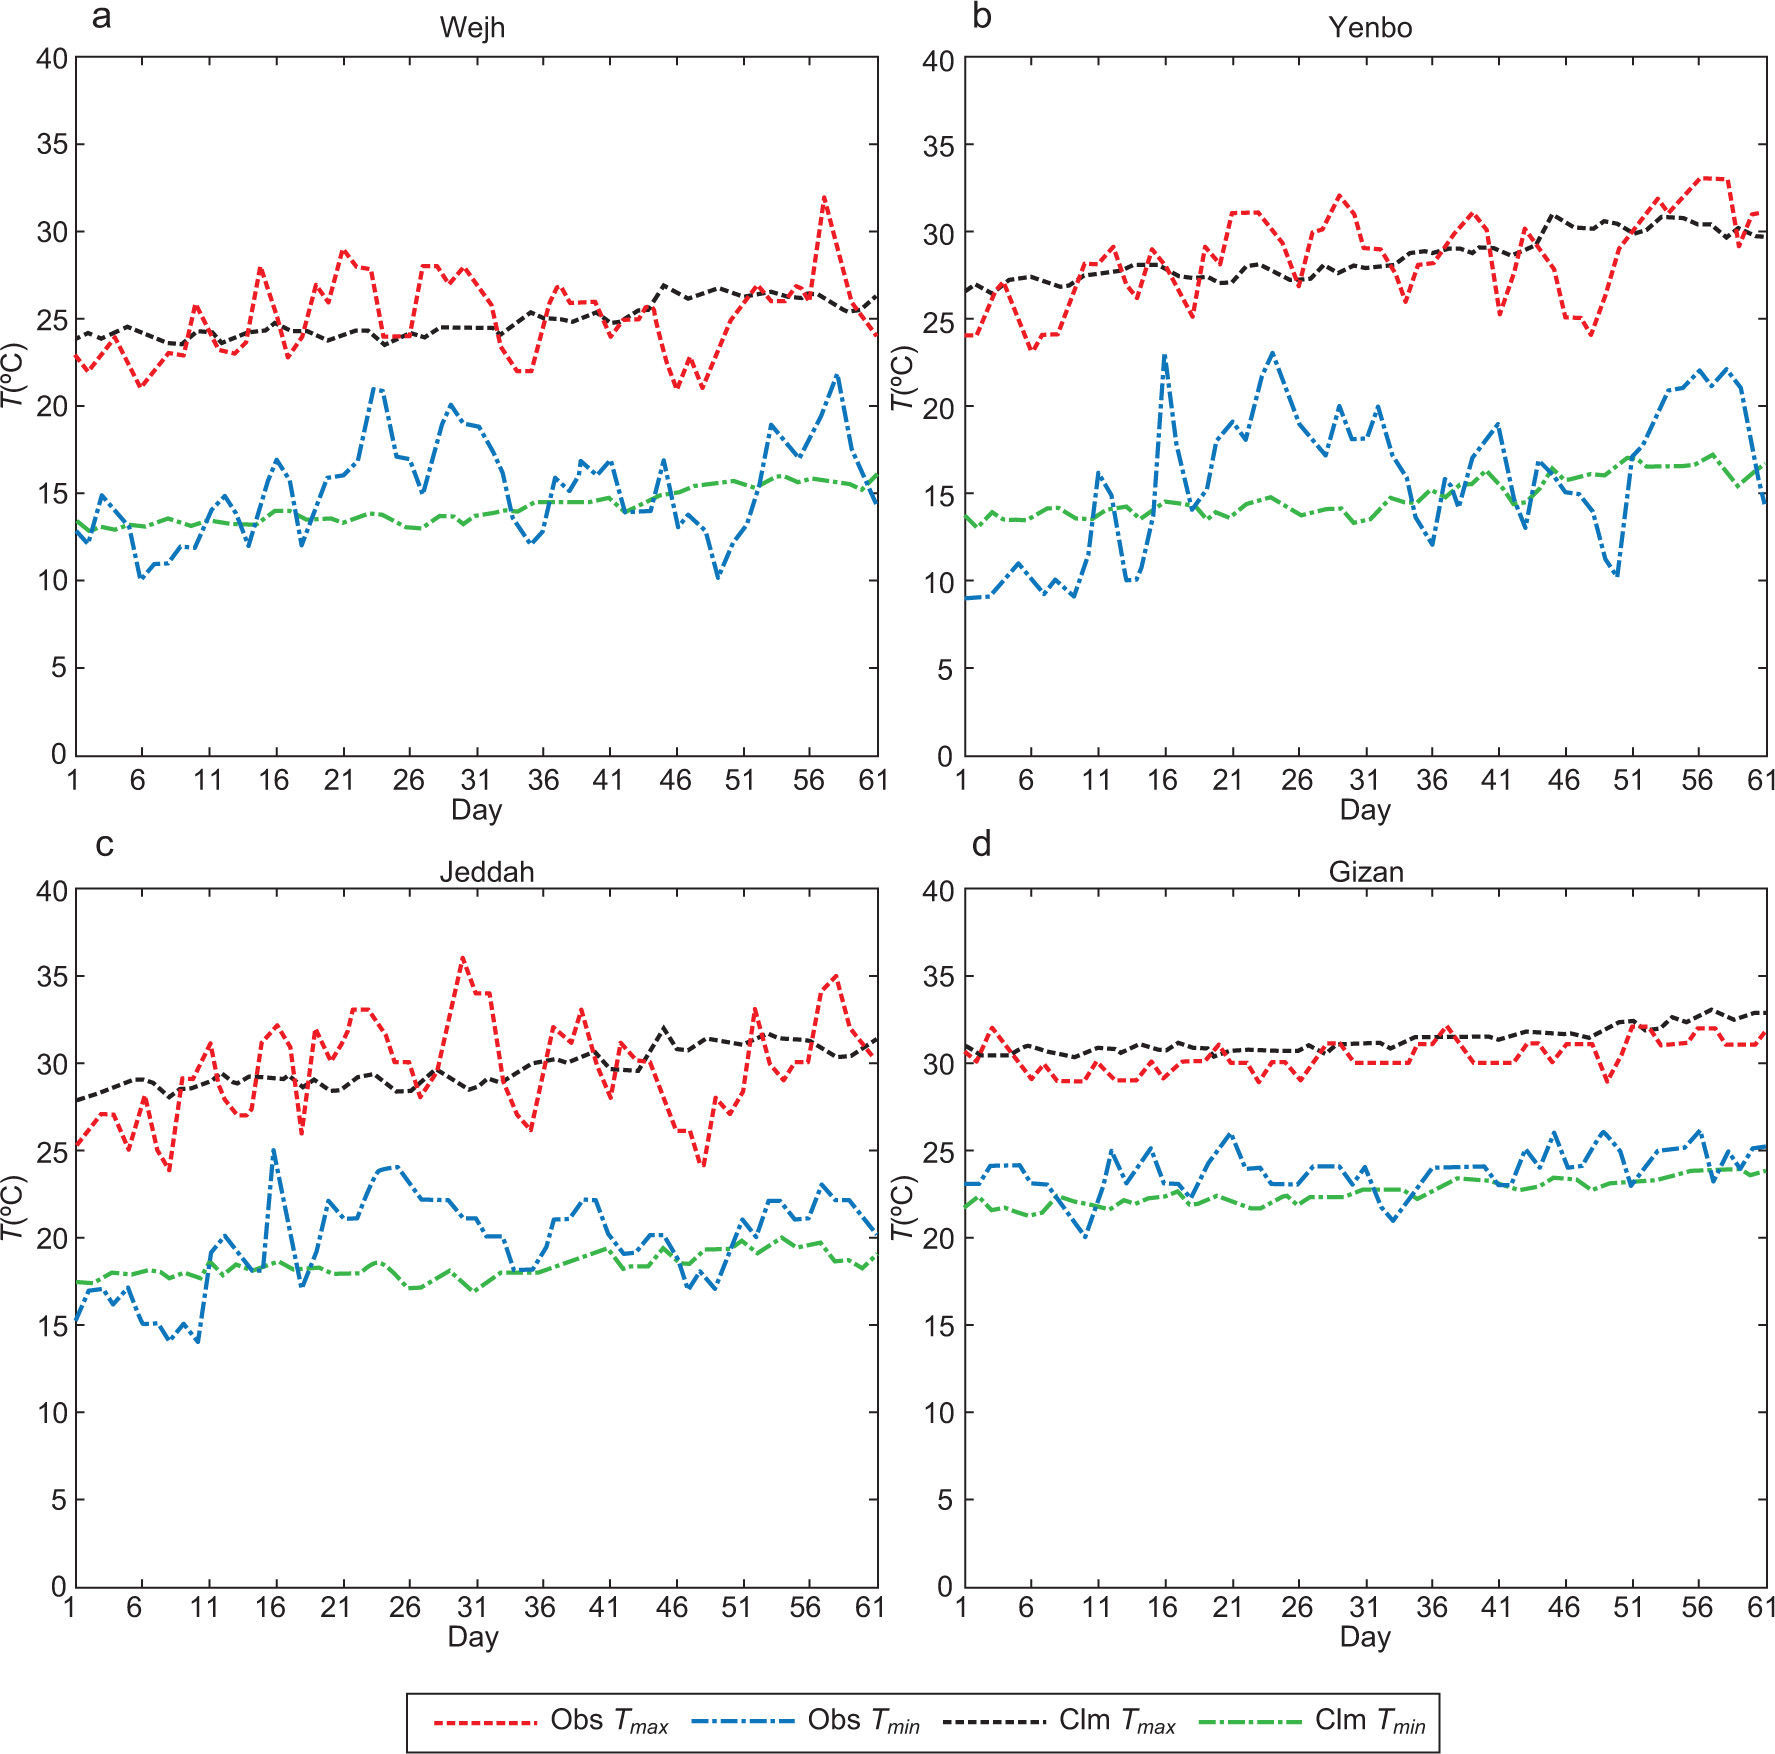
Figure 3 provides some further finer details of the relative comparison between the observed Tmax and Tmin (during the study period) and the Clm based same-temperature variables for all the four stations. On average, fluctuations in observed Tmin are larger as compared to those in Tmax and these are smallest for the station at Gizan. This is in part indicative of a more dominating influence of the Mediterranean based weather system for stations located in northern SA (Vincent, 2008).
3Data collection and methodology3.1NWP based commercial weather forecast data-sets during the study period. The Clm values are based on the 31-yr period (1978-2008).")
The temperature forecast datasets were collected from eight different forecast providers: five international TV based weather information providers, one local provider and two Internet based weather information providers, all accessible locally. For the protection of all the concerned, the eight providers have been assigned with numbers 1 to 8 randomly (P1 to P8). P2 and P7 are forecasting for all the four stations the same values for temperature (Tmin and Tmax), whereas P3 and P8 are also forecasting for all the four stations the same values for temperature (Tmin and Tmax). As a result, only P2 and P3 were selected for further considerations. P1, P2, P3, and P4 forecasted for all the four stations, whereas P5 (P6) forecasted for two (one) stations. Specifically, P5 forecasted for Jeddah and Gizan, whereas P6 forecasted for Jeddah only. Multiple city temperature forecast is best viewed with P1 and with P2, relative to the other forecast providers selected for this study. Thus, the Tmin and Tmax forecasts from a total of six commercial weather forecast providers (P1 to P6) were recorded on a daily basis (i.e. on a 24 h period basis).
The starting date for the record of the forecasted and observed daily temperatures at the four selected locations is January 16, 2012 and the ending date is March 16, 2012. The observed and forecasted temperature datasets for consecutive 61 days are analyzed for skill score comparison purposes.
Observed Tmin and Tmax (referred to as Obs) are obtained twice a day from the website maintained by the National Oceanic and Atmospheric Administration (NOAA) (http://weather.noaa.gov/weather/SA_cc.html) for all the stations. This NOAA website displays and maintains the hourly temperature record for current 24 hours only. Observed Tmin was recorded at 07:00 UTC, whereas the observed Tmax was recorded at 14:00 UTC. The observed Tmin occurs at approximately 03:00 UTC, whereas observed Tmax occurs at approximately 12:00 UTC during the considered transitional period. Local time in SA is + 3 h of UTC. The temperature forecast for the next-day (tomorrow) was recorded at 10:00 UTC, since one provider (P1) updates its website for the next-day forecast at this time.
An e-mail letter was sent to all commercial weather forecast providers to inquire about the NWP model and the procedure used in the forecast displayed on the websites. One reply was received: P5 is using the UKMet model for temperature forecasts. P1 is using weather research and a forecasting (WRF) model for the temperature forecasts (personal communication).
3.2AOGCM-based datasetsDatasets from two versions of the Geophysical Fluid Dynamics Laboratory (GFDL) AOGCM are used for comparison with the above Obs and NWP model-based outputs. These two versions are CM2.0 and CM2.1 (Delworth et al., 2006). The main differences between CM2.0 and CM2.1 include the use of different dynamical cores, ocean component’s time-stepping scheme and the lateral viscosity. The daily Tmax and Tmin datasets were obtained from the GFDL data portal (http://data1.gfdl.noaa.gov/). For each version of the AOGCM for the 21st century runs, datasets were available from one run under the IPCC Special Report on Emission Scenarios (SRES) A1B scenario (IPCC, 2007). Both versions of the AOGCM have a horizontal grid resolution of 2.5º longitude × 2.0º latitude, although there is a difference of starting latitude. Latitude values range between –89º and 89º for CM 2.0, whereas for CM2.1 values range between –89.49º and 89.49º. Both versions of the AOGCM have 24 vertical levels in the atmosphere. The Obs and the NWP model based datasets are then compared with the corresponding AOGCM-based daily grid-box datasets nearest to the stations, for the overlapping period.
3.3Subjective point based skill scoresBased on a subjective interpretation of the forecast, points are assigned to the Obs and NWP model-based forecasts for Tmin and Tmax, following Lupo and Market (2002), hereafter referred to as LM02. For instance, if the observed temperature is 20 °C, two points are awarded if the forecasted temperature is in the range of ± 1 °C (namely, between 19 °C and 21 °C), and one point is awarded if the forecasted temperature is in the range of ± 2 °C (namely, between 18 °C and 22 °C). Outside the range of ± 2 °C, a score of zero points is assigned. This procedure tends to progressively penalize for increased absolute bias in the forecasted surface temperature.
LM02 took a range of ± 2 °F and ± 4 °F, instead of ± 1 °C and ± 2 °C, respectively. The study upon which the LM02 formula is based (Thornes and Proctor, 1999), and the LM02 study itself are for higher latitude-based stations (> 38 °N), whereas the stations under study are situated in a relatively lower latitude sub-tropical region (< 27 °N). The amplitudes of mid-latitude based secondary lows and highs are thus weaker for SA stations, resulting in lesser surface temperature fluctuations (Walters and Sjoberg, 1988). This may provide some justification for the selection of a narrower point-scoring range, resulting in more stringent skill comparison and being closer to Clm. Also, given the (first) transitional period, the stations considered in SA are less affected by monsoonal weather systems.
The following modified formula was used to compute the average daily total forecast score (F), following LM02:

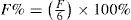
Fmax stands for the assigned point score for Tmax and likewise. The formula given by Eq. (1) indicates that a perfect (missed) average daily total forecast score would have a value of 6 (0). The normalized percent average daily total forecast score (F%) is defined as
The forecast skill (S), expressed in percent, is defined using a linear error difference formula (see, for instance, Wilks, 2011):
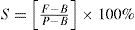
In Eq. (3), B is the baseline score, and P represents the perfect forecast score, taken as Obs. The baseline is Clm. This formula permits negative S values. A value of S equal to 100% implies a perfect skill score. Commonly used statistics (such as mean and standard deviation) are employed to quantify the relative difference between the forecasted temperature and observations (Wilks, 2011).
3.4Correlation coefficient and bias computationThe linear correlation coefficient (CC) was computed using the following formula between the NWP model outputs, Clm, AOGCM, and the Obs datasets:
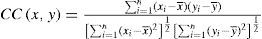
where the overbar stands for the mean of the variable (Wilks, 2011). The bias was computed by subtracting the daily model-based forecasted temperatures from the observations.
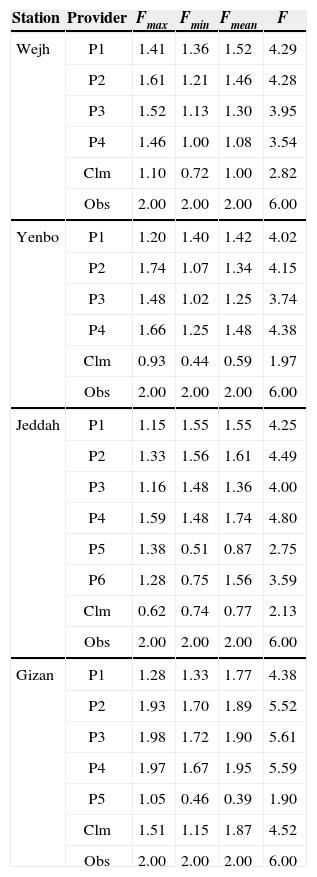
4Results and discussion4.1Points based skill scoresThe forecast evaluation results for the period of consecutive 61 days and nights are displayed in Table IV, using Eq. (1) for all the four stations, from all the providers. The forecast score for each temperature variable is averaged over the entire forecasting period. For each station, all the NWP forecast providers performed better than Clm, except for P1 and P5 for Gizan (for all the temperature variables collectively). Overall, at F level comparison, the best temperature forecasts are by P4. The F scores for Gizan are relatively higher since temperature variations are relatively lower (see Table III).
Average daily total forecast score for each temperature variable for the four stations under study (Wejh, Yenbo, Jeddah and Gizan) in SA by all the NWP model forecast providers, including score for Clm and Obs. The last column displays the F given by Eq. (1).
| Station | Provider | Fmax | Fmin | Fmean | F |
|---|---|---|---|---|---|
| Wejh | P1 | 1.41 | 1.36 | 1.52 | 4.29 |
| P2 | 1.61 | 1.21 | 1.46 | 4.28 | |
| P3 | 1.52 | 1.13 | 1.30 | 3.95 | |
| P4 | 1.46 | 1.00 | 1.08 | 3.54 | |
| Clm | 1.10 | 0.72 | 1.00 | 2.82 | |
| Obs | 2.00 | 2.00 | 2.00 | 6.00 | |
| Yenbo | P1 | 1.20 | 1.40 | 1.42 | 4.02 |
| P2 | 1.74 | 1.07 | 1.34 | 4.15 | |
| P3 | 1.48 | 1.02 | 1.25 | 3.74 | |
| P4 | 1.66 | 1.25 | 1.48 | 4.38 | |
| Clm | 0.93 | 0.44 | 0.59 | 1.97 | |
| Obs | 2.00 | 2.00 | 2.00 | 6.00 | |
| Jeddah | P1 | 1.15 | 1.55 | 1.55 | 4.25 |
| P2 | 1.33 | 1.56 | 1.61 | 4.49 | |
| P3 | 1.16 | 1.48 | 1.36 | 4.00 | |
| P4 | 1.59 | 1.48 | 1.74 | 4.80 | |
| P5 | 1.38 | 0.51 | 0.87 | 2.75 | |
| P6 | 1.28 | 0.75 | 1.56 | 3.59 | |
| Clm | 0.62 | 0.74 | 0.77 | 2.13 | |
| Obs | 2.00 | 2.00 | 2.00 | 6.00 | |
| Gizan | P1 | 1.28 | 1.33 | 1.77 | 4.38 |
| P2 | 1.93 | 1.70 | 1.89 | 5.52 | |
| P3 | 1.98 | 1.72 | 1.90 | 5.61 | |
| P4 | 1.97 | 1.67 | 1.95 | 5.59 | |
| P5 | 1.05 | 0.46 | 0.39 | 1.90 | |
| Clm | 1.51 | 1.15 | 1.87 | 4.52 | |
| Obs | 2.00 | 2.00 | 2.00 | 6.00 |
The NWP model used by P5 has a known bias in forecasting temperature for the coastal areas, whereas among other commercial weather forecast providers, P3 has a more thorough check and balance system to initialize the forecasts. Furthermore, for Gizan, several other upper air weather features play a role in determining weather conditions, which is essentially absent for the other three stations. These features include, but are not limited to, the climatological Red Sea trough, the Sudan low, and the relative vicinity of the subtropical high (see, for instance, Walters and Sjoberg, 1988). Detailed simulation studies are required by various NWP models with varying complexity to further investigate these points, which is beyond the scope of this study.
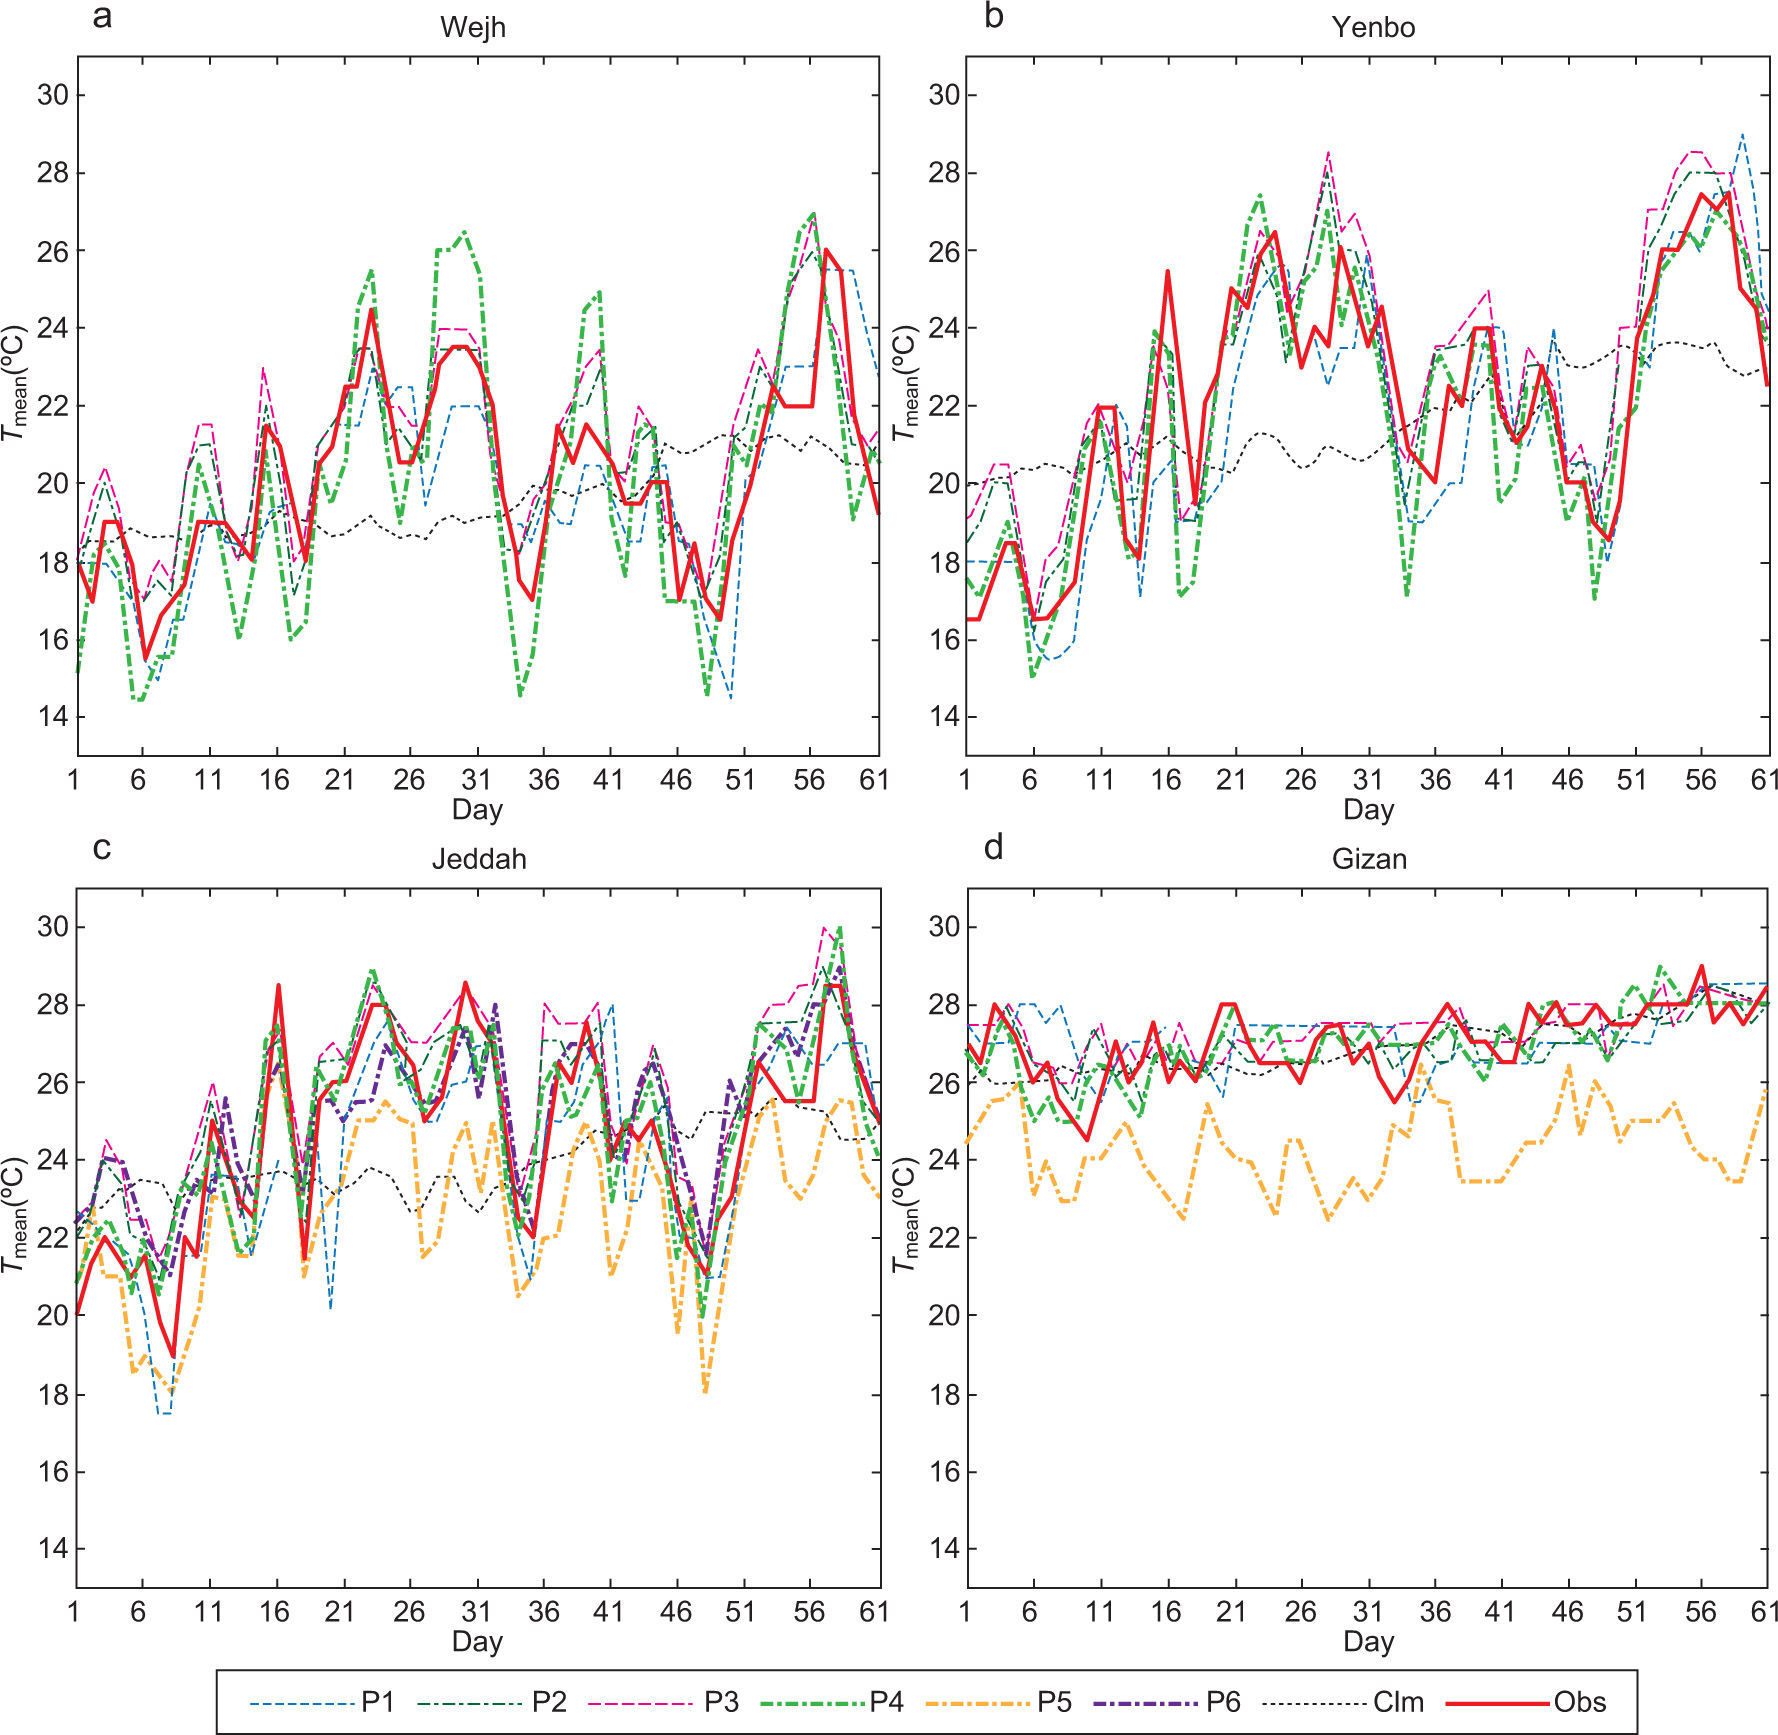
Figure 4 displays the Tmean time series for all the stations for the whole transitional period, based on forecasts by P1 to P6, including Clm and Obs. All stations displayed progressively rising fluctuations in Tmean, with station at Wejh (northmost) having absolute minimum values for Tmean, which reflects the dominant continual passage of Mediterranean-based migratory secondary lows (and highs). The amplitude of Tmean fluctuations is smallest for the station at Gizan. Similar conclusions were drawn from the analysis of the time series behavior of Tmax and Tmin (not shown).
 for all the considered NWP model forecast providers (P1 to P6), including the Clm and Obs, for the duration of the forecast comparison period for stations at (a) Wejh, (b) Yenbo, (c) Jeddah, and (d) Gizan (see text for more details).")
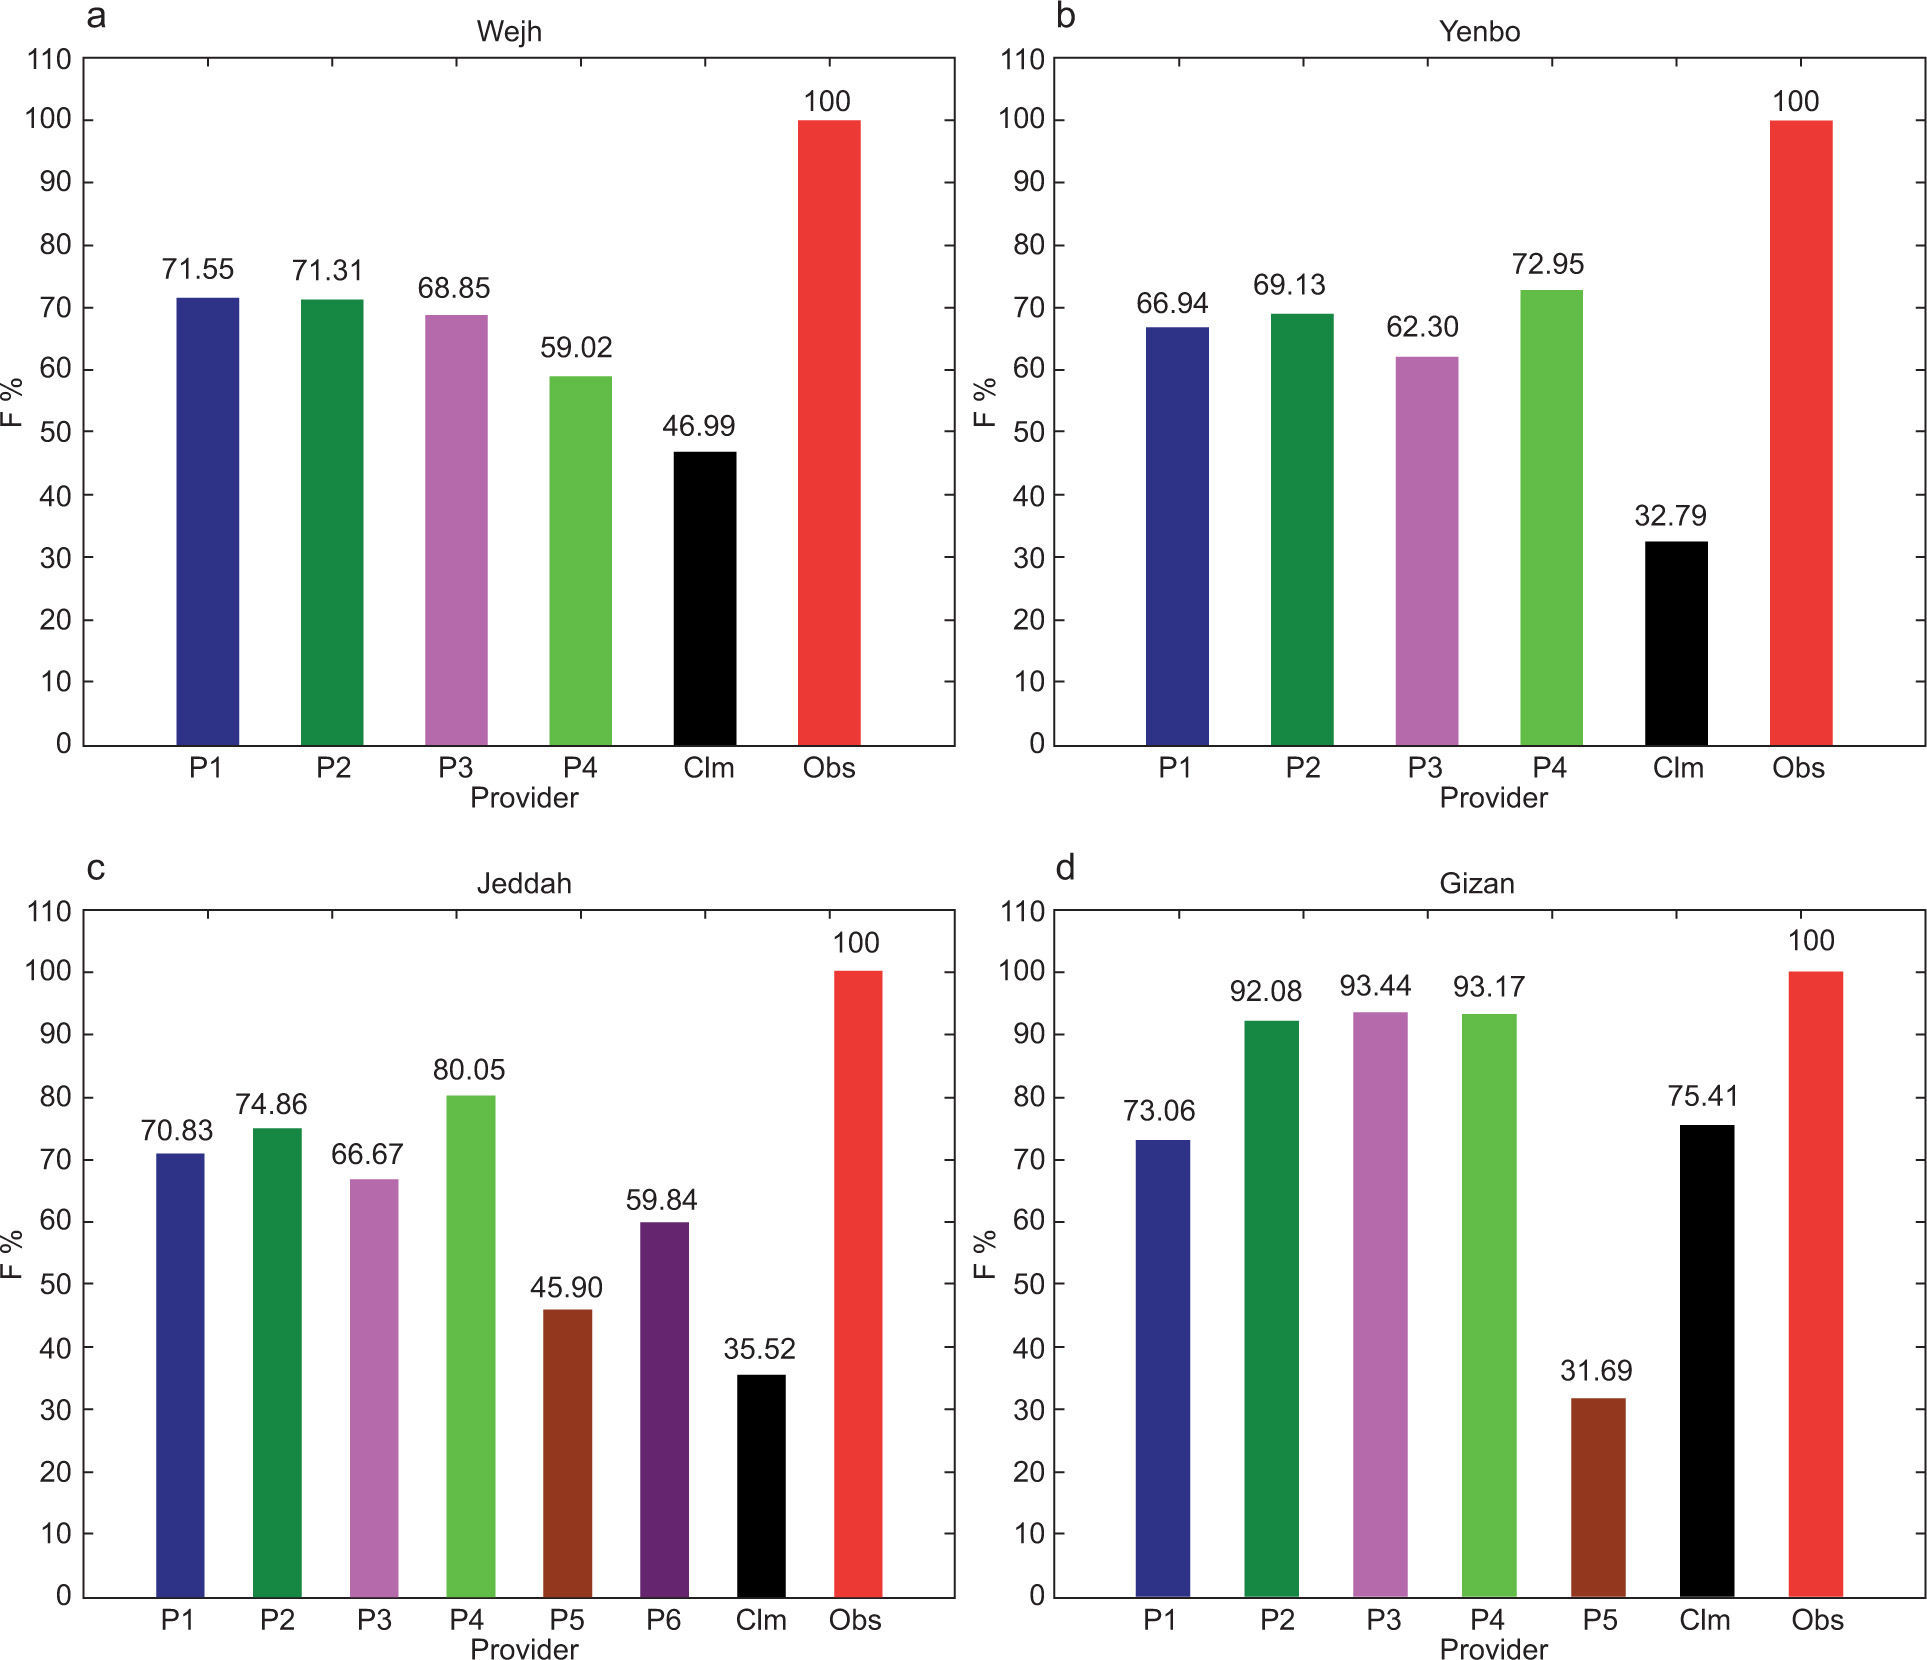
Figure 5 displays the normalized total F as percent (F%) using Eq. (2) for 61 days and nights for Wejh, Yenbo, Jeddah and Gizan, for all the NWP model forecast providers. All the NWP model forecast providers including Clm have either under- or over-estimated the observed temperature (since F < 100%). For the city of Wejh (Gizan), P1 (P3) and P2 (P4), have performed almost similarly. Overall, the relative best performer is P3 for the city of Gizan, with a difference less than –6.6% (the city of Gizan is in the southernmost region of SA, with an elevation of only 4 m).
 for the duration of the forecast comparison period for all the NWP model forecast providers, including the Clm and Obs, for stations at (a) Wejh, (b) Yenbo, (c) Jeddah, and (d) Gizan.")
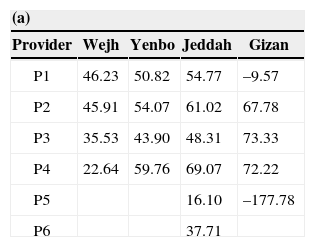
The cumulative comparative skill score results for the study period are displayed in Table V(a), using Eq. (3). P3 and P4 have skill scores relatively closer to a perfect score (100%) for Gizan, over the period of forecast comparison. P1 and P5 have negative S values for Gizan indicating lower performance than Clm.
(a) Average percentage skill score (S) using Eq. (3), for the 61 days and nights period from January 16 to March 16, 2012, for the stations at Wejh, Yenbo, Jeddah and Gizan, by all the NWP model forecast providers. (b) Same as (a) but based on 1000 bootstrap samples.
| (a) | ||||
|---|---|---|---|---|
| Provider | Wejh | Yenbo | Jeddah | Gizan |
| P1 | 46.23 | 50.82 | 54.77 | –9.57 |
| P2 | 45.91 | 54.07 | 61.02 | 67.78 |
| P3 | 35.53 | 43.90 | 48.31 | 73.33 |
| P4 | 22.64 | 59.76 | 69.07 | 72.22 |
| P5 | 16.10 | –177.78 | ||
| P6 | 37.71 | |||
| (b) | ||||
|---|---|---|---|---|
| Provider | Wejh | Yenbo | Jeddah | Gizan |
| P1 | 46.25 | 50.67 | 54.67 | –10.57 |
| P2 | 45.36 | 54.00 | 60.92 | 67.48 |
| P3 | 35.83 | 43.61 | 47.87 | 73.39 |
| P4 | 22.61 | 59.04 | 69.10 | 72.12 |
| P5 | 15.89 | –181.35 | ||
| P6 | 37.40 | |||
The total forecast score (Fs) samples for Obs, Clm, and for all Ps were resampled randomly 1000 times with replacement and then Eq. (3) was used to compute the corresponding F% for each of the bootstrapped resamples. Lastly, the mean F% was computed and is displayed in Table V(b). No parameters are involved in obtaining the bootstrapped resamples. The same hierarchal differences among various commercial weather forecast providers (Ps) tend to survive, thus supporting our findings.
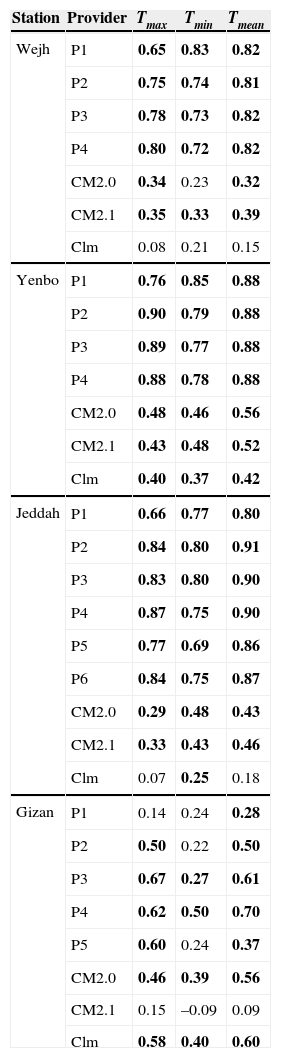
4.2Correlation coefficient-based comparisonsThe CC value for the NWP model forecasted Tmax and Tmin with the corresponding observed Tmax and Tmin is better than Clm at the 95 % confidence level (CL), except for the station at Gizan for P1, P2 and P5, where Clm performed better (Table VI). In fact, Figure 4d indicates that there is an almost out of phase relationship between the forecasted and observed Tmean for the city of Gizan for P5. In general, these observations are indicative of good agreement between two different measures to compare the NWP model-based forecast skill, although caution needs to be exercised for such a comparison (Murphy, 1988). To some extent, this is indicative of the contemporary challenges faced by the NWP models to mimic the surface temperature for stations in mountainous terrains. As pointed out earlier, a relevant remark may be the climatological vicinity of the active Sudan low/ Red Sea trough during the spring season for Gizan (Almazroui et al. 2012c, and references therein).
Correlation coefficients between all the NWP model forecast providers, Clm, AOGCMs, and observations for each station, using Eq. (4), for the period from January 16 to March 16, 2012. Numbers in bold refer to correlation coefficients that are significant at the 95% CL.
| Station | Provider | Tmax | Tmin | Tmean |
|---|---|---|---|---|
| Wejh | P1 | 0.65 | 0.83 | 0.82 |
| P2 | 0.75 | 0.74 | 0.81 | |
| P3 | 0.78 | 0.73 | 0.82 | |
| P4 | 0.80 | 0.72 | 0.82 | |
| CM2.0 | 0.34 | 0.23 | 0.32 | |
| CM2.1 | 0.35 | 0.33 | 0.39 | |
| Clm | 0.08 | 0.21 | 0.15 | |
| Yenbo | P1 | 0.76 | 0.85 | 0.88 |
| P2 | 0.90 | 0.79 | 0.88 | |
| P3 | 0.89 | 0.77 | 0.88 | |
| P4 | 0.88 | 0.78 | 0.88 | |
| CM2.0 | 0.48 | 0.46 | 0.56 | |
| CM2.1 | 0.43 | 0.48 | 0.52 | |
| Clm | 0.40 | 0.37 | 0.42 | |
| Jeddah | P1 | 0.66 | 0.77 | 0.80 |
| P2 | 0.84 | 0.80 | 0.91 | |
| P3 | 0.83 | 0.80 | 0.90 | |
| P4 | 0.87 | 0.75 | 0.90 | |
| P5 | 0.77 | 0.69 | 0.86 | |
| P6 | 0.84 | 0.75 | 0.87 | |
| CM2.0 | 0.29 | 0.48 | 0.43 | |
| CM2.1 | 0.33 | 0.43 | 0.46 | |
| Clm | 0.07 | 0.25 | 0.18 | |
| Gizan | P1 | 0.14 | 0.24 | 0.28 |
| P2 | 0.50 | 0.22 | 0.50 | |
| P3 | 0.67 | 0.27 | 0.61 | |
| P4 | 0.62 | 0.50 | 0.70 | |
| P5 | 0.60 | 0.24 | 0.37 | |
| CM2.0 | 0.46 | 0.39 | 0.56 | |
| CM2.1 | 0.15 | –0.09 | 0.09 | |
| Clm | 0.58 | 0.40 | 0.60 |
The two versions of the AOGCM have statistically significant CCs except for Wejh for CM2.0 Tmin, and for Gizan for CM2.1, for all temperature variables. Thus, despite having coarse spatial resolution, the two versions of the considered AOGCM have displayed overall good realism to mimic the daily variability in surface temperature for coastal stations during the transitional period. In general, the magnitude of the statistically significant CC is higher for the NWP model-based forecasts as compared to those based on the AOGCM.
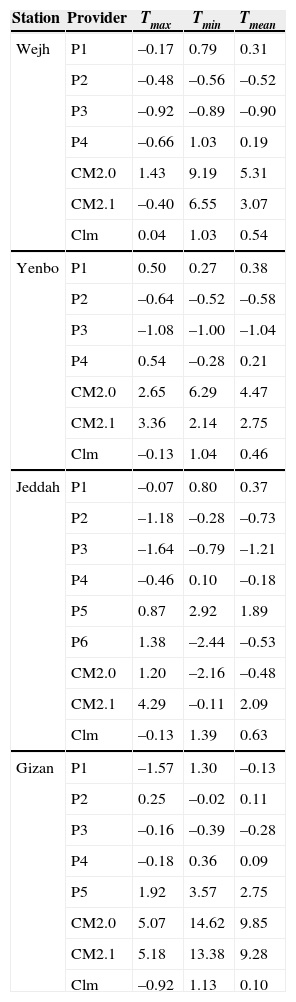
4.3Forecast bias comparisonsTable VII displays the average daily bias relative to Obs for all the NWP model output providers, including the two versions of the AOGCM. In general, mostly the NWP model-based providers’ temperature forecasts displayed a cold bias. The largest (smallest) absolute bias was displayed by P5 (P2) for Gizan for Tmin, amounting to 3.57 °C (0.02 °C). These findings may be of more relevance if applied to socio-economic sectors, such as the tourism sector.
Average daily bias (°C) for the period from January 16 to March 16, 2012 for Wejh, Yenbo, Jeddah and Gizan (see text for more details).
| Station | Provider | Tmax | Tmin | Tmean |
|---|---|---|---|---|
| Wejh | P1 | –0.17 | 0.79 | 0.31 |
| P2 | –0.48 | –0.56 | –0.52 | |
| P3 | –0.92 | –0.89 | –0.90 | |
| P4 | –0.66 | 1.03 | 0.19 | |
| CM2.0 | 1.43 | 9.19 | 5.31 | |
| CM2.1 | –0.40 | 6.55 | 3.07 | |
| Clm | 0.04 | 1.03 | 0.54 | |
| Yenbo | P1 | 0.50 | 0.27 | 0.38 |
| P2 | –0.64 | –0.52 | –0.58 | |
| P3 | –1.08 | –1.00 | –1.04 | |
| P4 | 0.54 | –0.28 | 0.21 | |
| CM2.0 | 2.65 | 6.29 | 4.47 | |
| CM2.1 | 3.36 | 2.14 | 2.75 | |
| Clm | –0.13 | 1.04 | 0.46 | |
| Jeddah | P1 | –0.07 | 0.80 | 0.37 |
| P2 | –1.18 | –0.28 | –0.73 | |
| P3 | –1.64 | –0.79 | –1.21 | |
| P4 | –0.46 | 0.10 | –0.18 | |
| P5 | 0.87 | 2.92 | 1.89 | |
| P6 | 1.38 | –2.44 | –0.53 | |
| CM2.0 | 1.20 | –2.16 | –0.48 | |
| CM2.1 | 4.29 | –0.11 | 2.09 | |
| Clm | –0.13 | 1.39 | 0.63 | |
| Gizan | P1 | –1.57 | 1.30 | –0.13 |
| P2 | 0.25 | –0.02 | 0.11 | |
| P3 | –0.16 | –0.39 | –0.28 | |
| P4 | –0.18 | 0.36 | 0.09 | |
| P5 | 1.92 | 3.57 | 2.75 | |
| CM2.0 | 5.07 | 14.62 | 9.85 | |
| CM2.1 | 5.18 | 13.38 | 9.28 | |
| Clm | –0.92 | 1.13 | 0.10 |
From the model diagnostics point of view, the NWP model forecast providers displayed a cold or warm bias. When averaged over three or more stations, the maximum (minimum) cold bias was shown by P3 (P4), amounting to –0.95 °C (–0.19 °C), respectively, for Tmax. Similarly, the maximum (minimum) warm bias was shown by P1 (P4), amounting to 0.79 °C (0.30 °C), respectively, for Tmin.
The GFDL-based coarse resolution CM2.0 and CM2.1 displayed relatively larger biases as compared to the NWP models used by providers P1 to P6. Except for the station at Gizan, the CM2.0 displayed a relatively smaller bias as compared to CM2.1 for Tmax, for which the biases are quite large for all temperature variables. Both versions of the AOGCM seem unable to resolve the land-sea contrast in the diurnal cycle of surface temperature in the transitional period, as compared to the fine resolution NWP models. A comparison of Table VI and Table VII reveals that the two versions of the AOGCM performed relatively better in mimicking the surface temperature variability than the mean, during the transitional period.
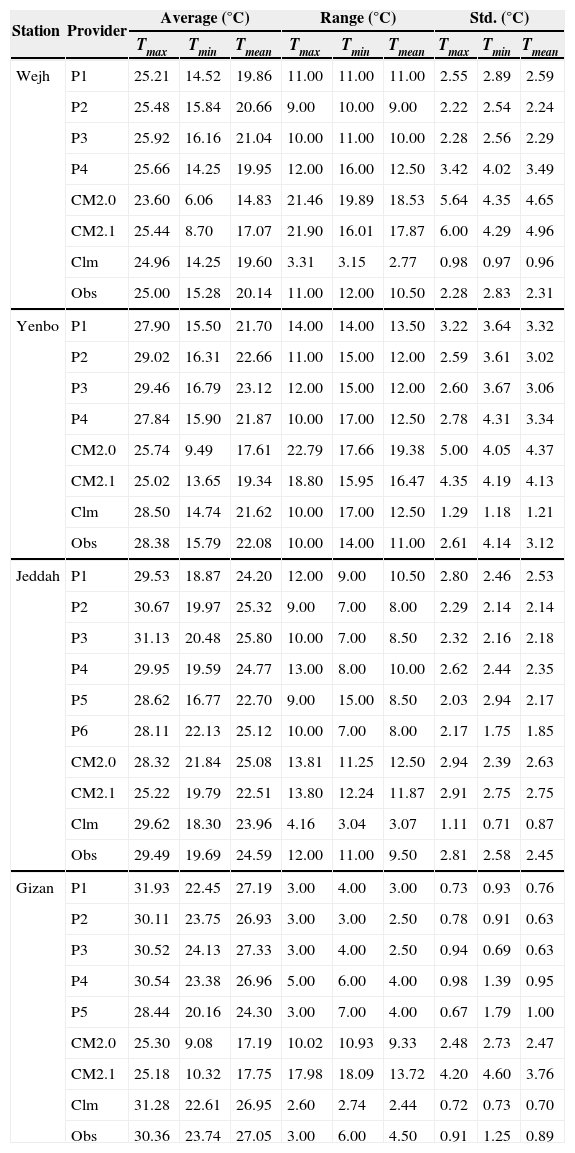
To provide a general relative forecast performance perspective during the entire transitional period of 61 days, three commonly used statistics (average, range, and one sigma standard deviation) are displayed in Table VIII, for each station and for each considered forecast provider, for all the temperature variables. Clm has the lowest one sigma standard deviation values (in Celsius degrees) for all the stations, thus somewhat justifying its use as a standard of reference to compare with other forecasted temperature values.
Average temperature value, range, and one sigma standard deviation (Std.) of all three temperature variables for Wejh, Yenbo, Jeddah and Gizan for the 61-day period from January 16 to March 16, 2012.
| Station | Provider | Average (°C) | Range (°C) | Std. (°C) | ||||||
|---|---|---|---|---|---|---|---|---|---|---|
| Tmax | Tmin | Tmean | Tmax | Tmin | Tmean | Tmax | Tmin | Tmean | ||
| Wejh | P1 | 25.21 | 14.52 | 19.86 | 11.00 | 11.00 | 11.00 | 2.55 | 2.89 | 2.59 |
| P2 | 25.48 | 15.84 | 20.66 | 9.00 | 10.00 | 9.00 | 2.22 | 2.54 | 2.24 | |
| P3 | 25.92 | 16.16 | 21.04 | 10.00 | 11.00 | 10.00 | 2.28 | 2.56 | 2.29 | |
| P4 | 25.66 | 14.25 | 19.95 | 12.00 | 16.00 | 12.50 | 3.42 | 4.02 | 3.49 | |
| CM2.0 | 23.60 | 6.06 | 14.83 | 21.46 | 19.89 | 18.53 | 5.64 | 4.35 | 4.65 | |
| CM2.1 | 25.44 | 8.70 | 17.07 | 21.90 | 16.01 | 17.87 | 6.00 | 4.29 | 4.96 | |
| Clm | 24.96 | 14.25 | 19.60 | 3.31 | 3.15 | 2.77 | 0.98 | 0.97 | 0.96 | |
| Obs | 25.00 | 15.28 | 20.14 | 11.00 | 12.00 | 10.50 | 2.28 | 2.83 | 2.31 | |
| Yenbo | P1 | 27.90 | 15.50 | 21.70 | 14.00 | 14.00 | 13.50 | 3.22 | 3.64 | 3.32 |
| P2 | 29.02 | 16.31 | 22.66 | 11.00 | 15.00 | 12.00 | 2.59 | 3.61 | 3.02 | |
| P3 | 29.46 | 16.79 | 23.12 | 12.00 | 15.00 | 12.00 | 2.60 | 3.67 | 3.06 | |
| P4 | 27.84 | 15.90 | 21.87 | 10.00 | 17.00 | 12.50 | 2.78 | 4.31 | 3.34 | |
| CM2.0 | 25.74 | 9.49 | 17.61 | 22.79 | 17.66 | 19.38 | 5.00 | 4.05 | 4.37 | |
| CM2.1 | 25.02 | 13.65 | 19.34 | 18.80 | 15.95 | 16.47 | 4.35 | 4.19 | 4.13 | |
| Clm | 28.50 | 14.74 | 21.62 | 10.00 | 17.00 | 12.50 | 1.29 | 1.18 | 1.21 | |
| Obs | 28.38 | 15.79 | 22.08 | 10.00 | 14.00 | 11.00 | 2.61 | 4.14 | 3.12 | |
| Jeddah | P1 | 29.53 | 18.87 | 24.20 | 12.00 | 9.00 | 10.50 | 2.80 | 2.46 | 2.53 |
| P2 | 30.67 | 19.97 | 25.32 | 9.00 | 7.00 | 8.00 | 2.29 | 2.14 | 2.14 | |
| P3 | 31.13 | 20.48 | 25.80 | 10.00 | 7.00 | 8.50 | 2.32 | 2.16 | 2.18 | |
| P4 | 29.95 | 19.59 | 24.77 | 13.00 | 8.00 | 10.00 | 2.62 | 2.44 | 2.35 | |
| P5 | 28.62 | 16.77 | 22.70 | 9.00 | 15.00 | 8.50 | 2.03 | 2.94 | 2.17 | |
| P6 | 28.11 | 22.13 | 25.12 | 10.00 | 7.00 | 8.00 | 2.17 | 1.75 | 1.85 | |
| CM2.0 | 28.32 | 21.84 | 25.08 | 13.81 | 11.25 | 12.50 | 2.94 | 2.39 | 2.63 | |
| CM2.1 | 25.22 | 19.79 | 22.51 | 13.80 | 12.24 | 11.87 | 2.91 | 2.75 | 2.75 | |
| Clm | 29.62 | 18.30 | 23.96 | 4.16 | 3.04 | 3.07 | 1.11 | 0.71 | 0.87 | |
| Obs | 29.49 | 19.69 | 24.59 | 12.00 | 11.00 | 9.50 | 2.81 | 2.58 | 2.45 | |
| Gizan | P1 | 31.93 | 22.45 | 27.19 | 3.00 | 4.00 | 3.00 | 0.73 | 0.93 | 0.76 |
| P2 | 30.11 | 23.75 | 26.93 | 3.00 | 3.00 | 2.50 | 0.78 | 0.91 | 0.63 | |
| P3 | 30.52 | 24.13 | 27.33 | 3.00 | 4.00 | 2.50 | 0.94 | 0.69 | 0.63 | |
| P4 | 30.54 | 23.38 | 26.96 | 5.00 | 6.00 | 4.00 | 0.98 | 1.39 | 0.95 | |
| P5 | 28.44 | 20.16 | 24.30 | 3.00 | 7.00 | 4.00 | 0.67 | 1.79 | 1.00 | |
| CM2.0 | 25.30 | 9.08 | 17.19 | 10.02 | 10.93 | 9.33 | 2.48 | 2.73 | 2.47 | |
| CM2.1 | 25.18 | 10.32 | 17.75 | 17.98 | 18.09 | 13.72 | 4.20 | 4.60 | 3.76 | |
| Clm | 31.28 | 22.61 | 26.95 | 2.60 | 2.74 | 2.44 | 0.72 | 0.73 | 0.70 | |
| Obs | 30.36 | 23.74 | 27.05 | 3.00 | 6.00 | 4.50 | 0.91 | 1.25 | 0.89 | |
Furthermore, when averaged over all the NWP model-based Ps, the minimum (maximum) absolute bias for Tmax was found to be 1.20 oC (4.75 oC) for Gizan (Jeddah), whereas the corresponding values for the average AOGCM are 0.17 oC (10.94 oC) for Jeddah (Yenbo) during the entire studied 61 day period (not shown). For Tmin, the average Ps as well as the average AOGCMs minimum absolute biases were larger than for Tmax (not shown).
5ConclusionsAfter an overview of the temperature regimes along the west coast of SA, the next-day forecast performance for six commercial weather forecast providers based on the NWP model outputs for surface temperature, is assessed using a simple modified forecast skill comparison metric, for four cities (Wejh, Yenbo, Jeddah, and Gizan) along the west coast of SA, for a period of 61 consecutive days during the months of January, February, and March. The forecast comparison metric was based on a subjective point scoring. Station based climatology is used as a standard of reference. All three temperature variables (Tmax, Tmin and Tmean) are considered separately. Cumulatively, the best performer was provider 4, whereas the worst performer was provider 5, based on a skill score. Linear correlation coefficients and the biases of the forecasted temperatures relative to the observed surface temperatures were also computed, as an objective metric for assessing the surface temperature forecasting performance.
In general, the regional weather forecasting models have a lower bias (< ± 2 °C), relative to observations, as compared to those by the AOGCM, due to better resolved topographic features over the Red Sea coastal land stations. A purpose of this bias comparison presentation is to assess the realism offered by contemporary weather and climate models in forecasting surface temperatures in coastal areas in an arid climate country.
At the same time, this analysis is intended to provide some clues towards the difficulties encountered by the NWP models and AOGCMs to forecast surface temperature during the transitional period (between the DJF and MAM seasons) for the coastal locations in an arid country like SA. The simple methodology used in this comparison may provide some guidance and motivation for the general public, as well.
The authors thank the Presidency of Meteorology and Environment, Jeddah, Saudi Arabia, and Dr. Mansour Almazroui, for providing the datasets for the climatology. The observed dataset used in this study was obtained from the Internet weather source website of the National Oceanic and Atmospheric Administration (NOAA) National Weather Service (NWS) (http://weather.noaa.gov/weather/SA_cc.html). The datasets from the commercial weather forecast providers were obtained from their respective websites. The GFDL based AOGCM datasets were obtained from the following website: http://data1.gfdl.noaa.gov/.