


In progressive particle or layered composites based on a combination of BaTiO3 and Al2O3, serving as e.g. ceramic harvesters, new phases are formed during heat treatment. The dominant one is BaTiAl6O12. This study provides information about the microstructural, mechanical and optical properties of the BaTiAl6O12 ceramics. The evolution of the phases during the solid-state reaction synthesis of the BaTiAl6O12 was monitored. The fully dense samples prepared by spark plasma sintering had indentation Vickers hardness and indentation elastic modulus within ranges of 10.1–13.7GPa and 132.0–187.0GPa, depending on loading force. The three-point bending tests of the BaTiAl6O12 samples resulted in flexural strength of 129.9MPa and fracture toughness of 1.8MPam1/2. The sample showed blue broad-band emission under UV excitation due to the charge-transfer transition of the Ti4+ and defect sites. The BaTiAl6O12 evinced low permittivity (ɛ′)=16 and dielectric loss (tanδ) <0.0003 at a frequency 1kHz.
En los compuestos de partículas o capas progresivas basados en una combinación de BaTiO3 y Al2O3, que sirven, por ejemplo, como capacitadores cerámicos, se forman fases nuevas durante el tratamiento térmico. La dominante es BaTiAl6O12. Este estudio proporciona información sobre las propiedades microestructurales, mecánicas y ópticas del cerámico BaTiAl6O12. Se monitorizó la evolución de las fases durante la síntesis por reacción en estado sólido de BaTiAl6O12. Las muestras totalmente densas preparadas mediante spark plasma sintering exhibieron una dureza Vickers por indentación y un módulo elástico por indentación entre 10,1-13,7GPa y 132,0-187,0GPa, respectivamente, dependiendo de la fuerza de carga aplicada. Los ensayos de flexión en tres puntos de las muestras de BaTiAl6O12 dieron como resultado una resistencia a la flexión de 129,9MPa y una tenacidad a la fractura de 1,8MPam1/2. La muestra presentó una emisión azul de banda ancha bajo excitación UV debido a la transición de transferencia de carga del Ti4+ y sitios defectuosos. El BaTiAl6O12 mostró una baja permitividad (ɛ′)=16 y una pérdida dieléctrica (tanδ) <0,0003 a una frecuencia de 1kHz.
Barium titanate (BaTiO3) is one of the most important lead-free polycrystalline ceramic materials with attractive dielectric, ferroelectric and piezoelectric properties. It has found various applications in semiconductors, ultrasonic transducers, piezoelectric devices, pyroelectric detectors, etc. [1,2]. However, barium titanate shows relatively low mechanical characteristics compared with other ceramics. Therefore, the scientific efforts concentrate on reinforcing the barium titanate's microstructure with a mechanically hard phase to improve grain size, strength, hardness and fracture toughness. A typical example of such a hard phase is alumina (Al2O3).
From the microstructural point of view, the reinforcing alumina phase can be located in barium titanate as particles (grains) or in the form of layers. The particle composites are studied mainly in terms of improved hardness, Young's modulus, and gradually decreasing mean grain size with increasing content of alumina at acceptable piezoelectric properties [3–6]. On the other hand, the composites containing individual layers of barium titanate and alumina provide interesting results about the development of hardness and Young's modulus through the interface between layers, internal stresses, and crack propagation aiming at the final application as ceramic harvesters [7–9].
Although a few articles do not report the creation of new phases during the sintering process when barium titanate and alumina are mixed together [4,10,11], the majority of literary sources point to ongoing reactions to form new intermediate phases in particle composites [3,5,6,12–15] as well as reaction zones in layered composites [7–9]. Depending on the concentration of alumina, chosen fabrication technique, and the sintering conditions (temperature, heating rate, dwell time, pressure, etc.), the most frequently reported phases are BaAl2O4, BaAl12O20, BaAl13.2O20.8, BaTi2Al3O10, Ba4Ti10Al2O27, and dominant BaTiAl6O12[3,5,6,8,9,12–15]. Unfortunately, very little information is known about these phases, although they certainly have significant positive or negative effects on the final properties of the prepared composites.
For example, considering BaTiAl6O12 phase, Guha et al. [16] reported in 1976 petrographic and X-ray examinations of a sintered mixture containing stoichiometric composition BaO:TiO2:3Al2O3 showing only one phase of BaTiAl6O12 stable at the solidus temperatures having tetragonal symmetry and densities of 3.84g/cm3 (measured) and 3.88g/cm3 (calculated). The authors also claimed that BaTiAl6O12 can be prepared by solid-state reaction from appropriate proportions of BaTiO3 and Al2O3. Four years later, Guha [17] introduced a ternary diagram in the system BaO–TiO2–Al2O3 at 1200°C visualising the BaTiAl6O12 phase. Lately, the works of Cadée and Ijdo [18] and Fallon et al. [19] specified that BaTiAl6O12 was found to have orthorhombic symmetry instead of the reported tetragonal symmetry. Based on our best knowledge, we found only a recent work by de Pablos-Martin et al. [20] where the fluorescence of BaTiAl6O12, serving as a bonding layer between two sapphire substrates, was presented. Therefore, fundamental information about various properties of BaTiAl6O12 is still missing in the literature.
This study deals with BaTiAl6O12 ceramics as an important product arising in composites based on BaTiO3/Al2O3. The properties of both Al2O3 and BaTiO3 are thoroughly described in the literature, but information on the properties of BaTiAl6O12 is missing. Therefore, the effect of BaTiAl6O12 on the final properties of such composites is unclear. This paper aims to examine in detail the microstructural, mechanical, electrical and optical properties of BaTiAl6O12 and discuss them in relation to the materials from which it was synthesised. This will enable better understanding of characteristics of composite materials containing this phase.
ExperimentalPreparation routeBaTiAl6O12 was prepared by mixing tetragonal barium titanate (Nanografi, Turkey) with alumina (Taimei, Japan) in an appropriate molar ratio to get the target stoichiometry after thermal treatment. The powder was milled in the planetary ball mill (Netzsch, Germany) for 30min using deionised water as a solvent and 5mm tetragonal zirconia balls as milling elements. The milled powder was dried for 24h at 50°C and then milled again in agate mortar.
The powder was uniaxially pressed in 30mm die at 50MPa. Then the pellet was cold isostatically pressed at 300MPa followed by annealing at 800°C to obtain a green body for high-temperature dilatometry. Spark plasma sintering (SPS, Dr. Sinter 615, Fuji, Japan) was used to consolidate the powder into a disc shape using a graphite die with a 30mm diameter. The solid-state reaction took place at a sintering temperature of 1450°C with 5min dwell time using heating rate of 100°C/min, cooling rate of 50°C/min and applied pressure of 50MPa.
AnalysesHigh-temperature dilatometry (L70/1700, Linseis, Germany) was applied to identify temperature intervals of phase changes during sintering and the coefficient of thermal expansion (CTE). The thermal regimes were set at 1450°C with 60min dwell time (heating and cooling rates of 10°C/min) and 500°C without dwell (heating and cooling rates of 1°C/min), respectively. The density of the sample was measured using the Archimedes method (ISO 18754). The phase composition of the sample was analysed using the SmartLab 3kW X-ray diffractometer (XRD, Rigaku, Japan). A piece from the sintered disc was cut, mounted onto the epoxy resin, ground, and polished on progressively finer diamond abrasives down to 1μm. The polished surface was used for microstructural analysis using an SEM (Lyra 3 XMU, Tescan, Czech Republic) equipped with an EDS Ultimmax detector (Oxford Instruments, UK) and an EBSD Symmetry camera (Oxford Instruments, UK). The Aztec version 6.1 and Aztec Crystal version 3.1 (Oxford Instruments, UK) were used to analyse chemical composition and crystallography. A set of EBSD maps where the grain boundaries detection limit was set to an angle of 15° was used to obtain grain size distribution. The weighed area grain size frequency histogram was constructed based on more than 1750 grains. Mean grain size based on equivalent diameter and grain aspect ratio from major and minor fitted diameter was determined. Correction to the grain size to 3D was not applied.
Mechanical testingTo acquire indentation elastic modulus EIT and Vickers hardness HV, the indentation techniques were used. Instrumented hardness was measured using a mechanical testing machine equipped with an indentation unit (Z2.5/ZHU0.2, Zwick/Roell, Germany) at 0.98–49.03N loading. As multiple indentations can be performed on a single sample, more than ten valid measurements for statistical analysis were acquired for each load applied.
The Young's modulus EIET, shear modulus GIET, and consequently calculated Poisson's ratio were determined on the sintered disc of 30mm in diameter and thickness of 1.6mm by an impulse excitation technique using RFDA Professional (IMCE, Belgium) equipment at room temperature and air atmosphere. Elastic characteristics were determined from flexural and torsional resonant frequencies, disk geometry and density following the ASTM E1876 (ASTM C1259) standard [21,22].
All test specimens necessary for flexural strength and fracture toughness determination were cut from the sintered disk using a precise diamond saw Brillant 220 (ATM GmbH, Germany) and ground down to 10μm diamond abrasive to eliminate cutting defects for the fracture toughness and down to ¼μm for bending bars. The bending bars were also chamfered at the tensile side to eliminate corner stress concentration. The chevron notch was machined into the bars using a 0.15-mm-thick diamond cutting wheel.
Flexural strength was determined on test specimens loaded in the three-point bending configuration with a span of 8mm. The nominal test specimen dimensions were predetermined by the disk thickness and were 2mm×2.5mm×10mm. The flexural strength was determined from the fracture force when loaded using a universal electromechanical testing system (Instron 8862, UK) equipped with a load cell (HBM, Germany) of 500N capacity. Similarly, using the same testing machine, the fracture toughness was determined on notched test specimens with a cross-section of 2.5mm×2mm in size in a three-point bending configuration with a span of 10mm. The chevron-notched beam method (CNB; ČSN EN 14425-3 for ceramics) was used to determine fracture toughness values KIc,cnb calculated from the specimen's geometry, maximum of applied force and compliance function calculated via the slice method [23]. The details about this method and a comparison with the indentation can be found elsewhere [24,25].
Optical measurementsThe photoluminescence excitation (PLE) and emission (PL) spectra were recorded at room temperature using a Fluorolog FL3-21 spectrometer (Horiba Jobin Yvon, France) in the backscattering configuration (front-face). The cw Xe-lamp (450W) was used as an excitation source, and the luminescence signal was detected with a PPD-900 detector. The appropriate cut-off filters were used to eliminate the higher-order grating reflection artefacts in the PL spectra. The emission spectra were corrected for the spectrometer optics and the excitation lamp response. The sample surface was examined by X-ray photoelectron spectroscopy (XPS) using Nexsa G2 XPS Surface Analysis System (Thermo Scientific).
Electrical measurementsDielectric properties were measured by Alpha-A High Performance Modular Measurement System (Novocontrol, Montabaur, Germany) in ZGS Active Sample Cell. The sample for this measurement was in the shape of a disc with a diameter of 12mm and a thickness of 1mm. A given amount of silver paste was applied to the sample. Then dielectric properties were measured at room temperature in a wide frequency range from 10mHz to 1MHz.
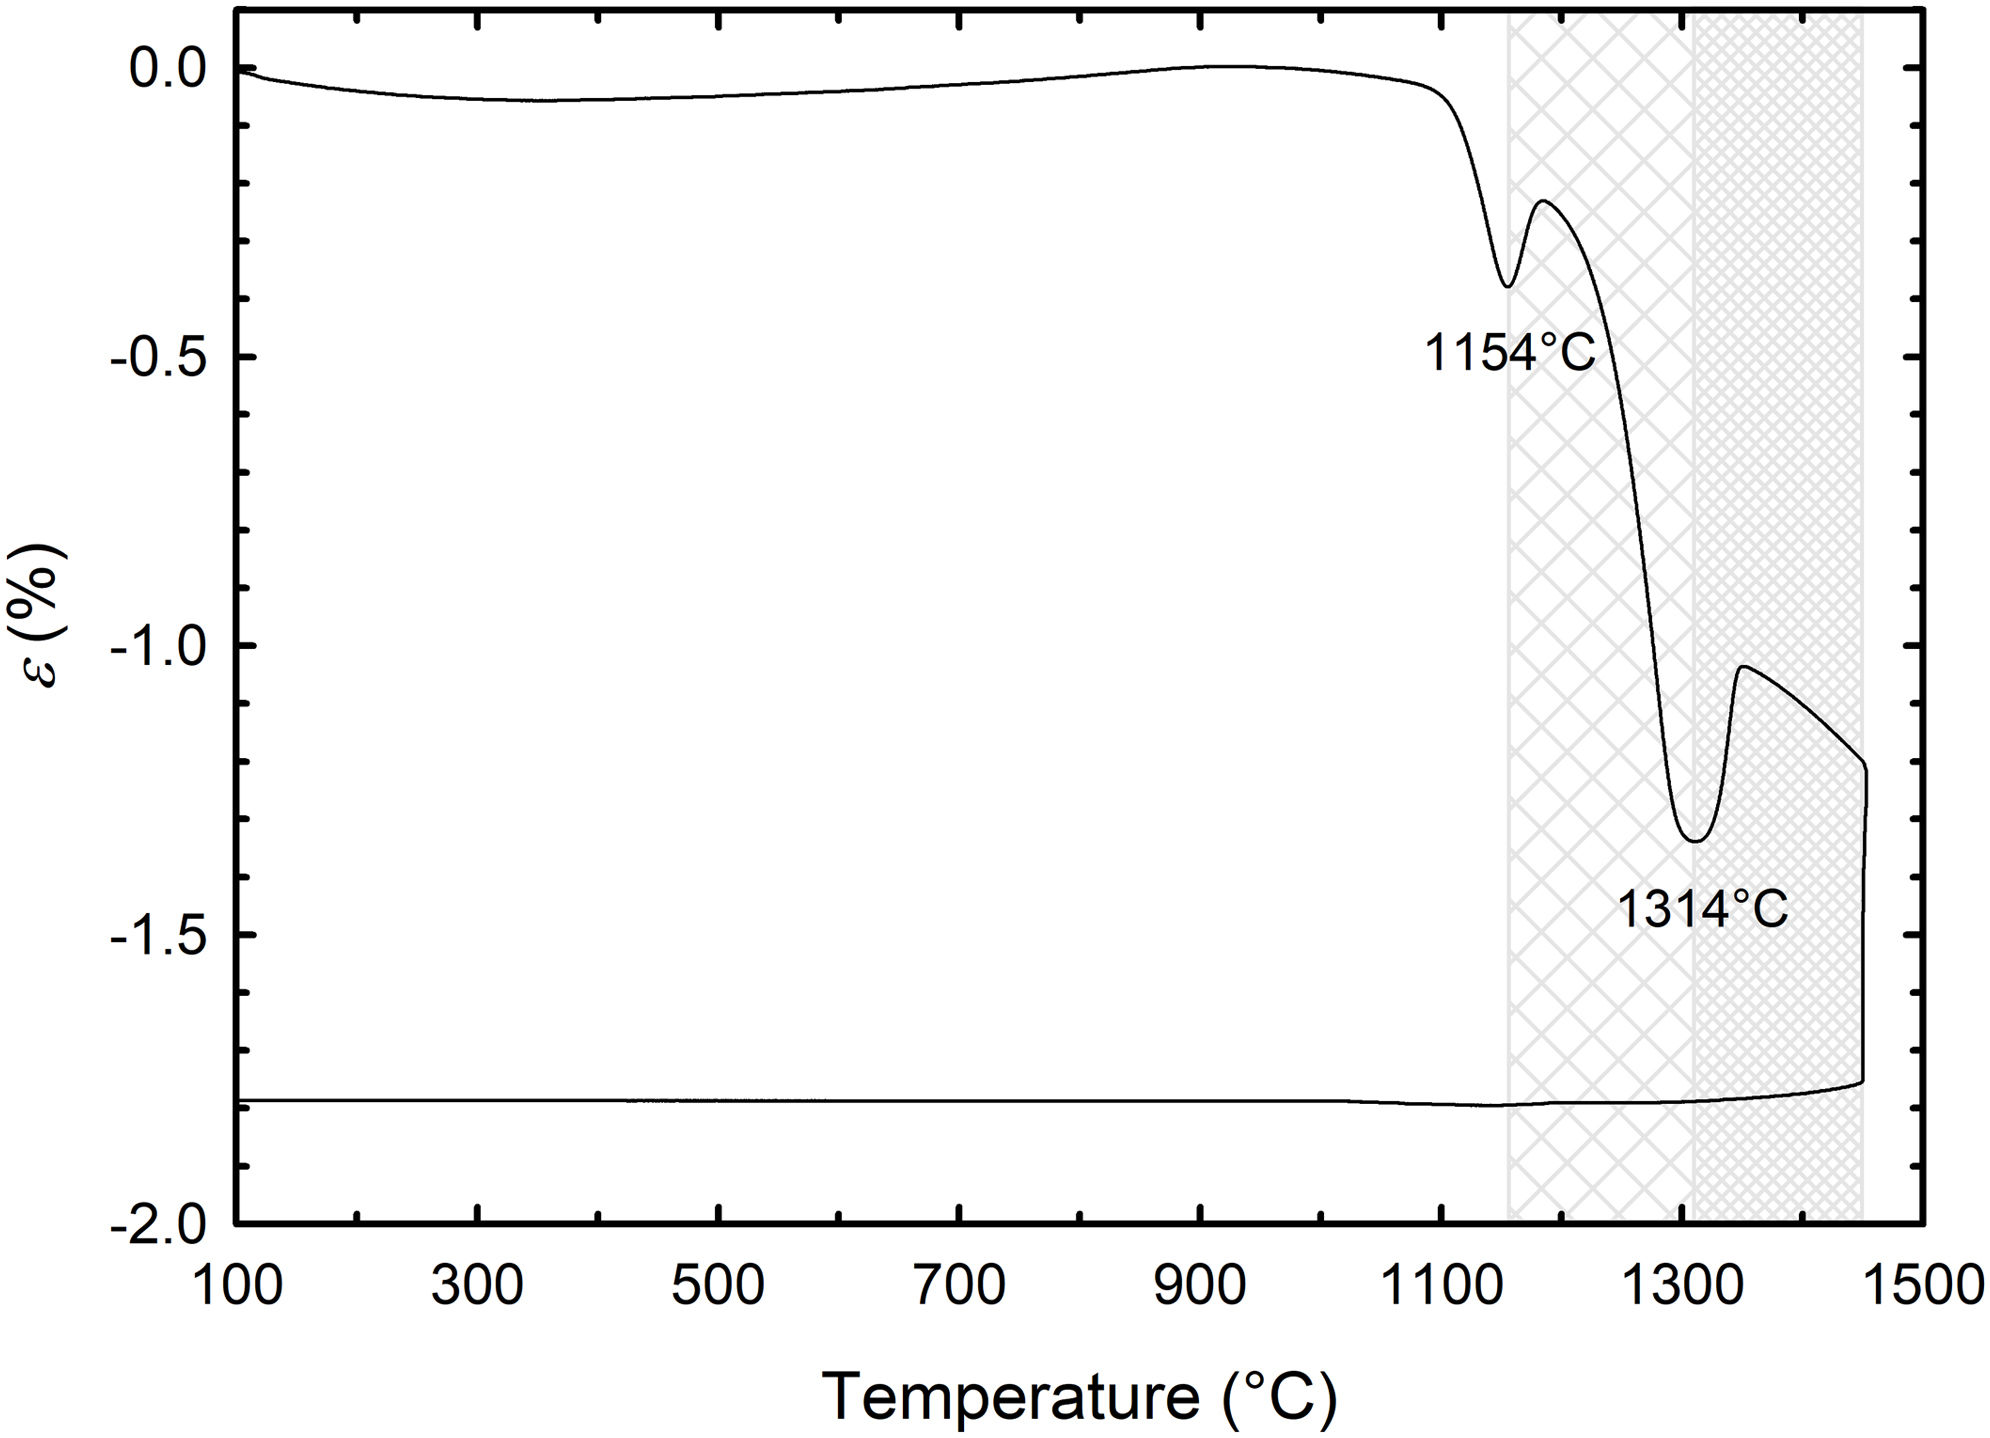
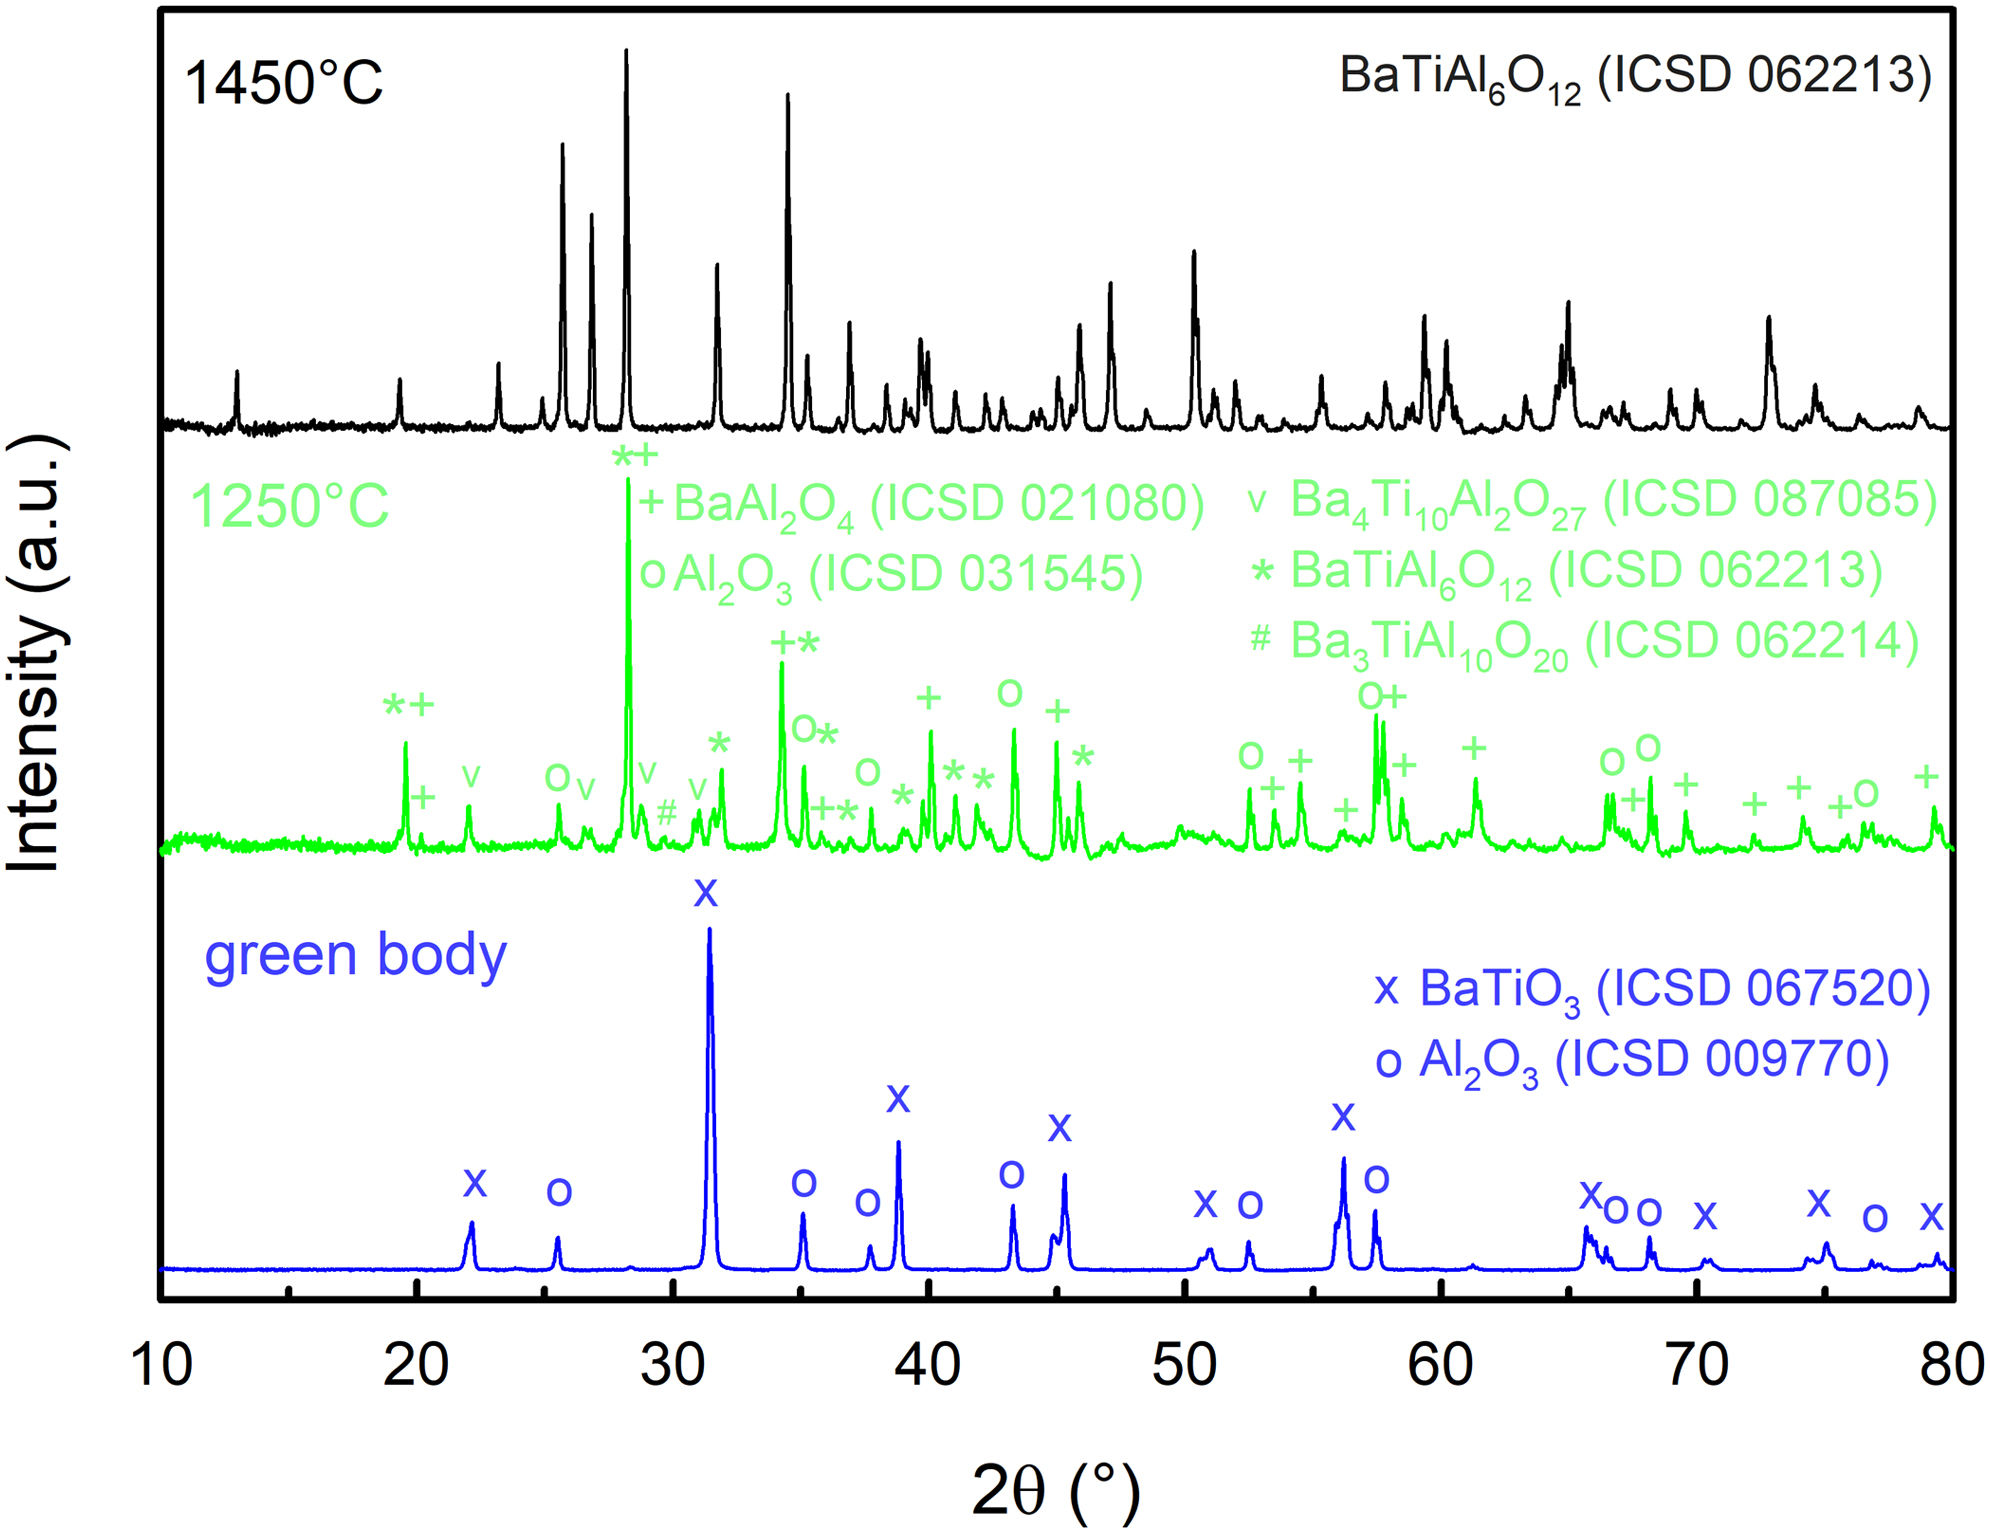
Results and discussionDilatometric measurements and XRD analysisFig. 1 shows the dilatometric record of the in situ conventionally sintered green body composed of barium titanate and alumina in the dilatometer. The dilatometric curve reveals that the compacted mixture is stable up to 1100°C having no significant shrinkage. However, in the temperature range between 1100°C and 1450°C, sintering shrinkage occurs accompanied by two significant events associated with phase changes as a result of the solid-state reaction. The phase transformations begin at 1154°C and 1314°C, respectively. To explore phase evolution during sintering, three samples were analysed using XRD. The first one was the green body, the second one was sintered at 1250°C (in the region after the first phase transformation occurrence, see Fig. 1) and the third one was sintered at 1450°C (in the region after the second phase transformation). The XRD analyses, given in Fig. 2, show the transformation of two distinct phases (BaTiO3 and Al2O3) into BaAl2O4, BaTiAl6O12, Ba4Ti10Al2O27, Ba3TiAl10O20 and Al2O3 at 1250°C. The major phase was unreacted alumina (48wt.%), followed by BaAl2O4 (27wt.%) and other minor phases. Higher temperature (1450°C) resulted in the transformation of all these phases to a single BaTiAl6O12 phase.


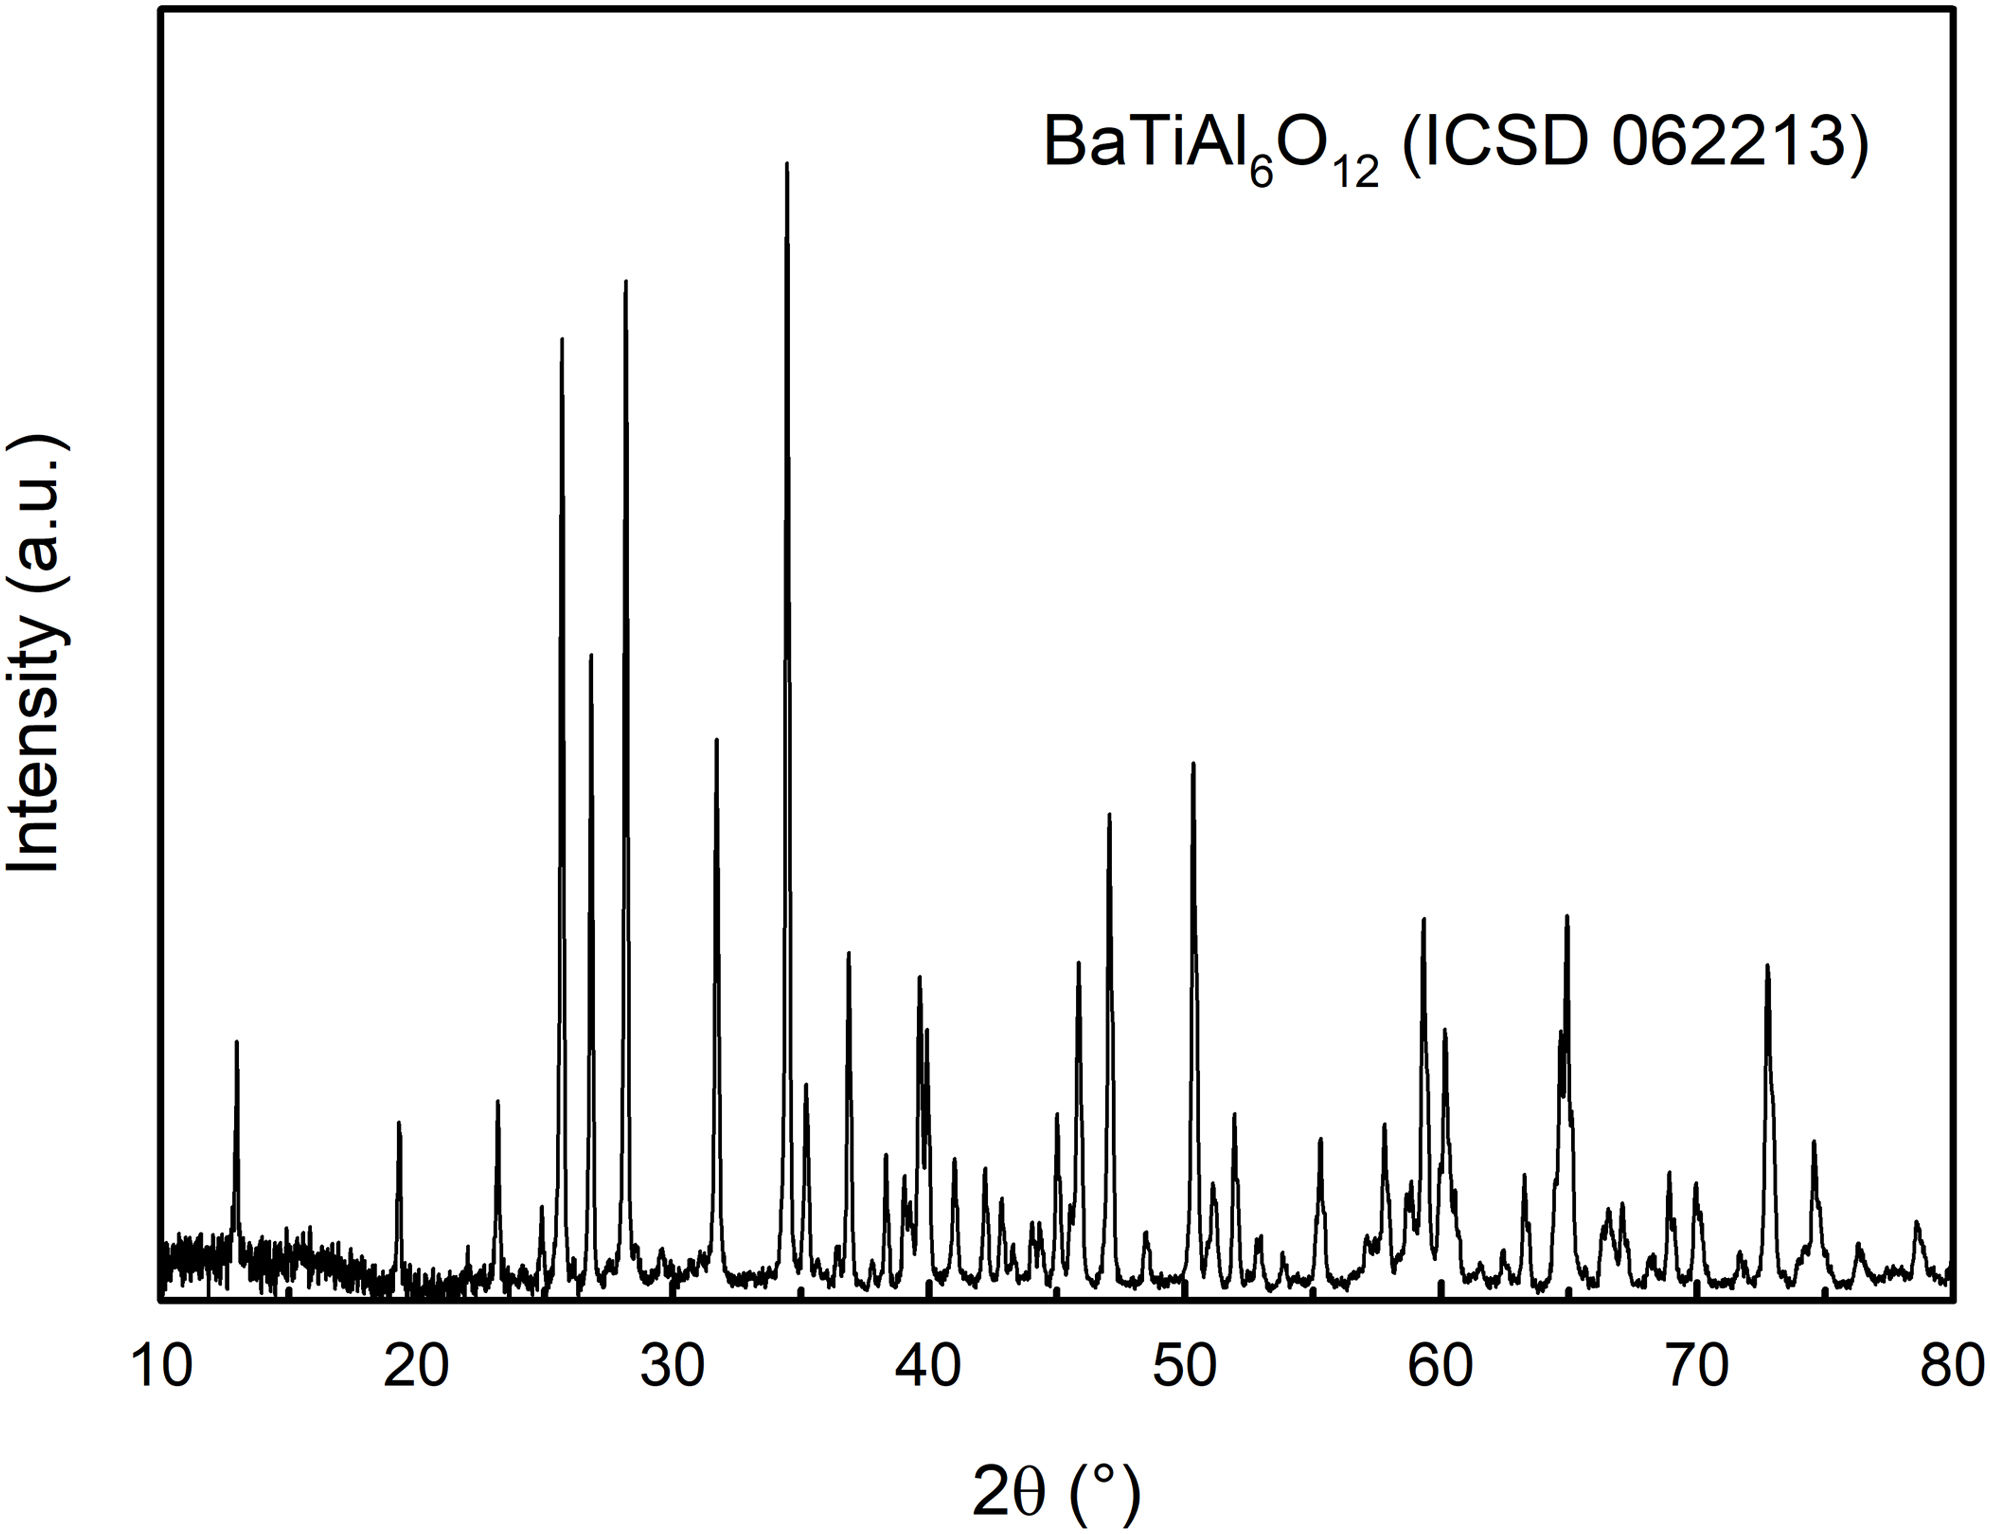
However, Fig. 1 also shows quite a small sintering shrinkage of ∼1.8%, although the relative density of the green body was moderately high (ρg.b.=59.6%), indicating a low final density of the conventionally pressure-less sintered sample. It was confirmed by density measurement, reaching a value of 77.2%. From the practical point of view, we decided to use non-conventional sintering (SPS) at the same temperature with applied pressure to get a fully dense sample. The spark plasma sintered sample reached a relative density of 99.5%. The XRD analysis of the SPS sample is given in Fig. 3. The X-ray diffraction pattern comprises peaks of the BaTiAl6O12 phase.

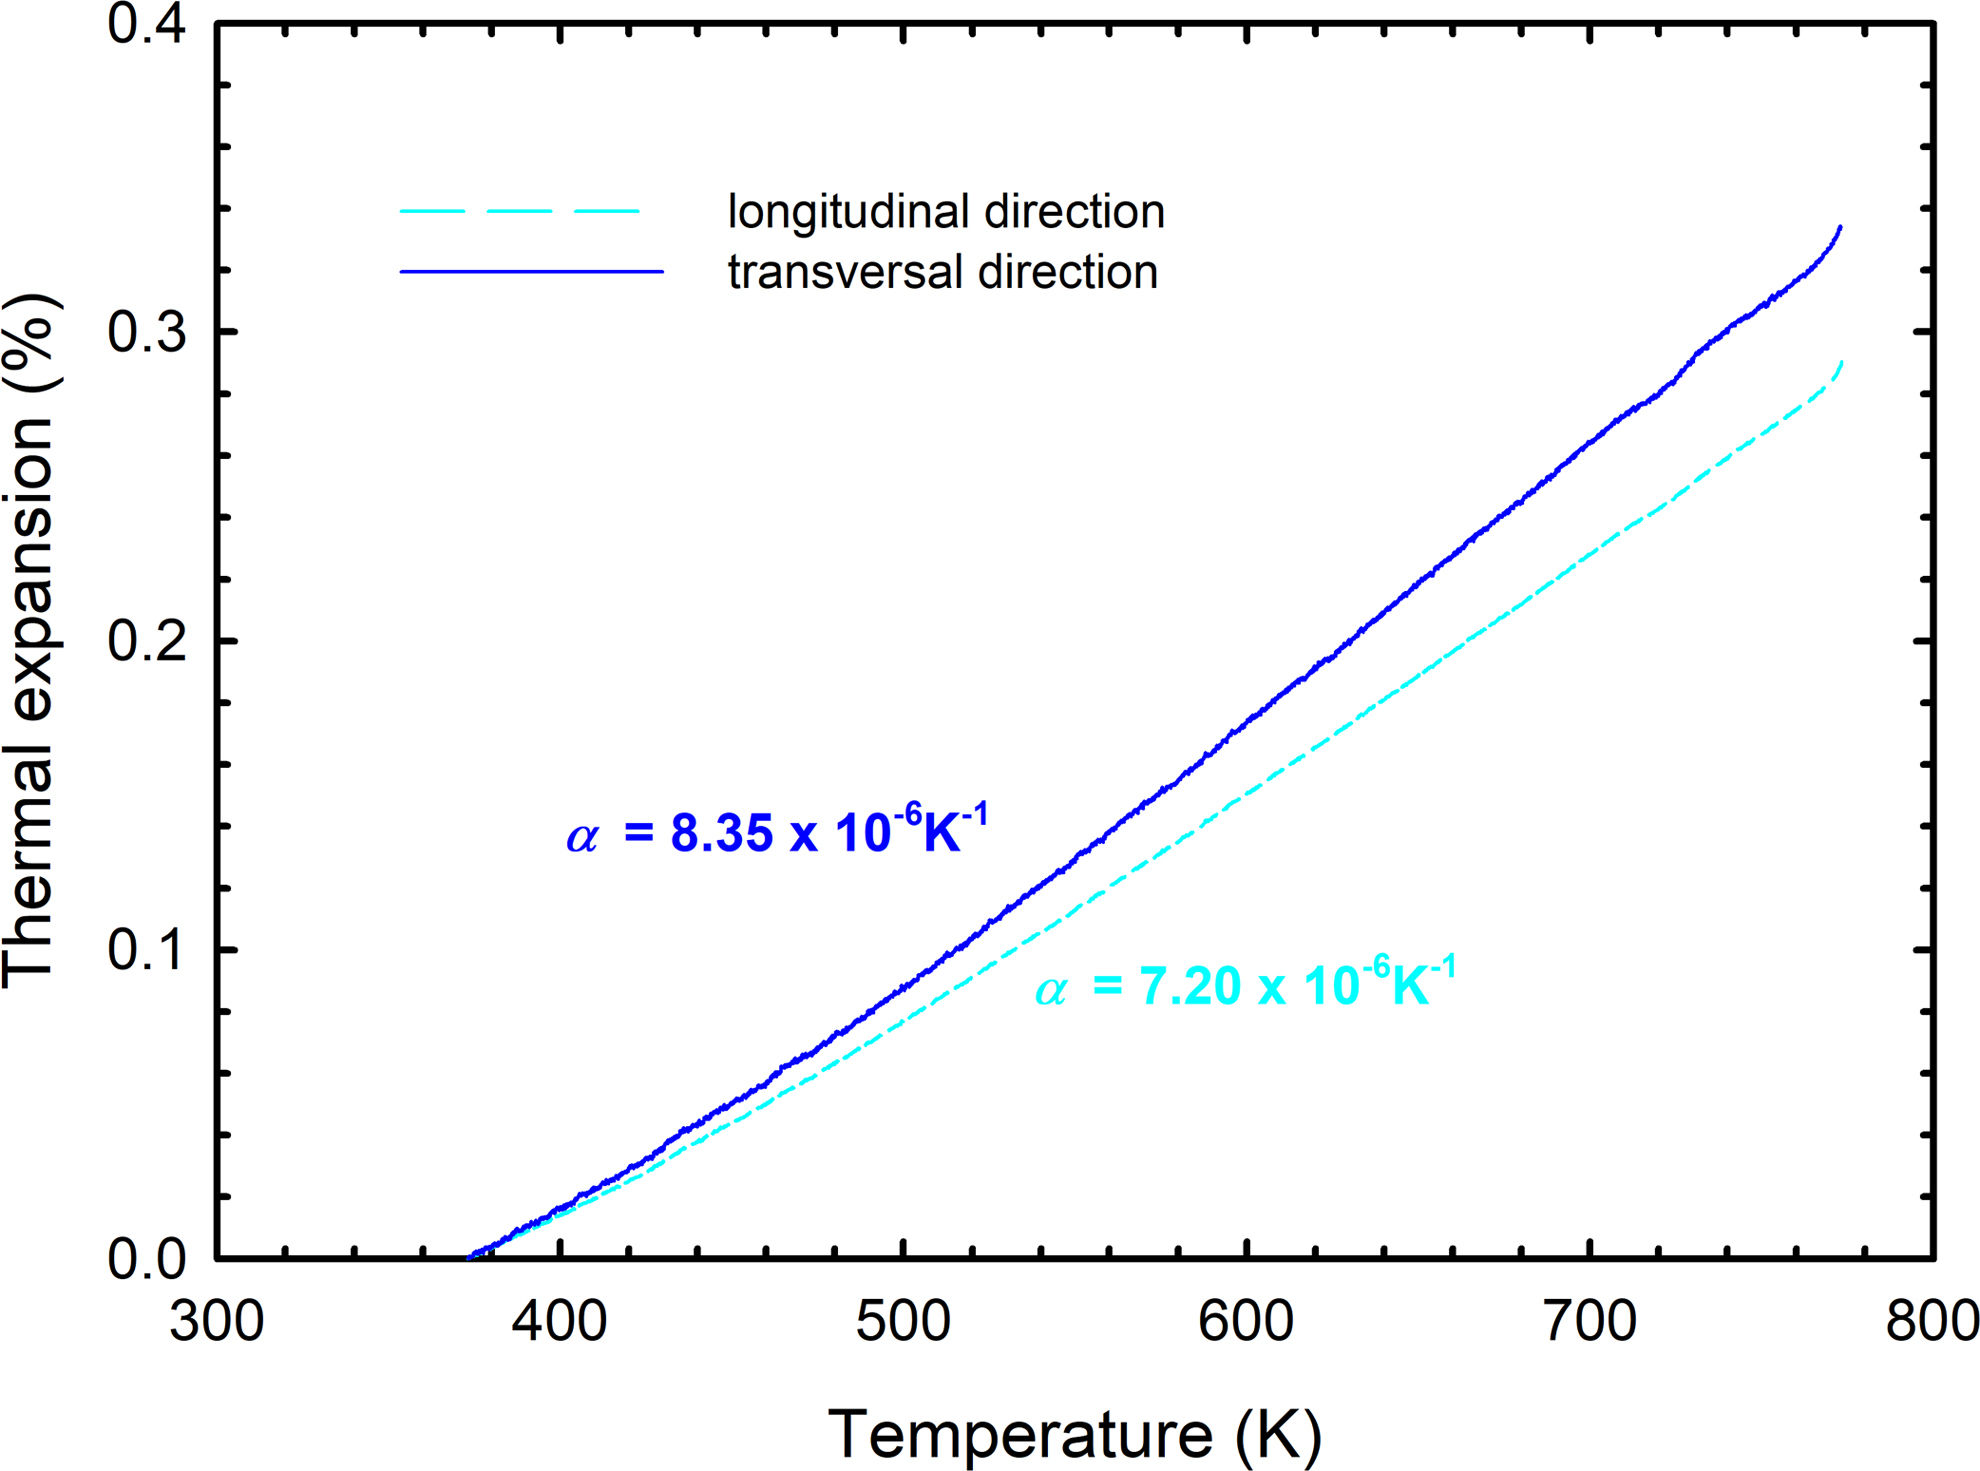
Fig. 4 shows the cooling parts of dilatometric curves of sintered SPS samples for the determination of CTE. The CTE was calculated for the sample's transversal (plane of the disc base) and longitudinal (direction of applied pressure during SPS) orientation. The calculated values of CTEs in the temperature range between 100°C and 500°C were 8.35×10⁻⁶K−1 and 7.20×10⁻⁶K−1 for transversal and longitudinal orientation, respectively. The calculated CTEs of the BaTiAl6O12 phase are closer to the CTE of alumina (8×10⁻⁶K−1[26]) rather than of barium titanate (11×10−6K−1[8,27]). Calculated CTE values and different slopes of dilatometric curves may seem to indicate anisotropy of the coefficient of thermal expansion of BaTiAl6O12. The anisotropy was found not in the grain orientation but in the aspect ratio only (discussed further). However, the generally known variance of CTE values must also be considered.
Microstructure
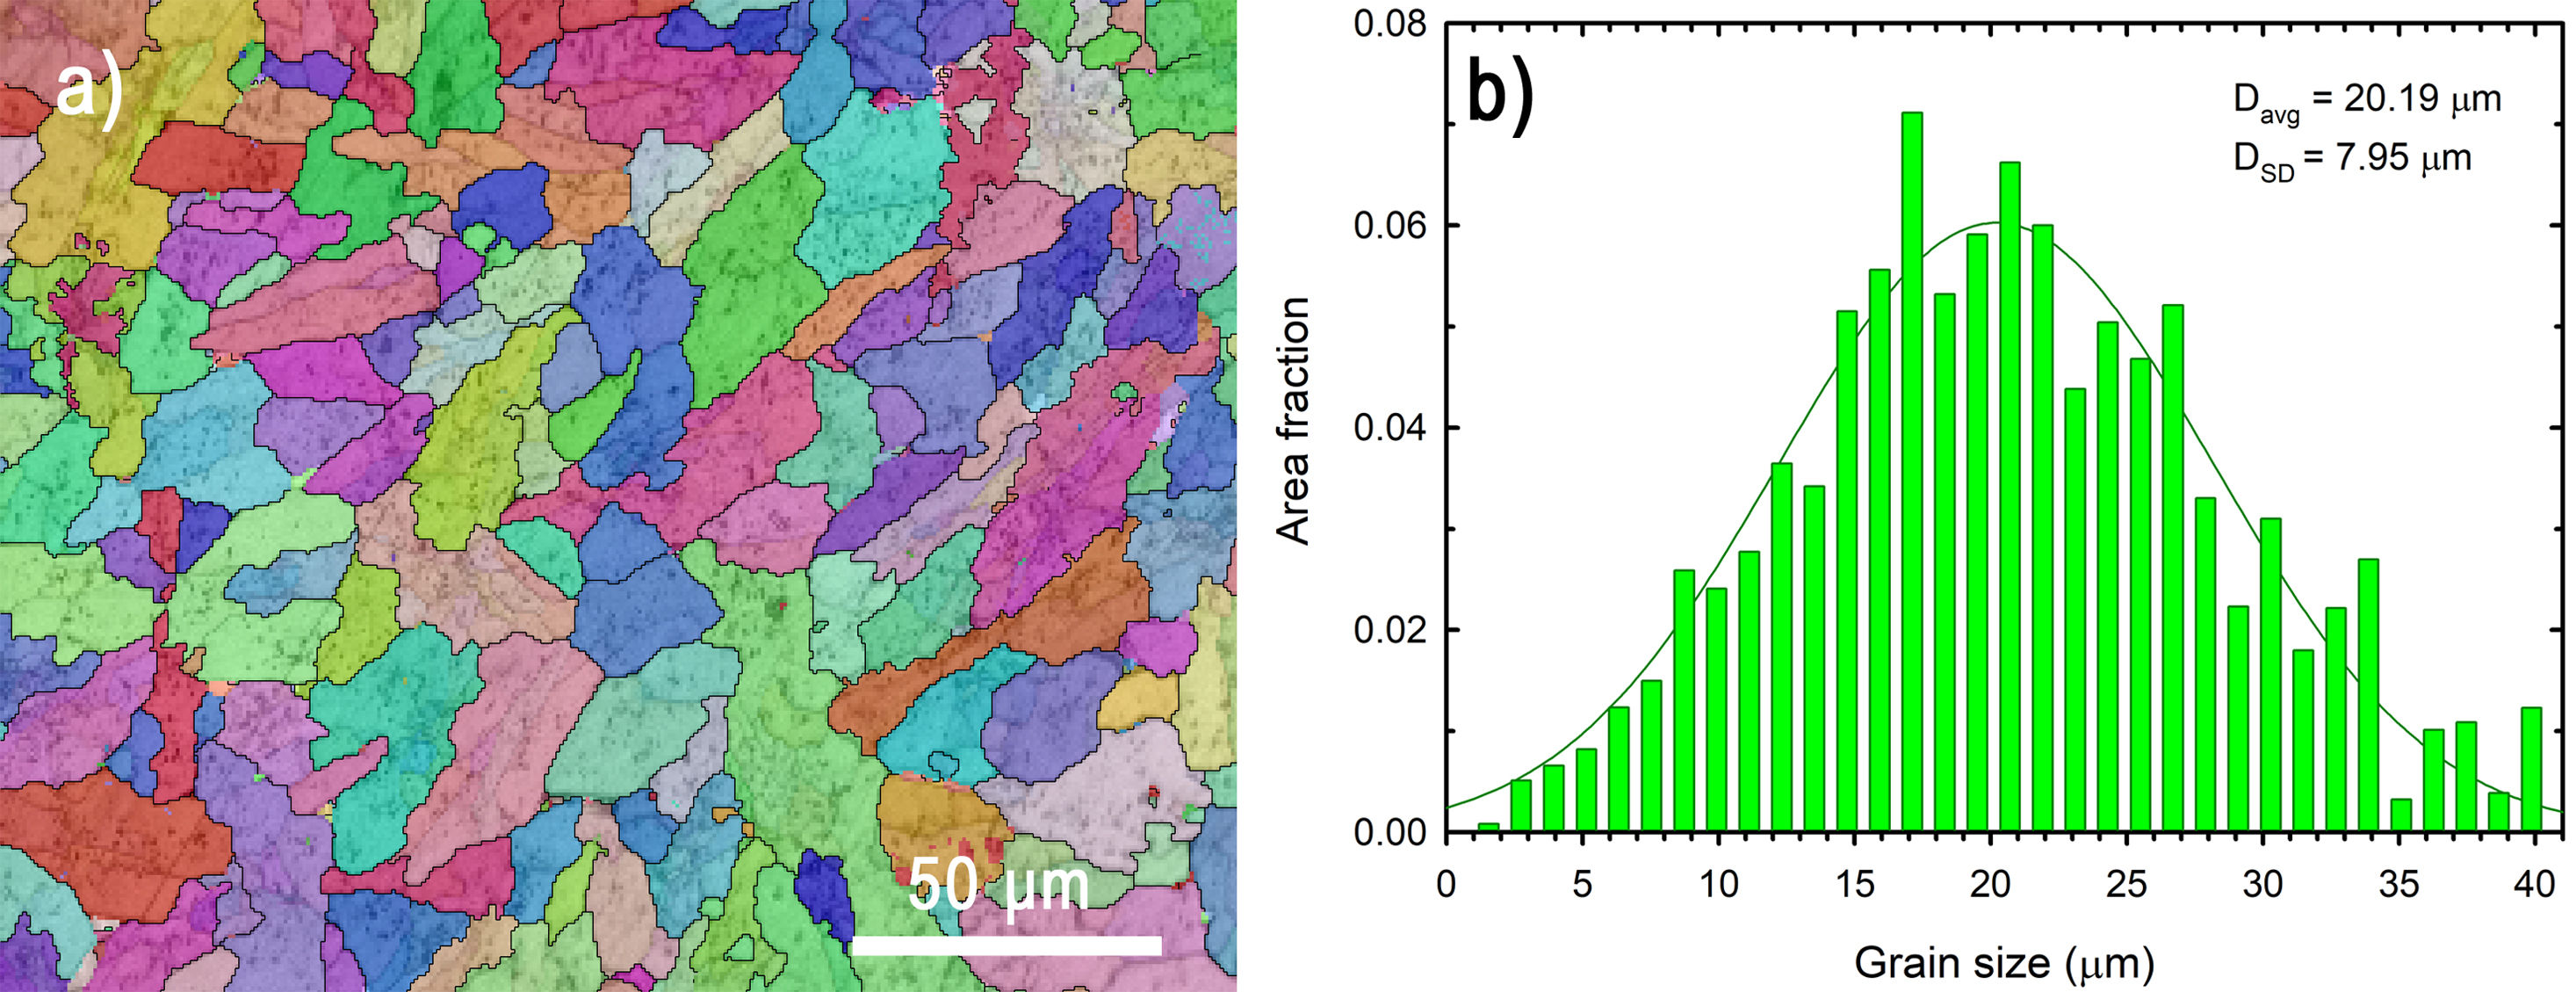
The microstructure visualised using the EBSD detector in SEM is shown in Fig. 5a. The image shows rather elongated grains with different crystallographic orientations of the orthorhombic lattice. The grain growth direction preference may have been caused by the applied pressure during the sintering process. The aspect ratio of the fitted major and minor ellipse diameter is equal to 2.1. Grain orientation anisotropy was not detected based on the EBSD data. The area-weighted grain size distribution is plotted in Fig. 5b. The mean grain size of the SPS sample determined using the distribution function was 20.19μm.
 EBSD map and (b) grain size distribution of sample sintered using SPS.")
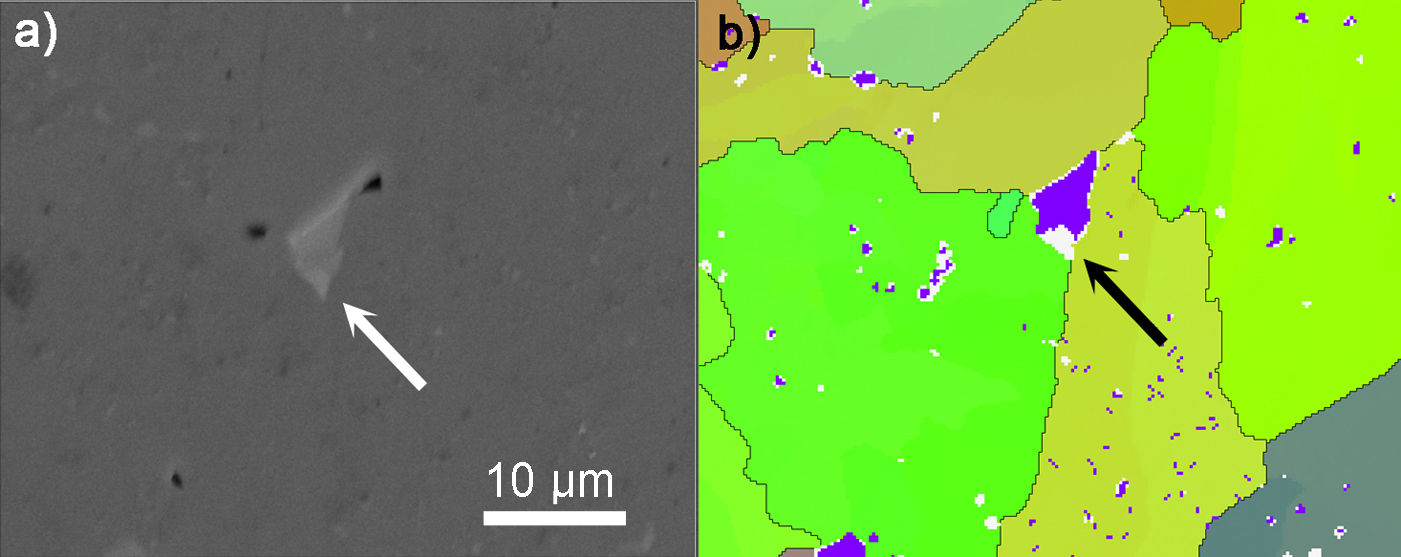
The EBDS analysis also revealed the existence of the secondary phase. This phase can be seen due to phase contrast in the SEM image in Fig. 6a and, at the same time, also on the corresponding EBDS map. The phase (purple area in Fig. 6b) was identified as monoclinic Ba3TiAl10O20 localised mainly in the triple points of the BaTiAl6O12 phase. It was represented in the amount of 2.5% of all the phases analysed by EBDS. Therefore, it was not detected by XRD due to the resolution limit of the instrument. However, the bright grain in Fig. 6a contains an even brighter area marked by the white arrow in the SEM image and the black arrow in the EBDS map as not identified area. It is believed that they are the transition reaction products of incomplete transformation on BaTiAl6O12. Although the minor phases were analysed, we assume that their small amounts do not substantially affect the final properties of the BaTiAl6O12.
Mechanical properties and corresponding EBSD map (b) of sample sintered using SPS.")
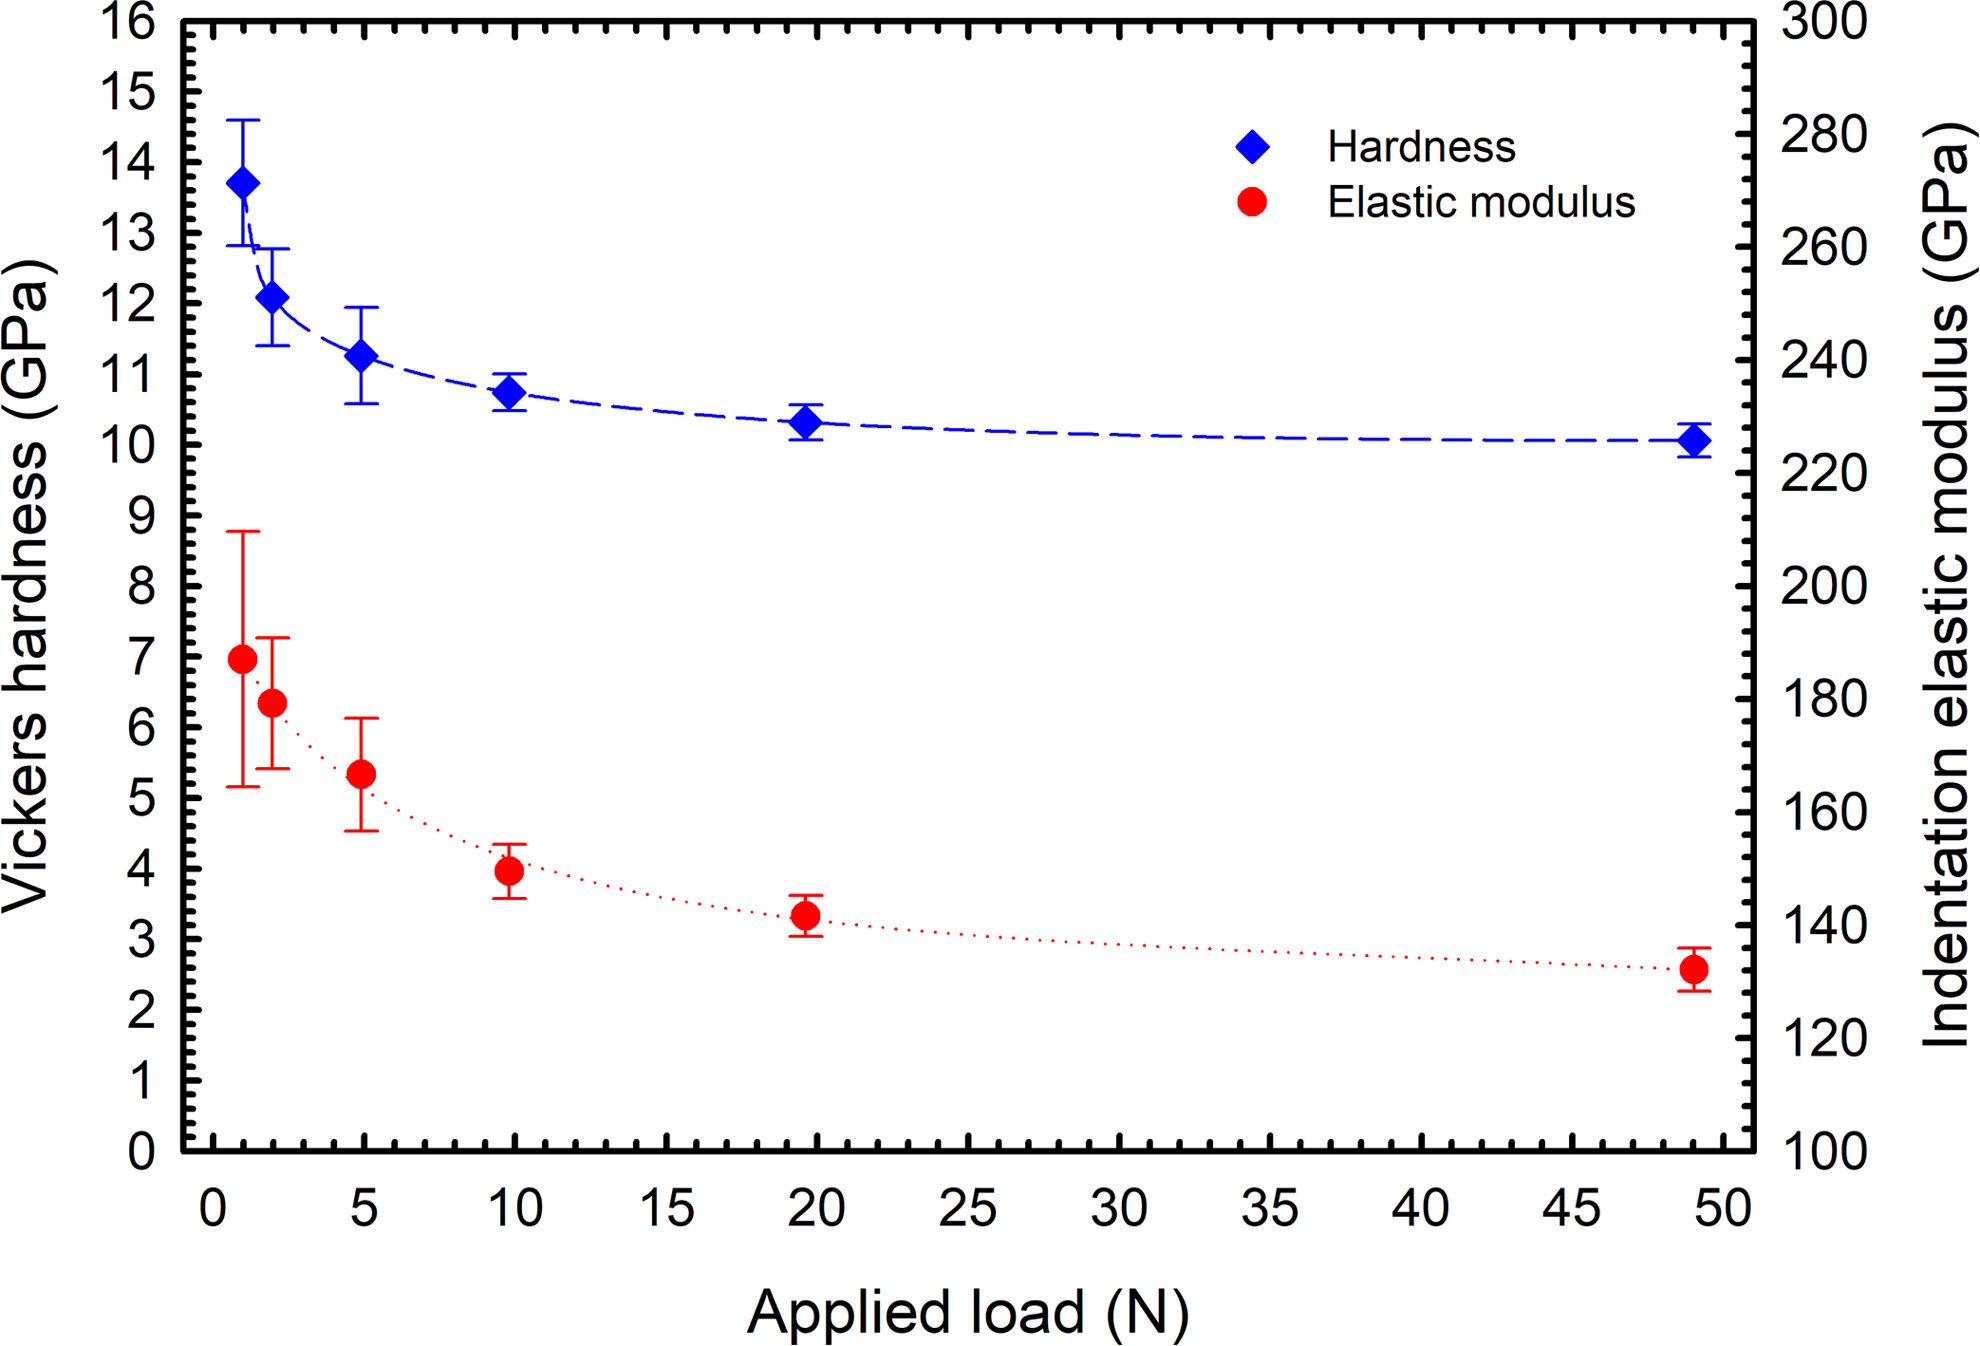
The indentation at various loading levels was conducted to obtain a set of data revealing information about the size effect of the BaTiAl6O12. The dependence is shown in Fig. 7 for both the Vickers hardness calculated from measured indentation depth and calculated indentation elastic modulus determined from the unloading part of loading curves. Both dependencies exhibit typical shapes where approximately for loads above 10N a plateau can be identified and the hardness of the BaTiAl6O12 can be estimated at the level of 10GPa. The indentation elastic modulus ranked between 187GPa for HV0.1 and 132GPa for HV5. The load of HV5 (49.05N) and above led to the formation of significantly large cracks but the value of hardness could not be affected by this phenomenon known for brittle materials [28].

The elastic properties obtained by the impulse excitation technique showed slightly higher values of Young's modulus than the average in indentation. The calculated value from resonance frequencies was 179.4±0.08GPa which corresponds rather with the indentation elastic modulus obtained at lower loads applied. This finding is in good correlation with the fact that EIET generally provides higher and more precious values than methods based on mechanical deformation and is rather comparable with nanoindentation [29]. The EIET also allows the determination of shear modulus and the calculation of Poisson's ratio to be 69.5±0.05GPa and 0.29±0.001, respectively. Compared with the BaTiO3, elastic properties are slightly higher but deeply below typical values for alumina [30,31].
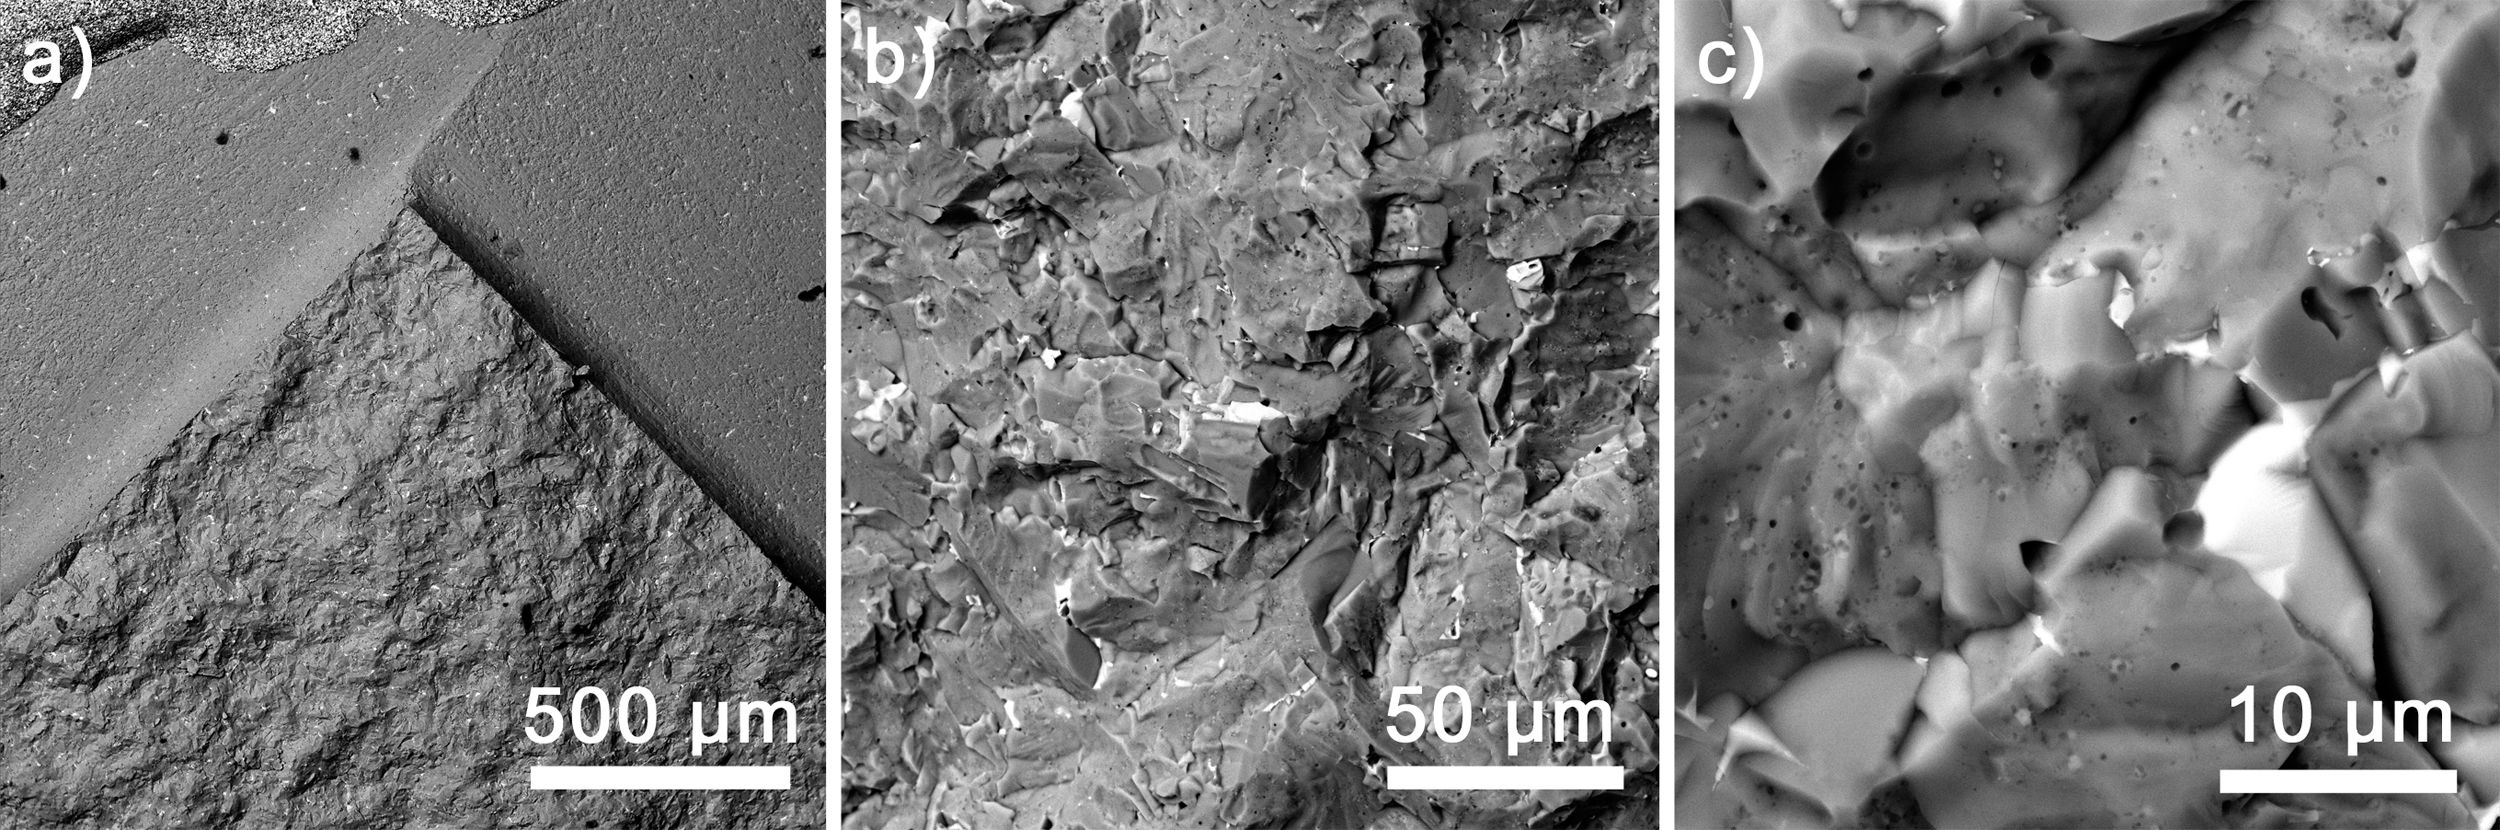
The flexural strength determined by three-point bending was 129.9±4.57MPa, which is approximately 30% higher than typical maximal values for BaTiO3 laying on the level of 100MPa [30]. The fracture toughness of the BaTiO3 is mostly determined by the indentation technique; however, some works also use standard approaches, resulting in the values oscillating around 1MPam1/2[29,32]. To compare with the BaTiAl6O12, the measured value was 1.8±0.15MPam1/2, i.e., 80% higher; however, not reaching the typical value 3.6MPam1/2 for alumina [33]. Generally, it can be stated that BaTiAl6O12 exhibits overall better mechanical properties than BaTiO3; therefore, it will be beneficial when formed at the interfaces with Al2O3. The typical fracture surface is presented in Fig. 8, showing transgranular fracture mode on the backscattered electron mode of SEM images. The observed transgranular fracture mode indicates a strong boundary strength of adjacent grains [34]. The detailed view (see Fig. 8c) shows that the secondary phase (white grain of Ba3TiAl10O20) did not change the overall fracture morphology.
Optical properties
The crystal structure of BaTiAl6O12, reported by Fallon et al. [19], consists of two types of octahedra with mixed Ti and Al occupancy and tetrahedra (AlO4) forming a three-dimensional framework with tunnels containing barium ions. From these constituents, only the Ti-oxygen polyhedron can absorb ultraviolet light due to charge-transfer transitions as known for a large number of hosts [35,36]. The tetrahedral titanate group (TiO4) absorbs only at wavelengths shorter than 250nm [36], while the octahedral titanate groups (TiO6) absorbs at longer wavelengths. Because Ti occupies only octahedral sites in BaTiAl6O12, absorption at longer wavelengths than 250nm is expected.
Since various titanium oxidation states (mainly Ti4+/Ti3+) in oxide hosts may contribute to the luminescence, the sample surface was examined by XPS (figure not shown). The two prominent Ti 2p peaks originating from Ti 2p1/2 at 464.6eV and 2p3/2 at 458.6eV were observed in the XPS spectrum corresponding to the Ti4+-ion profile. This suggests that almost no or only negligible reduction of Ti4+ to Ti3+ occurs, and the Ti ions maintain the stable valence state of 4+.
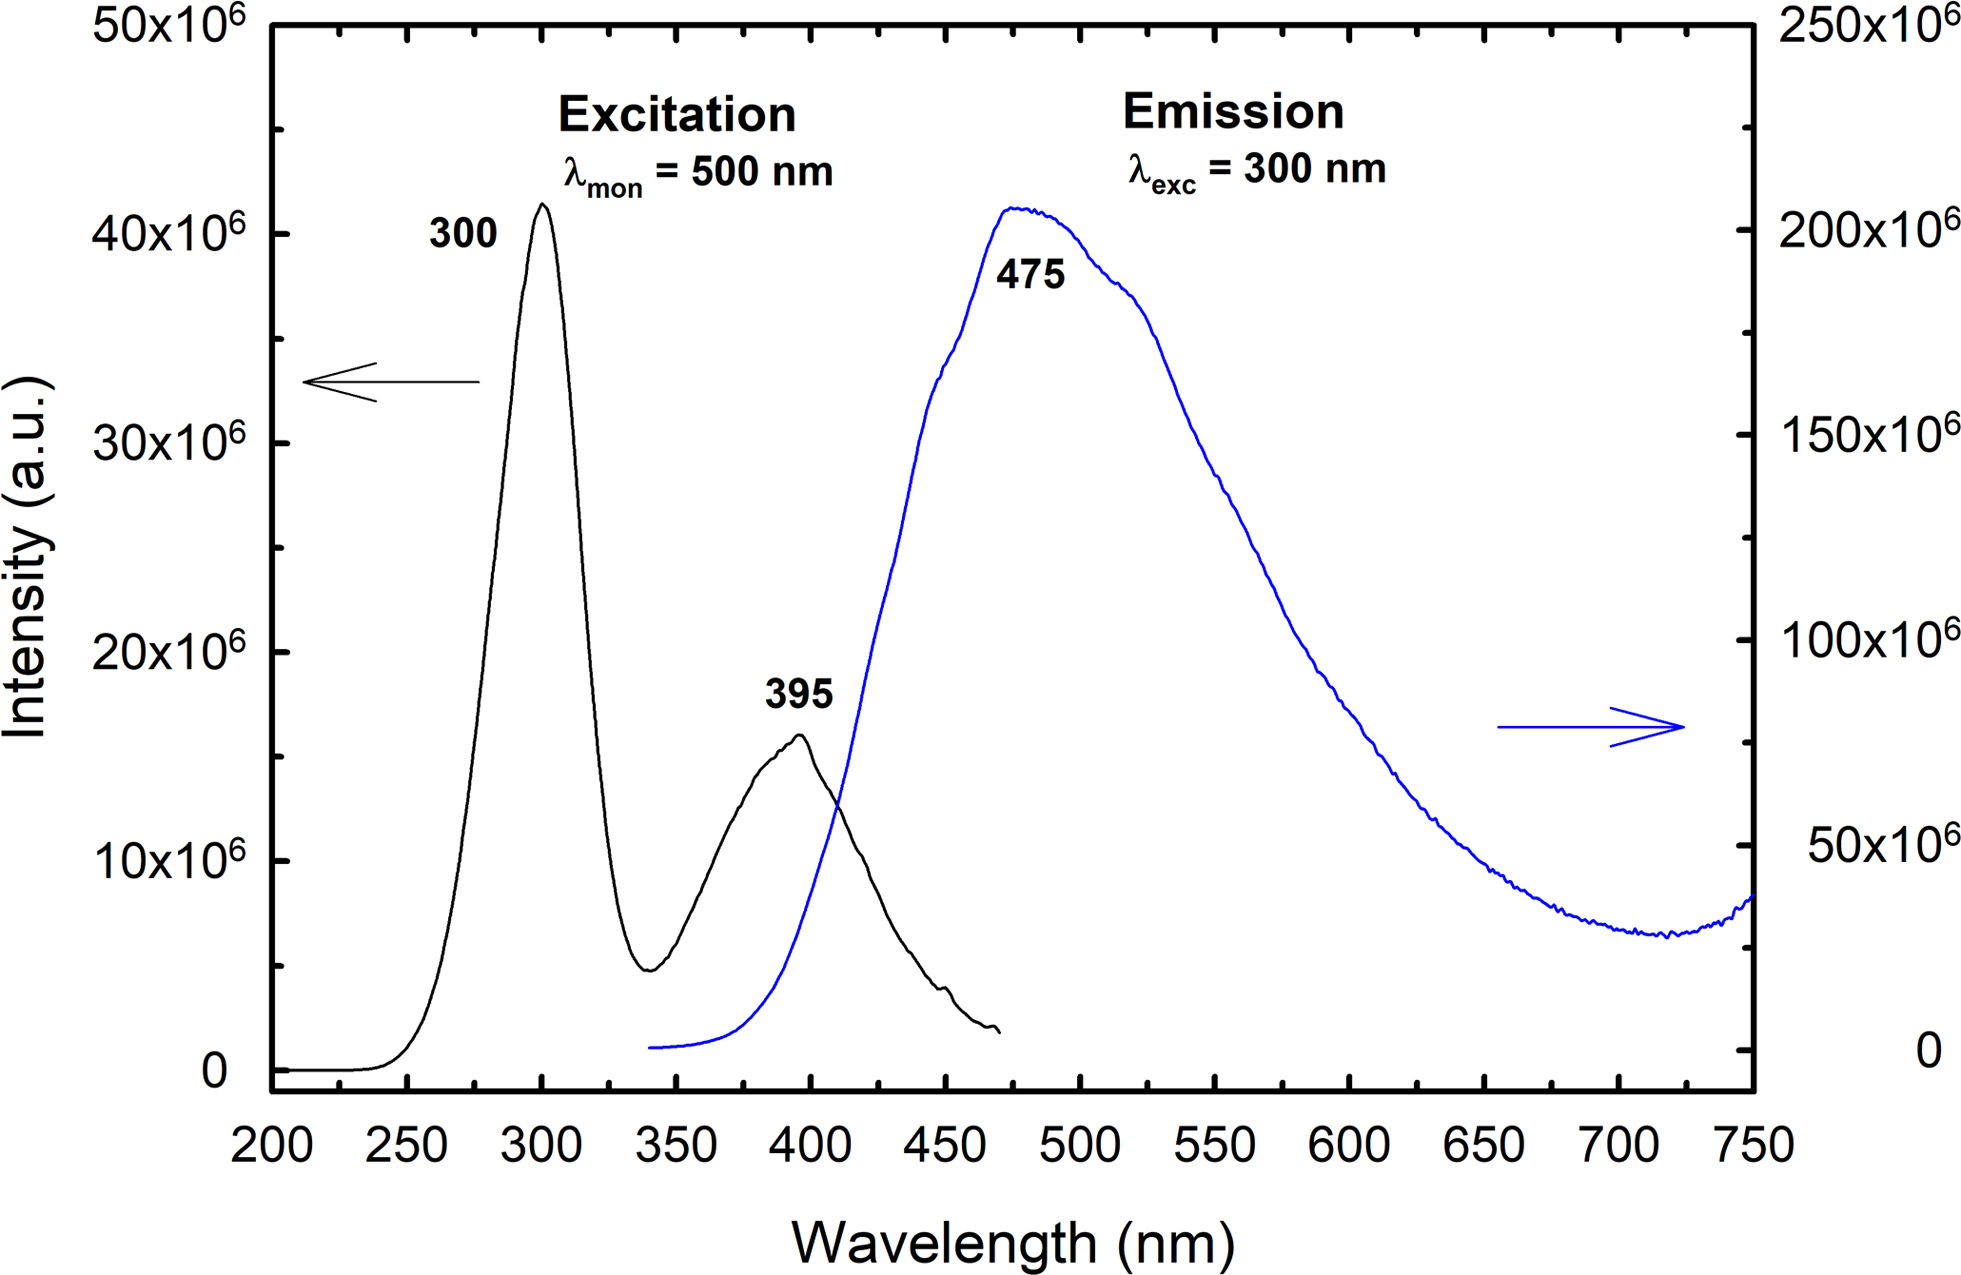
The excitation (PLE) and emission (PL) spectra of BaTiAl6O12 ceramic are presented in Fig. 9. The PLE spectrum was recorded under the monitoring of the emission wavelength at 475nm and 500nm, respectively. The spectrum consists of two broad bands, the first most intensive band in the wavelength range of 250–340nm centred at about 300nm, and the second one in the range of 340–500nm with a maximum at 395nm. No absorption band at around 500nm, typical for the Ti3+ ions, was observed in excitation spectra. The excitation at 300nm corresponds to Ti4+–O2− charge-transfer transition (CT) from the 2p orbital of O2− into the 3d orbital of Ti4+, which is common for titanates and Ti-doped compounds [37–41]. When the ceramic was excited at this wavelength, the broad-band emission ranging between 360 and 700nm and centred at 475nm was observed. This emission can be attributed to the charge-transfer transition of the Ti4+ with the following mechanism [39–41]: Ti4++hυexc→Ti3++h+→(Ti4+)*→Ti4++hυlum. In this mechanism, an electron from the valence band is transferred to Ti4+ ion with the creation of Ti3+ and a hole in the valence band (strongly coupled electron–hole system Ti3+–O−), resulting in Ti3+ ion in the electronic excited state. Subsequently, the interaction between excited (3d) electron and lattice results in the Stokes shift and finally, this excitation is radiatively annihilated, emitting the photon around 475nm.

The origin of the second absorption band centred at 395nm in the PLE spectrum is not unequivocally clear, but this band is probably associated with defect sites in the structure. The excitation of BaTiAl6O12 ceramic in this wavelength range also leads to the visible emission between 400 and 650nm (a bit blue shifted with a maximum at 460nm); however, new less intensive broad-band emission appeared in the NIR range of 720–850nm and centred at 775nm. This implies that various defect sites may also contribute to overall luminescence in BaTiAl6O12.
Electrical propertiesA real part of permittivity (ɛ′) and the dielectric loss (tanδ) of BaTiAl6O12 as a function of frequency, measured at room temperature, are shown in Fig. 10. The sample evinced very low permittivity (ɛ′)=16 and dielectric loss (tanδ) <0.0003 at a frequency 1kHz. At a frequency range 10mHz to 1MHz, the ɛ′ evinces the highest value of 16.5 at a frequency of 10mHz and smoothly decreases to approximately 16, up to a frequency of 1Hz. Then ɛ′ is approximately constant at 16 up to a frequency of 1MHz. The tanδ shows similar behaviour. At the lowest frequency of 10mHz, the sample evinced the highest loss about 0.035. Then tanδ drops sharply to 0.003 for a frequency of 1Hz. Further, the losses decrease gradually to a minimal value of approximately 0.0001 with an increasing frequency.
Conclusions and dielectric loss (tanδ) vs frequency at room temperature.")
BaTiAl6O12 was successfully prepared during the solid-state reaction of the tetragonal barium titanate and alumina mixture in an appropriate molar ratio. During thermal treatment, two events of phase changes were determined and analysed. The applied spark plasma sintering resulted in dense samples reaching the relative density of 99.5%. Coefficients of thermal expansion were calculated from the dilatometric measurements ranging from 7.20 to 8.35×10⁻⁶K−1 in dependence on the sample orientation. The EBSD analysis showed elongated grains (mean grain size of 20.19μm) with different crystallographic orientations of the orthorhombic lattice and 2.5% of monoclinic Ba3TiAl10O20 phase localised mainly in the triple points of the BaTiAl6O12 phase. The Vickers hardness and indentation modulus were force dependent and for loads between HV0.1 and HV5 ranged between 13.7GPa and 10.1GPa for the Vickers hardness and between 187GPa and 132GPa for the indentation modulus. Young's modulus calculated from resonance frequencies was 179GPa. The flexural strength and fracture toughness of BaTiAl6O12 determined by three-point bending were 129.9±4.57MPa and 1.8±0.15MPam1/2, respectively. The fractographic analysis of the fracture surfaces revealed transgranular fracture mode. In the case of optical properties, the blue broad-band emission under UV excitation was observed in BaTiAl6O12 ceramics, which is due to the charge-transfer transition of the Ti4+ and defect sites. The measurement of electrical properties at room temperature showed low permittivity (ɛ′)=16 and dielectric loss (tanδ) <0.0003 at a frequency 1kHz.
Data availability statementThe datasets generated during and/or analysed during the current study are available in the repository (https://doi.org/10.5281/zenodo.10609604).
Conflict of interestsThe authors declare that they have no known competing financial interests or personal relationships that could have appeared to influence the work reported in this paper.
Financial support of the Czech Science Foundation under project no. 21-24805S is gratefully acknowledged. This publication was supported by the project “Mechanical Engineering of Biological and Bio-inspired Systems”, funded as project No. CZ.02.01.01/00/22_008/0004634 by Programme Johannes Amos Commenius, call Excellent Research. This work was also supported by the Slovak grant agency under the grant VEGA 1/0476/22. The authors would like to thank Dr. Kamalan Mosas for recording the XPS spectra and helpful discussion. We acknowledge CzechNanoLab Research Infrastructure supported by MEYS CR (LM2023051).

