


Ceria-based compounds with trivalent dopant ions are currently being investigated as electrolytes for solid oxide fuel cells operating at low to intermediate temperatures. In these materials, the dependence of the ionic conductivity on the dopant content, the relative cation size and the dopant/vacancy or vacancy/vacancy interactions are the subject of intense research, but there is scarce information about a possible correlation between these properties and microstructural ones, such as texture. Here, we address this question in the heavily doped fluorite-like La2Ce2O7 oxide, using a combination of X-ray diffraction, electron microscopy, optical absorption, Raman scattering and impedance spectroscopy. In all cases, materials with varying degree of 〈111〉 texture are compared with untextured samples. In this context, the most relevant Raman signatures are the fluorite-like mode at ∼448cm−1 and a vacancy-related band at ∼578cm−1. Although remarkable changes were observed upon varying the sintering temperature or the excitation wavelength, both textured and untextured materials displayed similar evolution. A selective enhancement of the vacancy-related band was observed upon decreasing the excitation wavelength from 647 to 488nm, which is attributed to a resonance phenomenon involving vacancy-related electronic transitions. An indication of incipient vacancy ordering was given by the observation of an intense band at ∼346cm−1, denoting C-R2O3-like short-range order; its enhancement with the annealing temperature is attributed to the growth of the C-like regions. Conductivity was measured in textured and untextured, fully dense pellets, in the former along and across the texture direction. Impedance plots suggest that the conductivity is dominated by oxide ions and do not allow to separate a grain boundary contribution in these materials with grain size around 1–2μm. The conductivity amounts to around 10−5S/cm at 650K, with activation energy of 1.08–1.16eV in the temperature range from around 470 to 870K. Results were similar in textured and untextured materials. We conclude that there is no significant correlation between texture and vacancy concentration or vacancy ordering. A similar conclusion – no influence of texture – is reached concerning the electrical properties.
Los compuestos a base de ceria dopada con iones trivalentes se están investigando como electrolitos para pilas de combustible de óxido sólido que funcionen a temperaturas bajas o intermedias. En estos materiales se ha estudiado profusamente la dependencia de la conductividad iónica con el contenido de dopante, el tamaño relativo de los cationes y las interacciones dopante/vacante o vacante/vacante, pero hay escasa información sobre la posible correlación entre estos factores y propiedades microestructurales como la textura. En este trabajo abordamos esta cuestión en la fluorita defectiva La2Ce2O7, utilizando para su caracterización difracción de rayos X, microscopía electrónica, absorción óptica, dispersión Raman y espectroscopia de impedancia. En cada caso se comparan materiales con distinto grado de textura a lo largo de las direcciones <111> y muestras sin textura. En este contexto, los indicadores más relevantes del espectro Raman son el modo de tipo fluorita en ∼448 cm-1 y una banda relacionada con las vacantes en ∼578 cm-1. Aunque se observaron cambios notables al variar la longitud de onda de excitación o la temperatura de sinterización, la evolución fue similar en materiales texturados y no texturados. La banda relacionada con las vacantes se intensifica al disminuir la longitud de onda de excitación de 647 a 488 nm, lo que se atribuye a un fenómeno de resonancia entre la energía de excitación y transiciones electrónicas asociadas a las vacantes. Por otra parte, la presencia de una banda en torno a 346 cm-1, típica de fases C-R2O3, sugiere que existe un cierto grado de ordenamiento de vacantes a corto alcance. El aumento de la banda con la temperatura de sinterización se atribuye al crecimiento de las regiones de tipo C. Se midió la conductividad eléctrica en cerámicas densas texturadas y no texturadas, en el primer caso paralela y perpendicularmente a la dirección de la textura. Los gráficos de impedancia sugieren que la conductividad se debe principalmente a iones de oxígeno y no permiten separar una contribución de las fronteras de grano en estos materiales con un tamaño de grano de alrededor de 1 a 2 μm. La conductividad es ∼10-5 S/cm a 650 K, con una energía de activación de 1,08 a 1,16 eV en el intervalo de temperaturas de ∼470 a 870 K. Se obtuvieron resultados similares en materiales texturados y no texturados. Se concluye que no existe una correlación significativa entre la textura y la concentración de vacantes o el ordenamiento de las mismas. Se llega a una conclusión similar en lo que se refiere a las propiedades eléctricas.
CeO2-based oxides have attracted considerable attention as promising materials for various applications, particularly those involving high ionic conductivity. The introduction of di- or trivalent dopants into the ceria lattice creates oxygen ion vacancies, which can improve the oxygen transport properties and ionic conductivity of the material [1–3]. La3+-doped ceria has been extensively studied as a possible electrolyte material in solid oxide fuel cells (SOFCs) operating at low to intermediate temperatures (400–800°C) [3] and different doping levels and synthesis methods have been explored to optimize the performance of these electrolytes [4,5]. The 50% doped compound, La2Ce2O7 (abbreviated as LC50 throughout this work) presents a defect-fluorite-like structure with 12.5% anion vacant sites, which confer this material an ionic conductivity of 22.6mScm−1 at 800°C [6].
The amount of oxygen vacancies increases with La3+ doping in the CeO2 matrix according to Eq. (1) (in Kröger–Vink notation) as follows:
where La′Ce represents a La3+ cation located on a Ce4+ site, VO•• stands for an oxygen vacancy and OOx represents an on-site oxygen ion.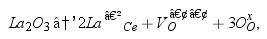
The dependence of the ionic conductivity (σ) of doped fluorites on the dopant/vacancy concentration and on the relative size of the host and dopant ionic radii has been intensely investigated, especially for Y, Sc and rare earth doped ZrO2[7–10]. The decrease of σ above a certain dopant concentration has been attributed to the combined contribution of vacancy–vacancy, vacancy–dopant and dopant–dopant associations, the former one being the dominant term in yttria-doped zirconia [9]. In highly doped zirconia the vacancy alignment takes place mainly along 〈111〉 cubic directions.
The relationship between dopant or vacancy association and ionic conductivity in doped CeO2 has been less studied and focuses on rare earth elements providing the highest σ, such as Gd, Sm or Y [11,12]. According to previous reports [11], a tendency for the clustering of oxygen vacancies can be expected within a doped ceria system, in analogy to doped zirconia, the alignment direction depending on the dopant size and concentration. For La doping in ceria, simulation studies have shown that vacancy alignment would occur with equal probability along both 〈111〉 and 〈110〉 [13,14]. Most interestingly, there is both experimental and computational evidence for the tendency of RxCe1−xO2−x/2 compounds towards C-R2O3-like vacancy ordering at high doping levels for RNd and beyond [13,15]. Although no long-range vacancy ordering has been detected in La2Ce2O7, a tendency to form C-like domains in this compound is supported by the presence of a strong background modulation in neutron diffraction patterns in the regions where C-like superstructure peaks would appear [14,16,17].
It is tempting to raise the question of whether vacancy ordering at the unit cell level manifests as microstructural alignment along preferred directions, i.e. texture. To our knowledge, this aspect has not been investigated in either doped zirconia or ceria.
In previous works, we have reported on the successful sintering of high density La2Ce2O7 ceramics with strong 〈111〉 texture [18]. The availability of highly textured La2Ce2O7 ceramics prompted us to test the hypotheses concerning the relationship between oxygen vacancy clustering, oxygen vacancy migration and texturing in the high density 〈111〉-textured La2Ce2O7 ceramic systems. For this purpose, Raman scattering is a very suitable technique because of its sensitivity to local ordering and vacancy concentration in doped fluorites [19,20]. Textured and untextured La2Ce2O7 ceramics sintered at increasing temperatures were used for comparison purposes. The impact of texturing in oxygen dynamics in both types of ceramics was also investigated using ionic conductivity measurements.
Materials and methodsThe detailed process of synthesizing LC50 nanoparticles using co-precipitation has been previously documented in our earlier publication [4]. In the present study, LC50 nanopowders prepared in the laboratory were subjected to a calcination process at 850°C for 120min, with a gradual heating rate of 4°C/min within a muffle furnace. To facilitate a comparative analysis, we also procured commercially available LC50 powders (polycrystalline and un-textured) from Trixotech Advanced Materials Pvt. Ltd., India.
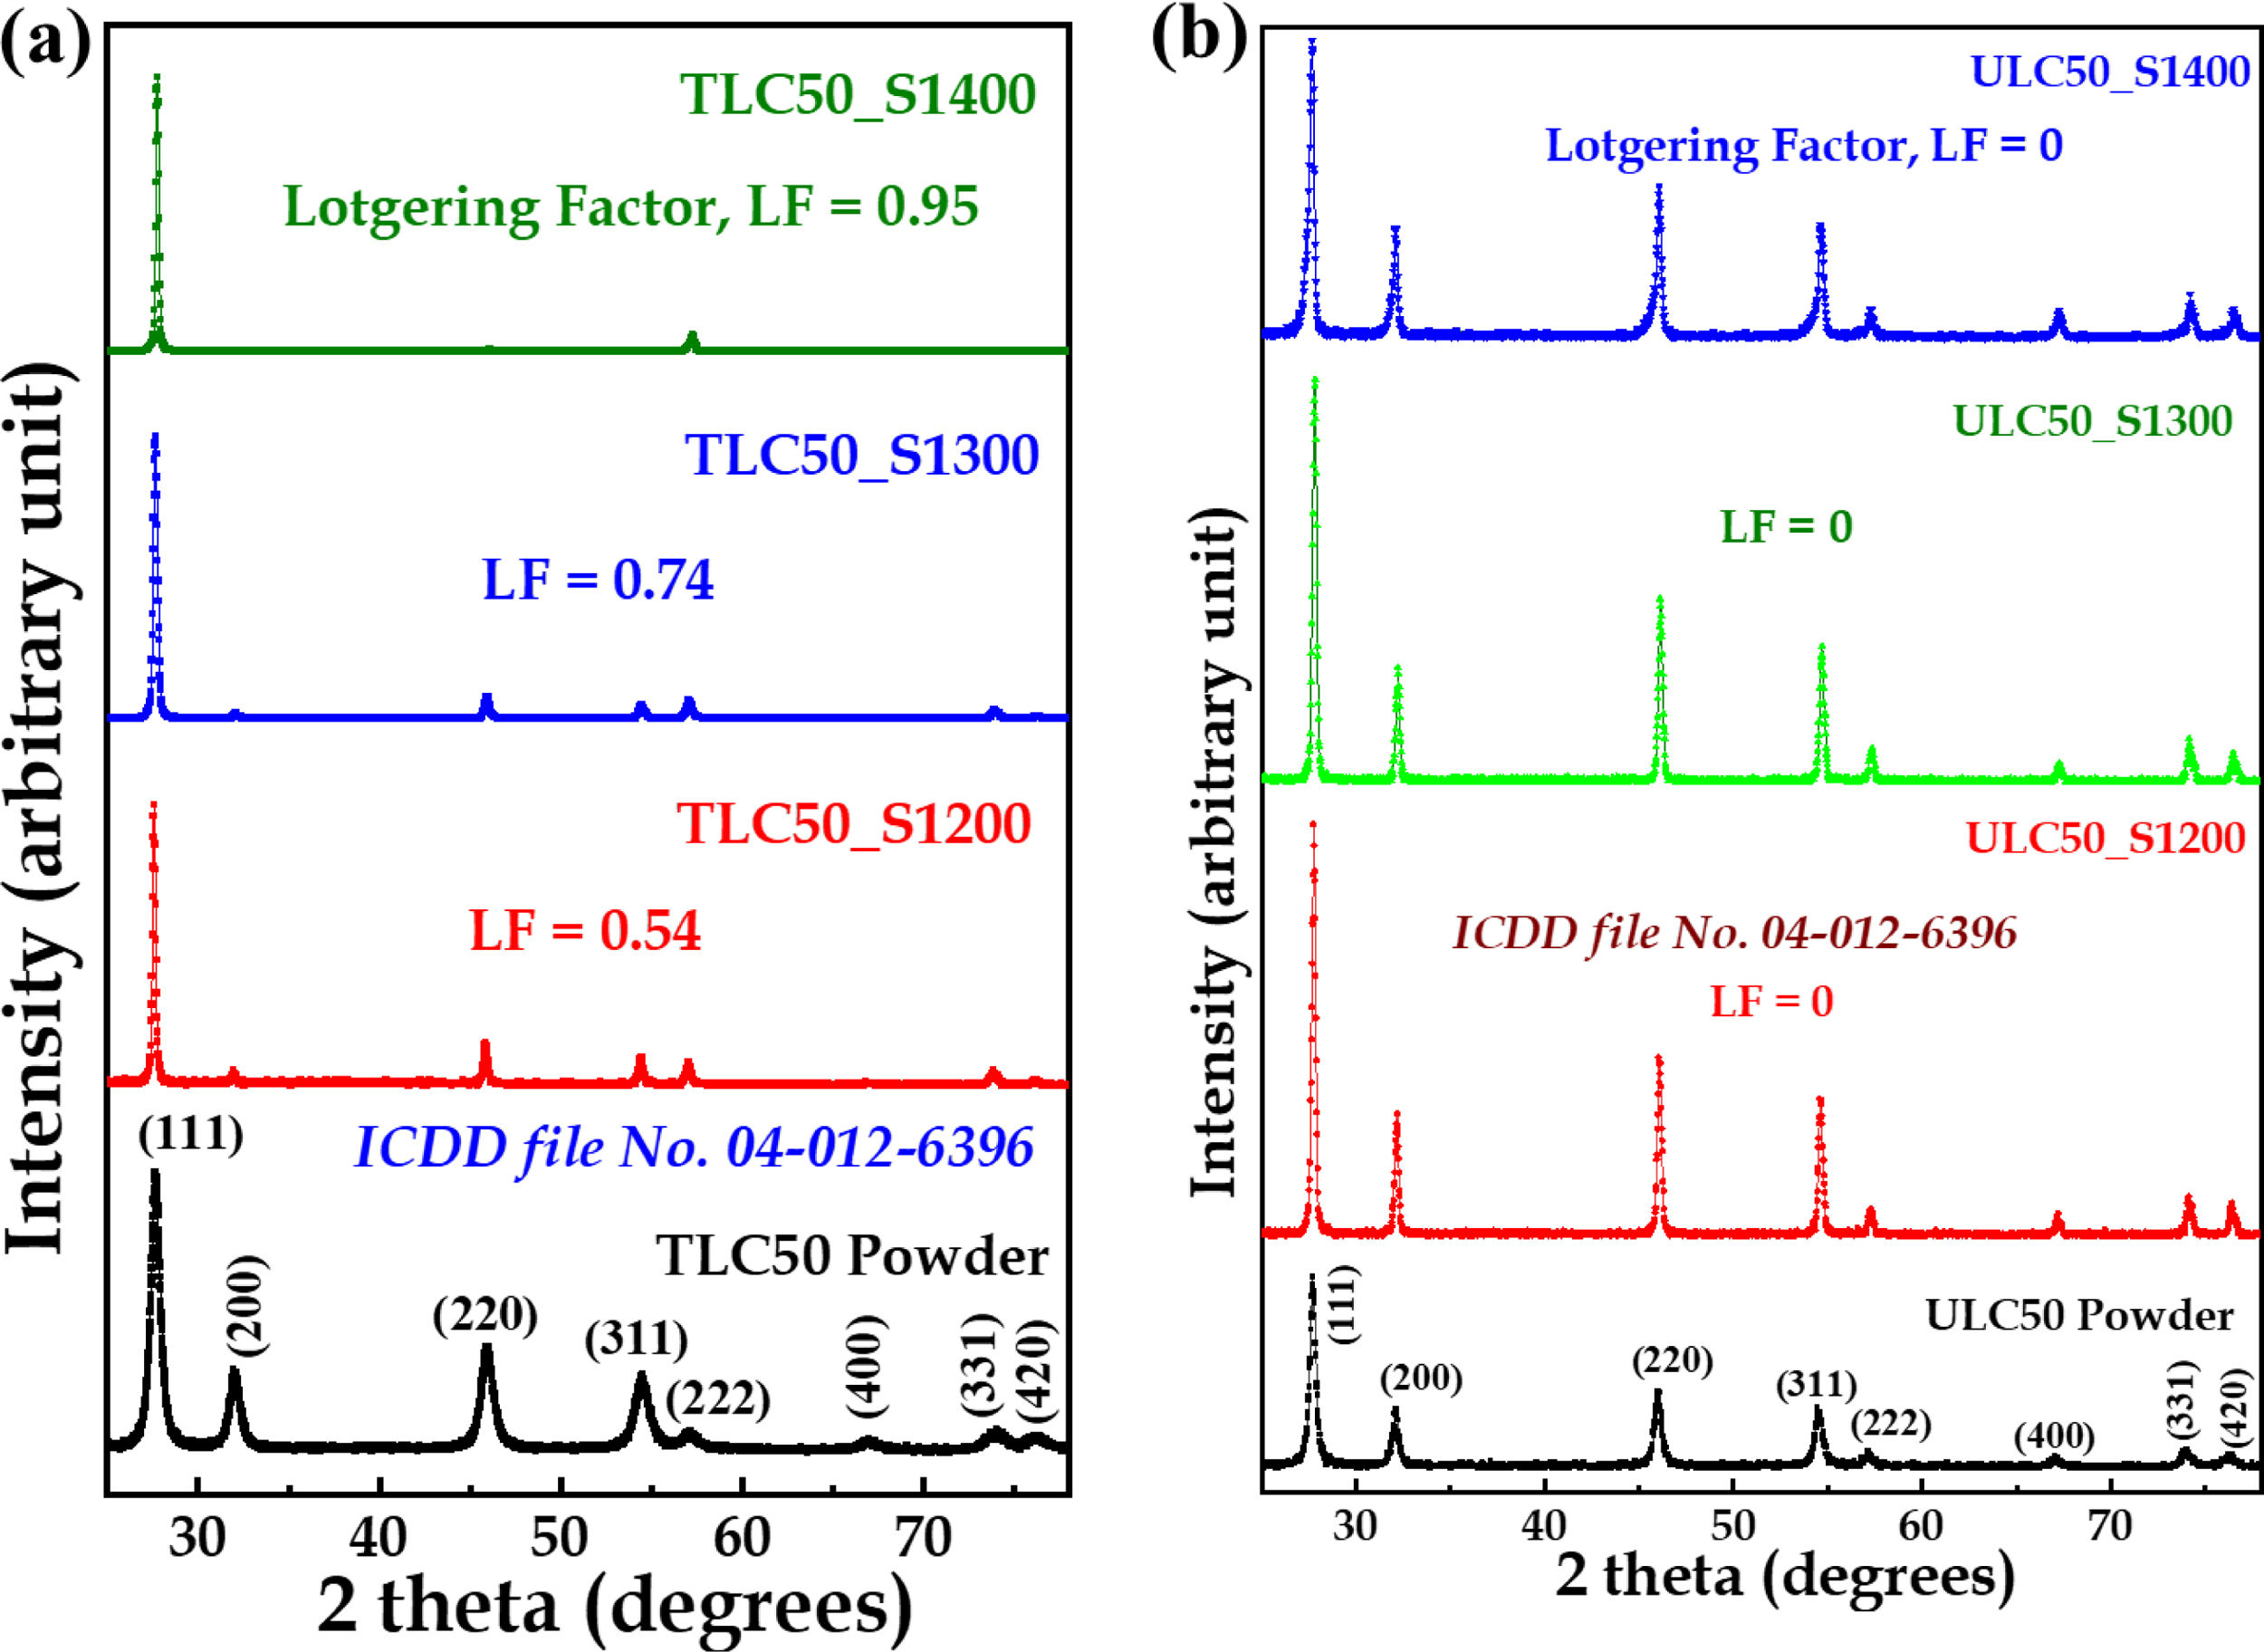
The LC50 calcined powder was shaped into pellets using a uniaxial pressure of approximately ∼750MPa in a hardened stainless-steel die with a 12mm diameter. Subsequently, conventional pressureless sintering of these LC50 pellets took place in a muffle furnace, reaching a temperature of 1400°C, for a duration of 120min, with a heating rate of 4°C/min. To ensure a homogeneous texture throughout the pellet, the sample was placed in the furnace in an upright position. The Lotgering factor (LF) [21] of the resulting sintered LC50 ceramics was determined to be 0.95 for (111) reflections, and it serves as an illustration of textured ceramics, denoted as TLC50_S1400.
In a similar manner, commercially procured LC50 powders underwent conventional sintering in a muffle furnace, reaching a temperature of 1400°C for 120min. The sintered LC50 ceramic produced from these commercial powders exhibited minimal texture, with an LF value of 0, and is referred to as un-textured ceramic, designated as ULC50_S1400 throughout this paper. For comparison purposes, we have also sintered both textured and untextured pellets at lower temperatures (1300°C, 1200°C, 1100°C, and 1000°C) for a duration of 120min, with a heating rate of 4°C/min. These samples are denoted as TLC50_S1300, TLC50_S1200, TLC50_S1100, and TLC50_S1000, for textured ceramics, and ULC50_S1300, and ULC50_S1200, ULC50_S1100, and ULC50_S1000, for untextured ceramics.
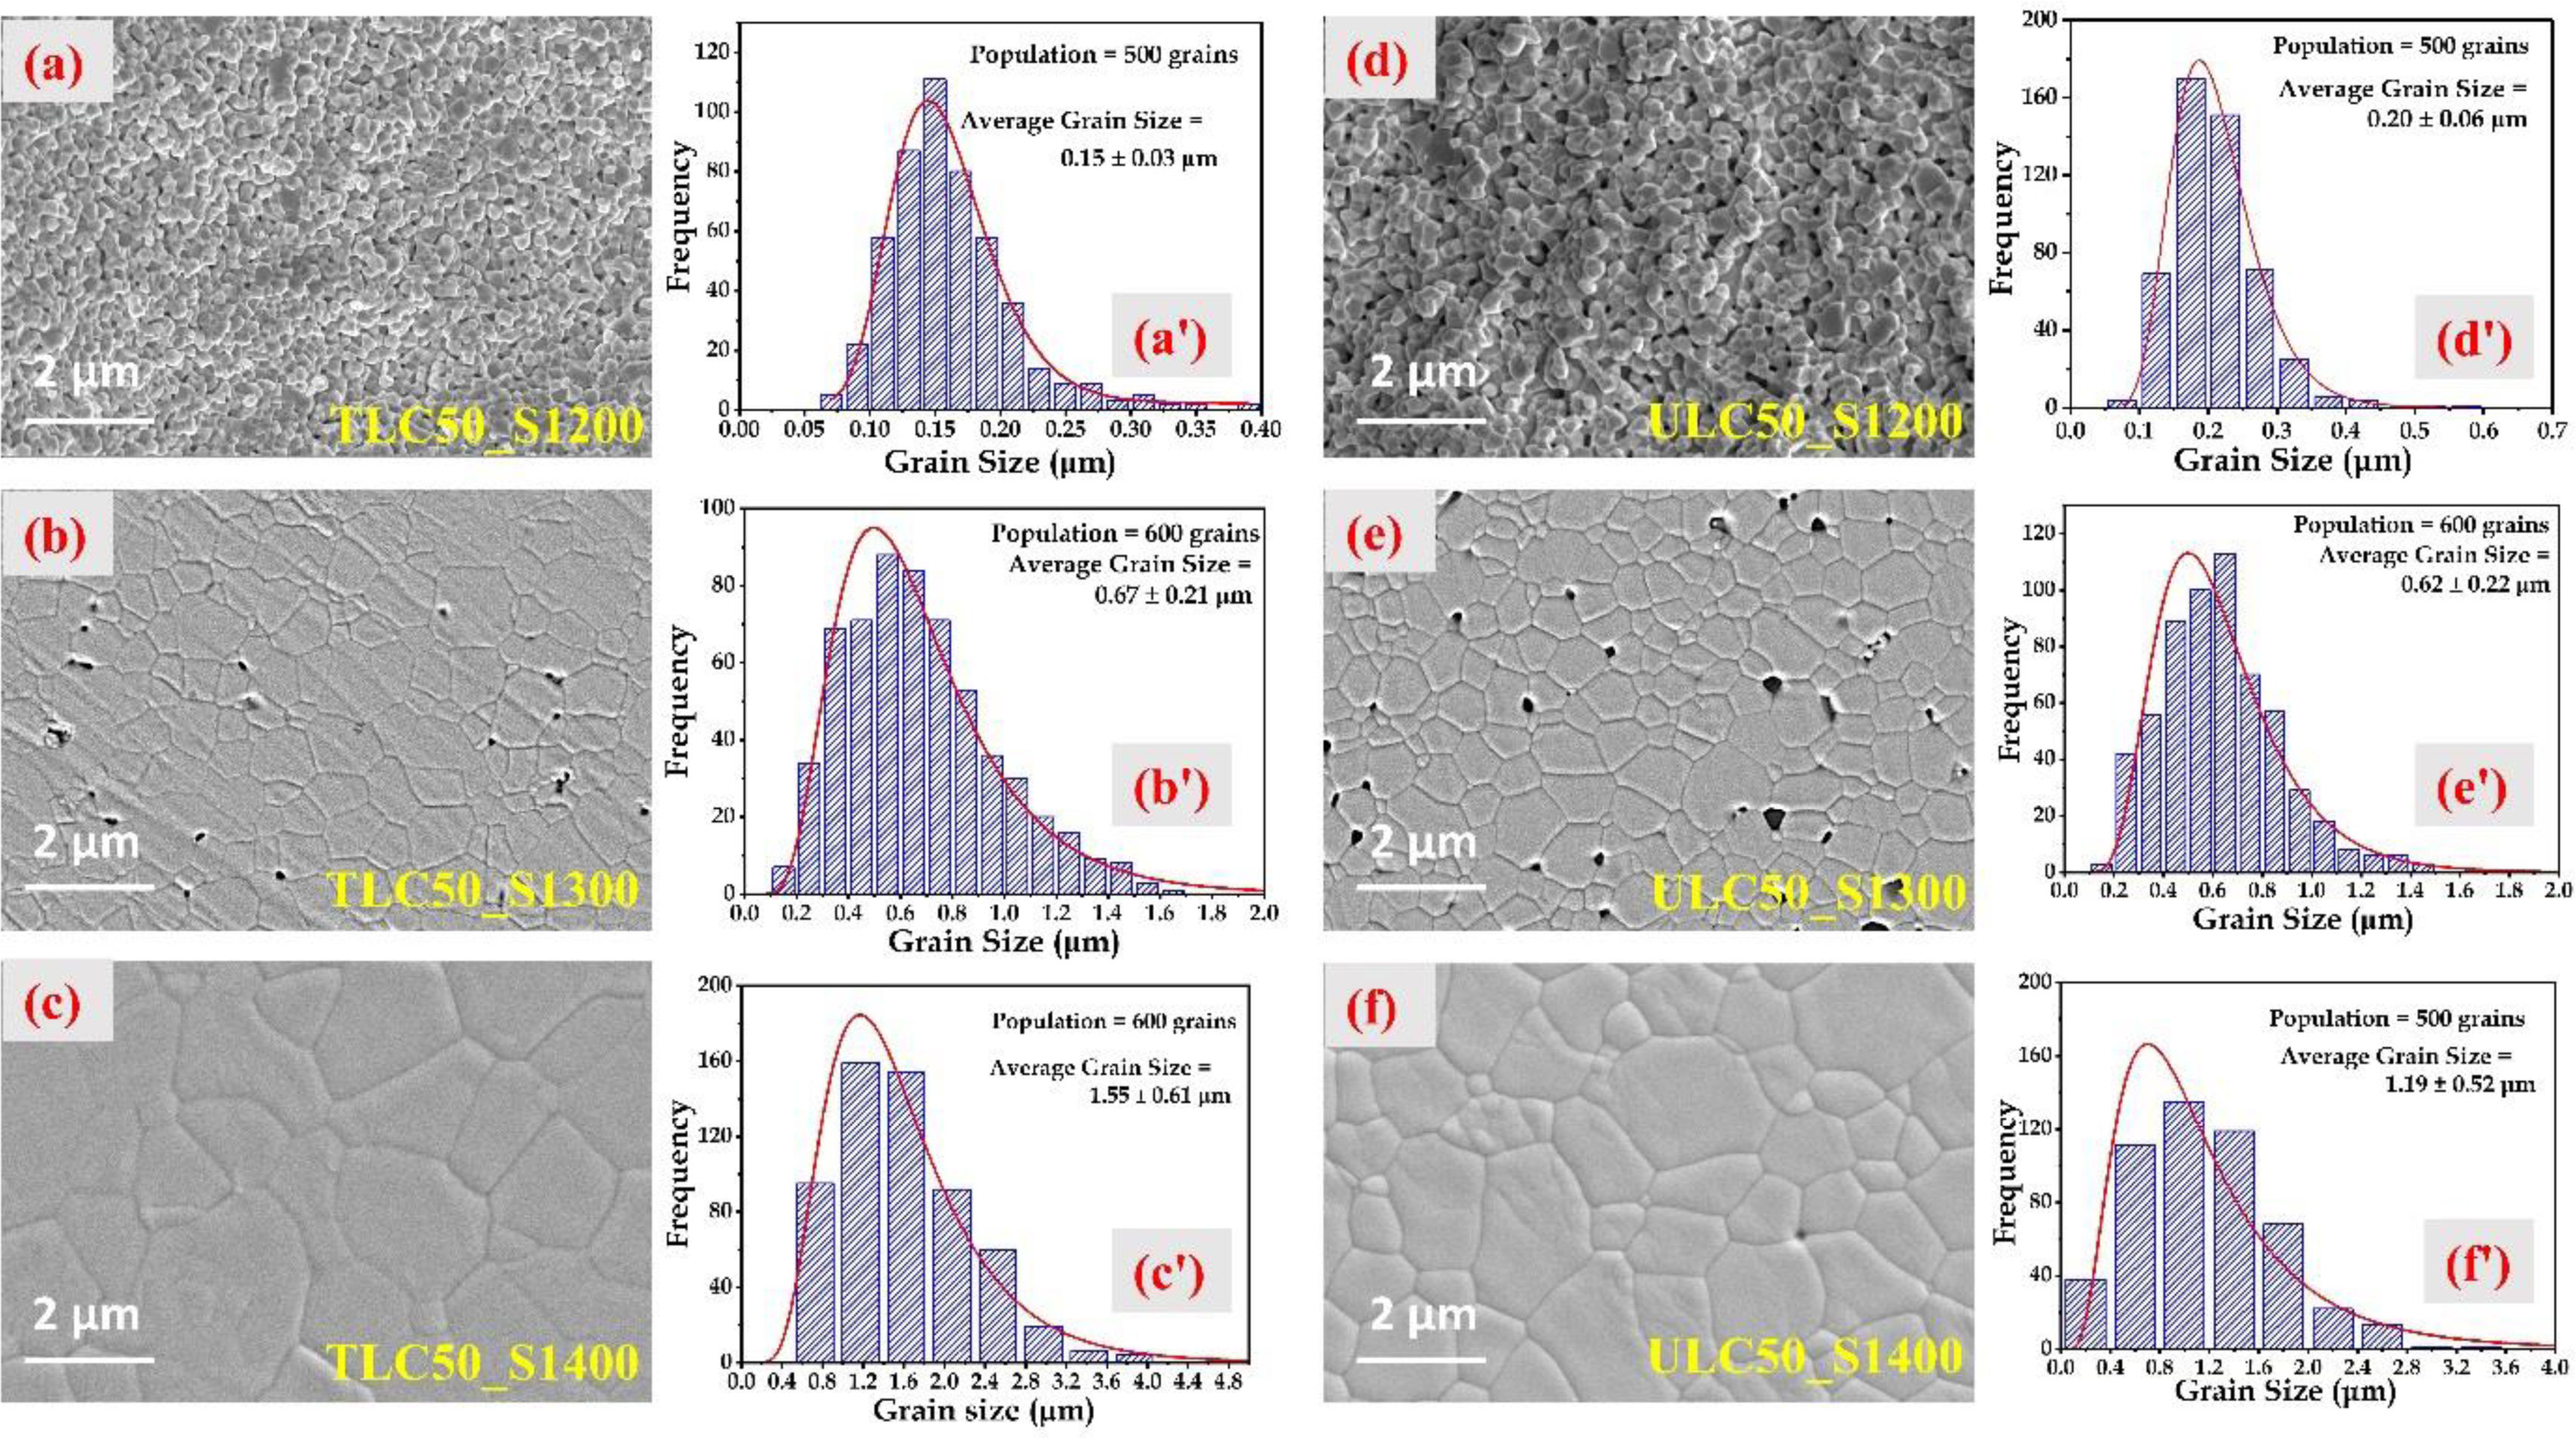
X-ray diffraction (XRD), employing Cu-Kα radiation with a wavelength of λ=0.154nm (Rigaku Miniflex 600, Japan) was used to conduct phase analysis on both the calcined nanopowders and the sintered ceramics. To verify the texture homogeneity, we measured XRD on both sides of the sintered ceramic samples. The scan rate was set at 2°/min, with a step size of 0.02°, for the 25–78° 2θ range. The microstructural characteristics of all sintered samples were examined using a Zeiss-Gemini 500 field emission scanning electron microscope (FESEM) unit. The grinding process involved the use of SiC papers with grit sizes of US CAMI 320, 400, 600, 800, and 1200, followed by polishing with colloidal diamond suspensions (with particle sizes of 9, 3, and 1μm) and colloidal silica suspension (with a particle size of 0.04μm) on all pellets. Subsequently, the pellets underwent thermal etching at a temperature 150°C below the sintering temperature for a duration of 30min, aimed at capturing FESEM micrographs. The measurement of grain size was conducted using ImageJ software, adhering to the ASTM E112-13 (2021) standard. On average, each measurement encompassed more than 500 grains from different micrographs.
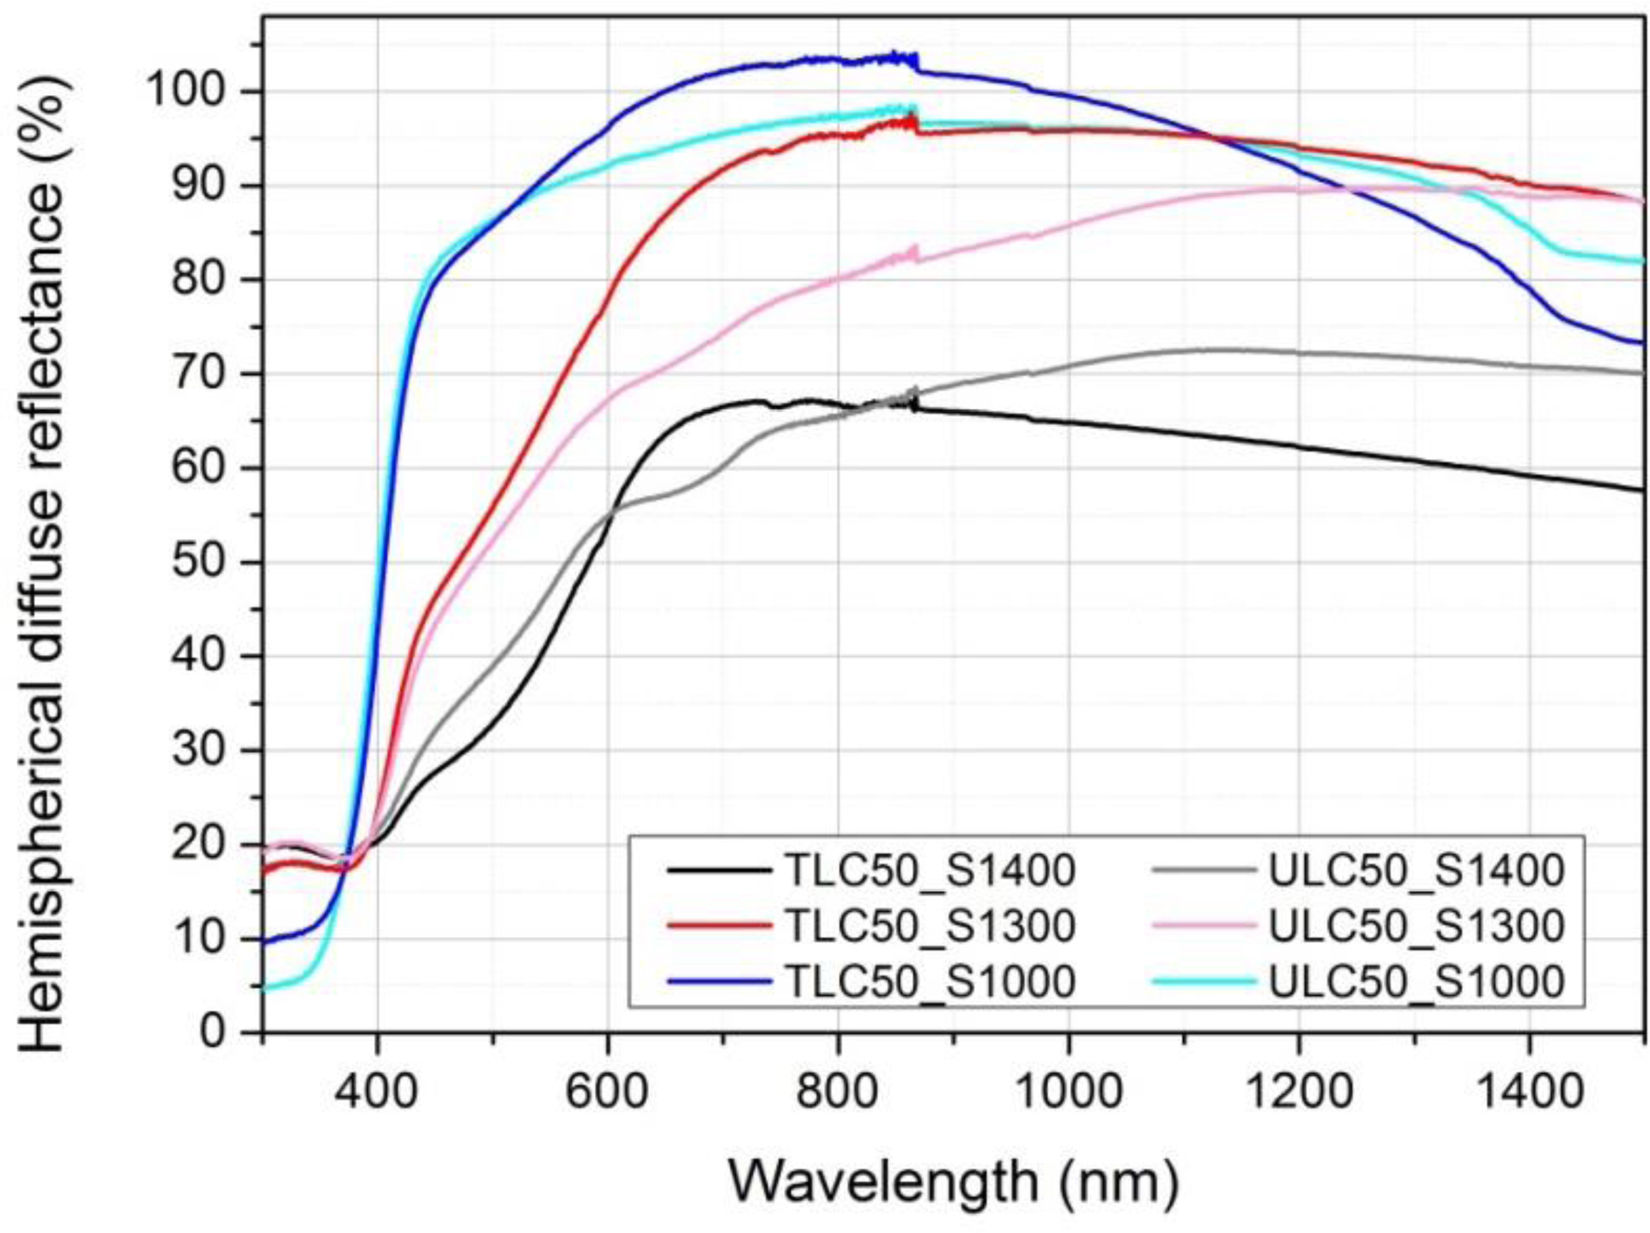
The UV–VIS–NIR hemispherical reflectance of the textured (TLC50) and untextured (ULC50) ceramic pellets sintered a 1000°C, 1300°C and 1400°C was measured using a Cary5000 UV–VIS–NIR spectrophotometer (Agilent Technologies) equipped with the internal diffuse reflectance accessory. This accessory consists of a 110mm diameter integrating sphere with sample ports for reflectance and transmittance and appropriate UV-VIS and NIR detectors. The reflectance was measured with reference with a Spectralon® large plate, on pellets around 0.5mm thick. In-line transmission measurements were also performed.
Raman spectra were recorded in a DILOR XY spectrometer equipped with a liquid nitrogen cooled CCD detector, using as excitation lines an Oxxius laser at 532nm (model LCX-532S) and the 647, 568 and 488nm lines of a mixed Kr+/Ar+ laser (model Melles Griot 643-RYP-A02).
A SI1260 Impedance Gain-Phase Analyzer (Solartron Instruments, Farnborough Hampshire UK) was used to measure the impedance in the frequency range from 0.1 to 107Hz. This allows separating easily the sample conductivity from the electrode polarization. Ag-paste electrodes (RS 186-3600, RS Components, UK) were painted on pellets of samples TLC50_S1400 and ULC50_S1400 in the temperature range from 200 to 400°C. Two different electrode arrangements were used to measure the conductivity. ACROSS: Ag-paste electrodes were brush-painted on opposite faces of the pellet with around 0.25cm2 area and 0.05cm thick. This configuration was used for conductivity measurements across the pellets. ALONG: Another piece of sample TLC50_S1400 was used to get an estimate of the conductivity of the sample in the direction parallel to the pellet large surface. Two Ag-paste electrodes separated approximately 2mm were painted on one side.
Experimental resultsStructural and microstructural analysisFig. 1a illustrates the XRD patterns for TLC50 ceramics and powder, with ICDD file no. 4-012-6396 serving as the reference standard for indexing. The XRD pattern of TLC50 nanopowders shows a cubic fluorite structure without any noticeable preferential orientation. However, upon sintering at 1400°C, the TLC50 ceramic pellets exhibit a significant in-plane alignment, as assessed through Lotgering factor calculations. As the sintering temperature increases, the peak intensities for the (111) family of reflections become increasingly prominent.
 TLC50 powders calcined at 850°C and ceramics sintered at different temperatures, (b) ULC50 commercial powders, and ceramics sintered at different temperatures.")
The extent of texture in the sintered La2Ce2O7 ceramic samples under various conditions was determined using the Lotgering factor [21]. The Lotgering factor was calculated based on XRD peak intensities with the following equation:
where p=∑Iijk/∑Ihkl and po=∑I0ijk/∑I0hkl. ∑Iijk signifies the total peak intensities of all Iijk peaks and ∑Ihkl represents the total peak intensities of all recorded hkl peaks in the XRD pattern of the textured sample. Similarly, ∑I0ijk and ∑I0hkl are the corresponding values for the untextured sample. The summation of peak intensities for the untextured sample was determined using ICDD file no. 04-012-6396. In our samples, we have calculated the Lotgering factor for the (111) family of reflections. LF=0 for the TLC50 powder and takes values 0.54, 0.74, 0.95 for TLC50 samples sintered 2h at 1200, 1300 and 1400°C, respectively.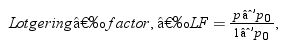
Similarly, Fig. 1b shows the XRD patterns of ULC50 procured powder and ceramics sintered at different temperatures, which portrays the phase-pure cubic fluorite polycrystalline structure. LF=0 for ULC50 samples sintered 2h at any temperature between 1000 and 1400°C.
The average grain size for the TLC50 ceramic samples (Fig. 2a–c) sintered at 1200°C, 1300°C, and 1400°C was estimated to be 0.15±0.03μm, 0.67±0.21μm, and 1.55±0.61μm, respectively. Similarly, for ULC50 ceramic samples (Fig. 2d–f), the average grain size was estimated to be 0.20±0.06μm, 0.62±0.22μm, and 1.19±0.52μm, respectively.
UV–VIS–NIR characterization FESEM micrographs and (aʹ–cʹ) grain size histograms of TLC50 ceramics sintered at 1200, 1300 and 1400°C. (d–f) FESEM micrographs and (dʹ–fʹ) grain size histograms of ULC50 ceramics sintered at 1200, 1300 and 1400°C.")
The hemispherical diffuse reflectance spectra are given in Fig. 3. For the samples sintered at 1300 and 1400°C, relative densities estimated from weight/volume ratio of the pellets were around 90%. The ones sintered at 1000°C were around 60% dense. Differences in porosities and grain sizes can also be observed in the FESEM micrographs (see Fig. 2). With this in mind, the long wavelength decrease of reflectance can be understood as an increase of the transmittance (for the denser pellets with larger grain size, sintered at 1400°C) or of the forward scattered light (for the pellets with the smaller grain size, the ones sintered at 1000°C). At wavelengths shorter than 400nm there is a strong decrease of reflectance, associated to strong sample absorption in all cases. The reflectance minimum is limited by the surface reflectance, which is larger the denser the samples. Differences in scattering (and light path length) among samples makes it very difficult, if not impossible [22], to compare quantitatively the absorption in the visible region. One can however observe in Fig. 3 (and Fig. S1 of the supporting information) that all samples have absorption features in the 400–600nm region, increasing as the wavelength shortens and with a clear shoulder at around 500nm. This shoulder is better defined in the denser samples. Note however that this is most probably due to a longer light path length in these samples and tells nothing about the relative intensity of the 500nm band or concentration of the responsible entity. The light path length becomes less different among samples as the absorption intensity increases and the absorption extinction length decreases (in the UV), and thus the apparent difference in relative intensity of VIS and UV absorption bands between samples is a consequence of very different scattering (and light path length).
 and untextured (U). The number after the S indicates the sintering temperature in °C.")
The samples prepared with commercial powders show an additional absorption band with maximum at around 670nm, which might be associated to some unknown, optically active impurity. As both textured and untextured samples present the same trend in resonant Raman scattering (see below), irrespective of their different origin and the presence or absence of that band, we conclude that the band at 670nm is not relevant for the interpretation of the resonance effect.
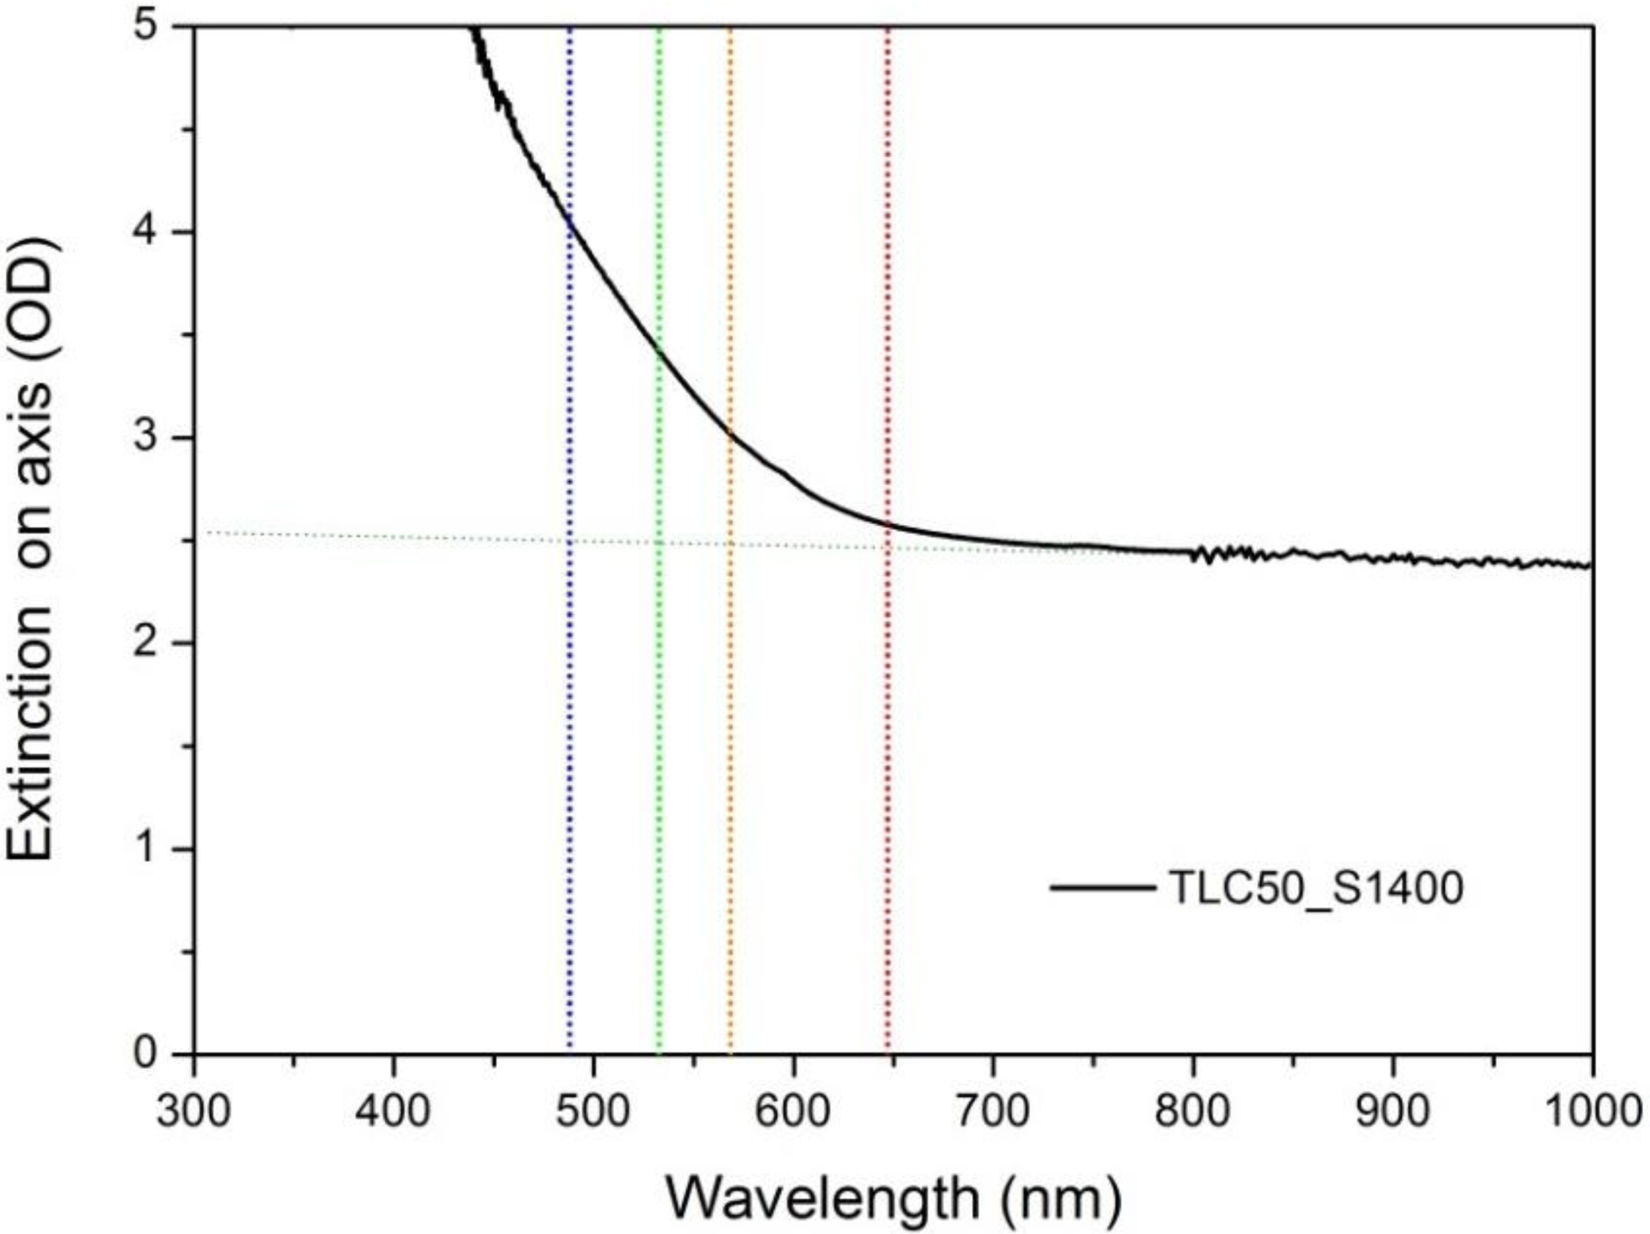
An estimate of the extinction coefficient for the TLC50_S1400 sample could be obtained from on-axis transmittance measurements. In spite of the very large scattering, which is evident by background attenuation of more than 102, absorption is seen over this background (see Fig. 4). Absorption coefficients (α) have been estimated from the extinction minus background values at the indicated wavelengths, which give: α (at 647.1nm)=9.3cm−1; α (at 568.45nm)=26cm−1; α (at 532.52nm)=42cm−1; α (at 488nm)=66cm−1. The real absorption coefficients will be smaller, as those are estimated from a sample with large scattering. That is to say, a lower limit of the absorption length (inverse of the absorption coefficient) can be given, 150μm (at λ=488nm) and 1080μm (at λ=532nm) for this sample. As this is orders of magnitude larger than the sample grain size, we may conclude that the laser light explores the bulk of the grains in the Raman experiments.
Raman spectroscopy
Raman scattering measurements have been made in LC50 ceramics, to provide insight into the structural properties related to vacancy concentration or ordering.
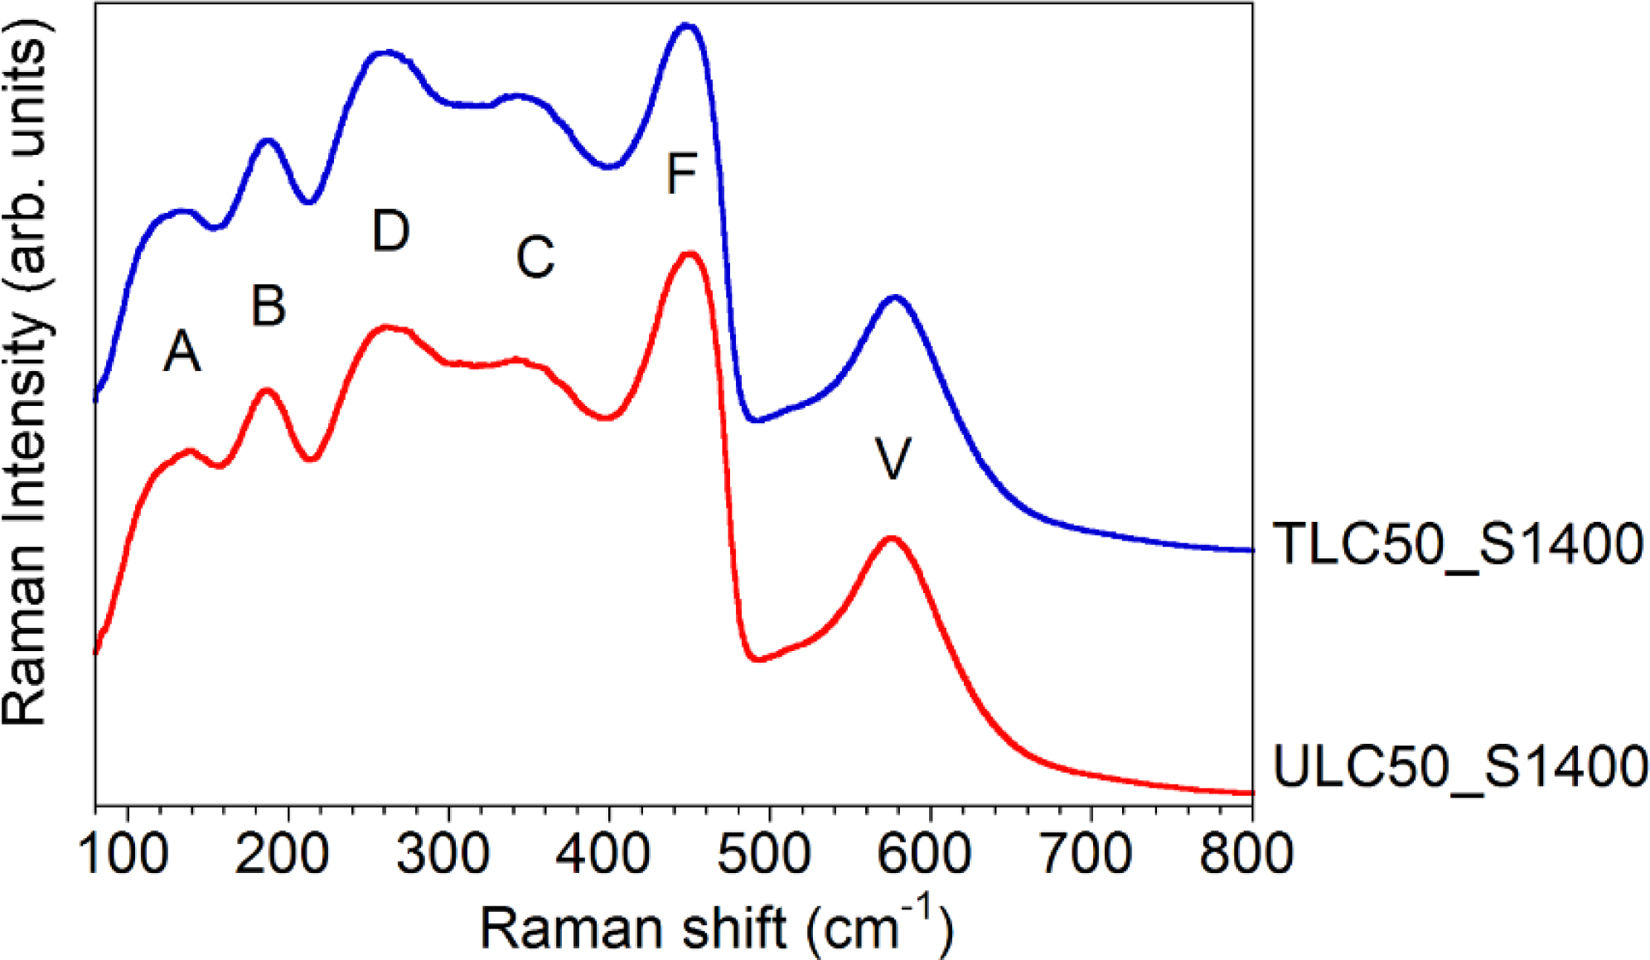
Fig. 5 displays representative spectra of textured (TLC50_S1400) and untextured (ULC50_S1400) LC50 compounds. Although a single band with T2g symmetry would be expected in a cubic fluorite with Fm3¯m space group (SG), both spectra present at least 6 broad bands, with maxima around 132 (A), 187 (B), 262 (C), 346 (D), 448 (F) and 578 (V)cm−1.
 and untextured (ULC50_S1400) LC50 compounds (λ=532nm).")
The evolution of the spectrum as a function of dopant content in RxCe1−xO2−x/2 compounds [15,17,23] shows that the F band is correlated with the fluorite-like T2g mode. The F mode appears at 465cm−1 in CeO2; the softening to 448cm−1 in La2Ce2O7 is attributed to the larger size and smaller charge of the La3+ dopants, compared to Ce4+. As regards the other bands, they are usually explained as local modes activated because of the presence of La3+ dopants and oxygen vacancies [24–27]. According to Nakajima et al. [25], the V and D bands would arise from oxygen vibration in O6Ov defects (Ov being an oxygen vacancy and O6 representing the octahedral oxygen coordination shell around it), whereas bands below 200cm−1 would come from the M4Ov tetrahedral complex, M being a cation. The similar intensity of the V and D bands in textured and untextured samples, relative to the rest of the spectrum, implies that both materials have the same vacancy amount. This conclusion agrees with the assumption that the number of vacancies is just dictated by the amount of La dopants, in the absence of Ce reduction effects.
Finally, the C band has been identified as coming from C-like domains embedded within the fluorite long-range phase (C standing here for the C-R2O3 structure with Ia3¯ SG) [17]. The attribution is based on the similarity of the LC50 spectrum with that of other RxCe2−xO7−x/2 compounds presenting long-range C-like structure or a hybrid phase consisting of C domains embedded in an F matrix, depending on the amount of dopants and on the nature of the rare-earth [6,15,26,28]. The attribution is supported by the fact that the Raman spectrum of C-R2O3 compounds is characterized by an intense band in the 310–390cm−1 range [29,30]. Though no vacancy ordering has been detected in LC50 by XRD, the assignment of the C band to C-like domains is supported by the presence of a strong background modulation in neutron diffraction patterns in the regions where C-like superstructure peaks would appear. The background has been modelled by assuming the presence of incipient C-like ordering [14,16,17].
In any case, the similarity between the spectra of textured and untextured LC50 compounds, in particular of the vacancy-related V band, suggests that texture has not a particular incidence in Raman spectra. It does not seem to be related to a higher vacancy concentration, for instance. To clarify these points, additional measurements have been performed.
In a first step, samples annealed at temperatures increasing from 1000 to 1400°C were explored, to see whether Raman spectra could reflect changes related to the enhancement of texture above 1300°C. Then, the spatial homogeneity of the samples was tested at room temperature by recording spectra onto both the pellet flat surfaces and freshly cut cross-sections. Finally, spectra were recorded at variable excitation wavelength within the visible range, in an attempt to elucidate a possible correlation between texture and the defects electronic structure.
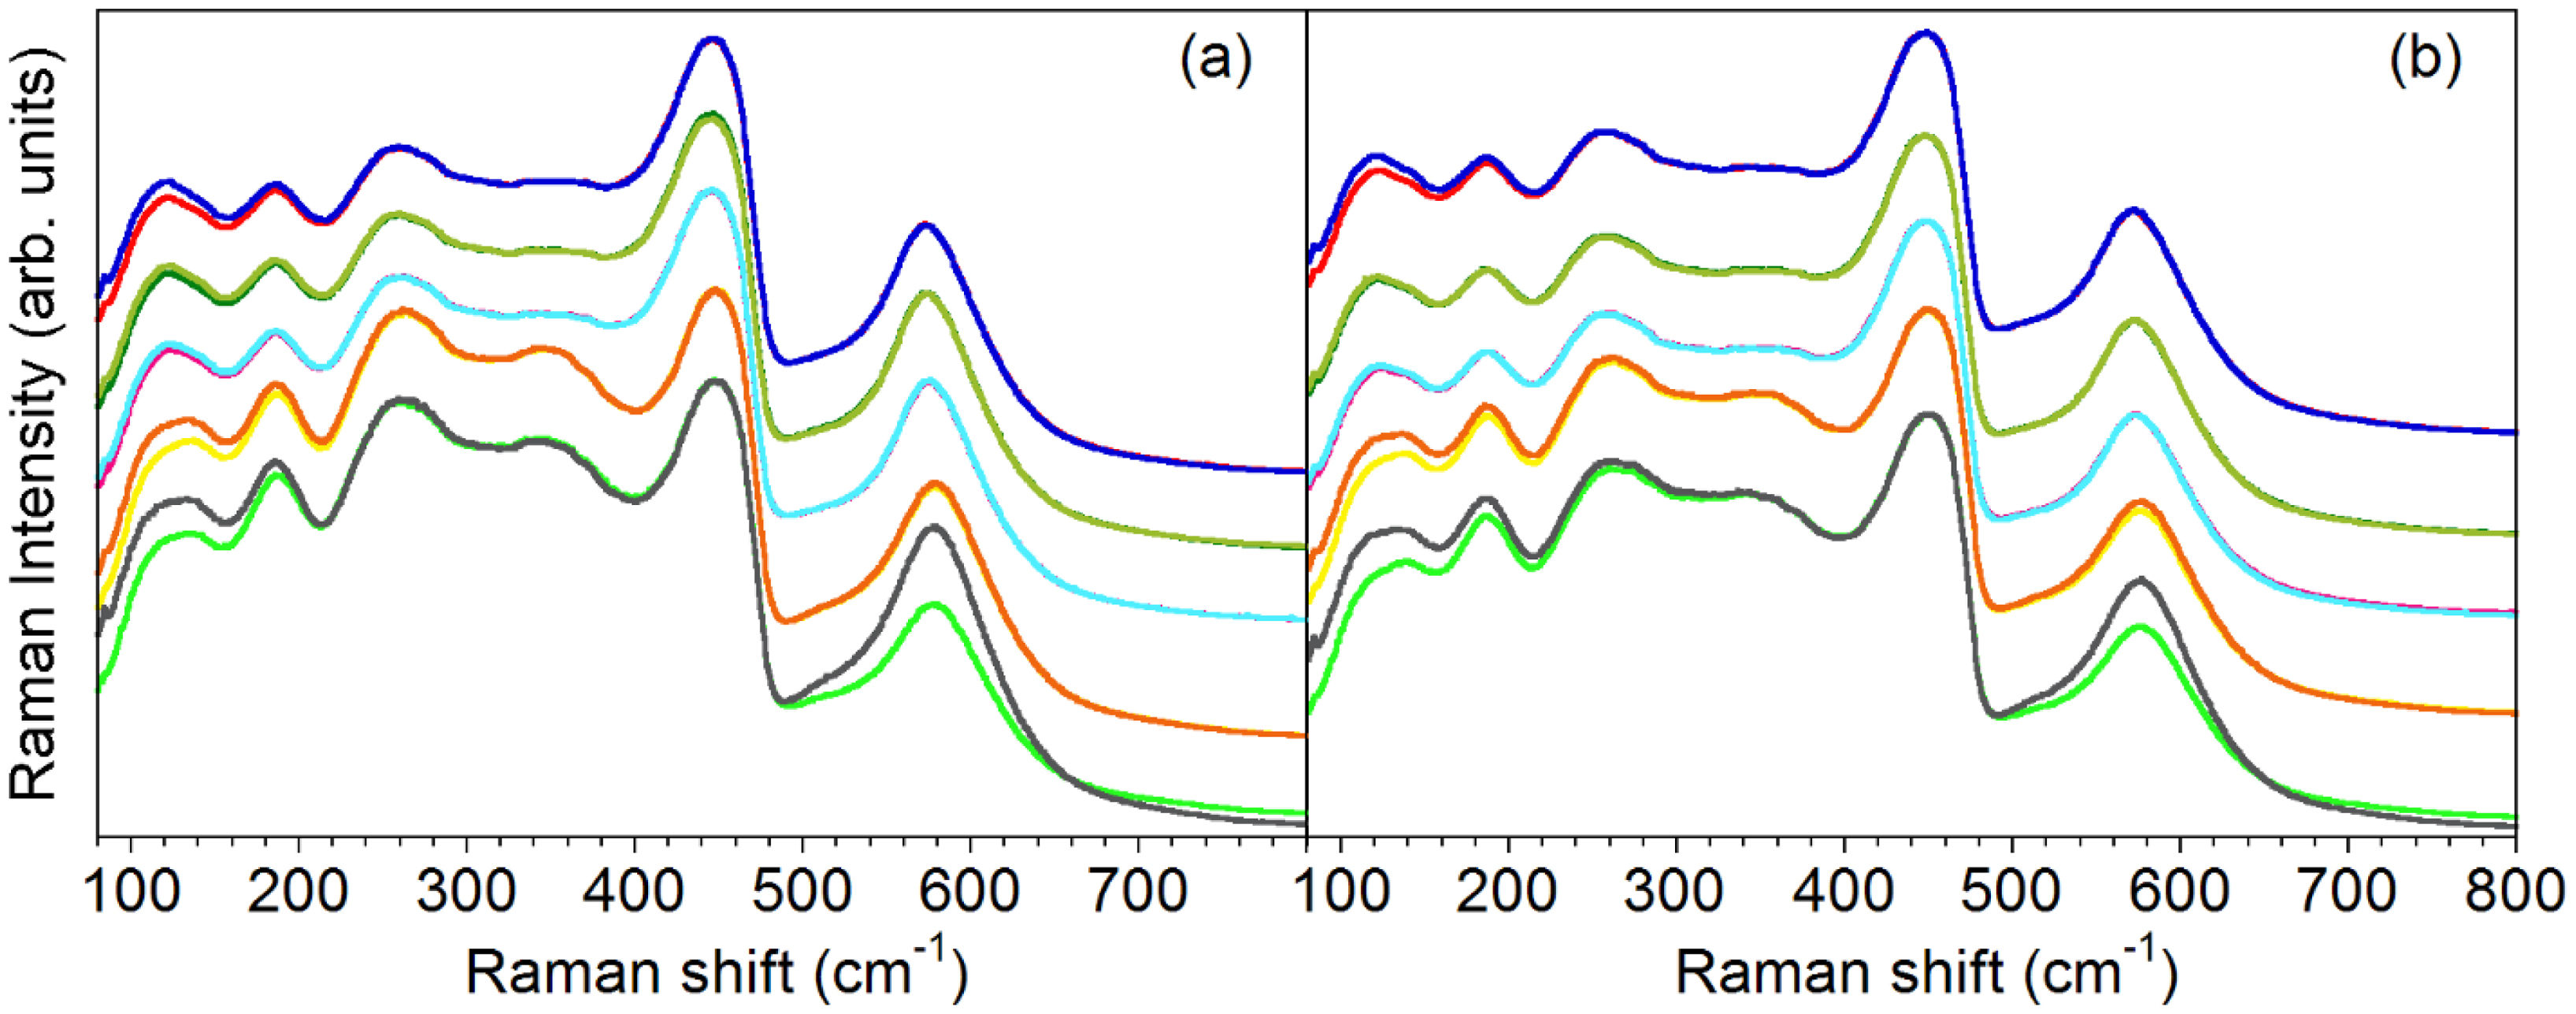
Thermally treated samples. Fig. 6 shows spectra of TLC50 and ULC50 pellets recorded on 2h-annealed samples with annealing temperature (Ta) increasing from 1000 to 1400°C. The spectra have been scaled to a constant F band intensity for comparison purposes. For each Ta, spectra were recorded in parallel (//) and crossed (X) configurations, i.e. with either parallel or perpendicular incident and scattered electric fields. In both series of samples, // and X spectra are almost perfectly superposed for Ta below 1300°C (the higher intensity increase in // configuration at low wavenumbers is due to laser direct light), whereas for Ta=1400°C the intensity of the V band is always higher in parallel than in crossed configuration. However, both series display the same behaviour as regards polarization properties, which suggests that the texture enhancement in TLC50 with increasing Ta is not relevant in the appearance of band polarization. We rather attribute the appearance of polarization properties to thermally activated grain growth (see section “Structural and microstructural analysis”), together with the associated decrease of depolarization effects by light scattering at the grain surfaces.
 textured and (b) untextured LC50 pellets as a function of the annealing temperature Ta, scaled to a constant F band intensity. From top to bottom, Ta=1000, 1100, 1200, 1300, 1400°C. Spectra in // and X polarizations are superposed for each Ta. Note the appearance of V-band polarization for Ta above 1300°C, the intensity of this band being higher when measured in // configuration. For all other Ta, // and X spectra are almost perfectly superposed.")
Raman spectra of (a) textured and (b) untextured LC50 pellets as a function of the annealing temperature Ta, scaled to a constant F band intensity. From top to bottom, Ta=1000, 1100, 1200, 1300, 1400°C. Spectra in // and X polarizations are superposed for each Ta. Note the appearance of V-band polarization for Ta above 1300°C, the intensity of this band being higher when measured in // configuration. For all other Ta, // and X spectra are almost perfectly superposed.
There is another aspect of these spectra that is worth noting, and it is the enhancement of the C band in samples annealed at or above 1300°C, in both textured and untextured ceramics. This band, as explained above, has been attributed to the development of C-like vacancy-ordered regions in rare-earth doped ceria [15,17,31]. The enhancement of the C-related band on increasing Ta agrees with the expected thermally activated growth of the ordered regions.
Spatial homogeneity. To test any microstructural feature that might be texture-related, such as the spatial distribution of oxygen vacancy concentration, spectra of the TLC50_S1400 and ULC50_S1400 pellets were recorded in different points, either on the pellet flat sides or on freshly broken cross-sections. Spectra in // and X configurations were recorded along specific sample orientations, as depicted in Fig. S2 of the supporting information. The results are presented in the supporting information.
Fig. S3 of the supporting information shows selected spectra recorded onto different points of the flat surface of TLC50_S1400 and ULC50_S1400 pellets; Fig. S4 of the supporting information shows the corresponding spectra taken on the pellet cross-sections, in vertical orientation (see schematics in Fig. S2 of the supporting information). Note that in the latter configuration the incoming electric field is parallel to the texture direction, if present, which is expected to highlight any texture effect when comparing textured and untextured materials.
The most remarkable effect observed in spatially resolved measurements regards the polarization properties of the V band: within a cross section, the polarization ratios are slightly higher at the middle of the pellet than at the edge in both textured and untextured samples (Fig. S4 of the supporting information). On the other hand, the polarization ratios on the flat sides do not seem to vary radially, but are systematically higher in the textured sample (Fig. S3 of the supporting information).
The higher polarization ratios at the pellet centre, in both textured and untextured samples, might arise from some spatial inhomogeneity of the grain size across the short dimension. On the other hand, the slightly higher polarization ratios of the textured sample in flat surfaces, compared to the untextured case, is attributed to the slightly larger average grain size displayed by TLC50_S1400, compared to ULC50_S1400 (see Fig. 2).
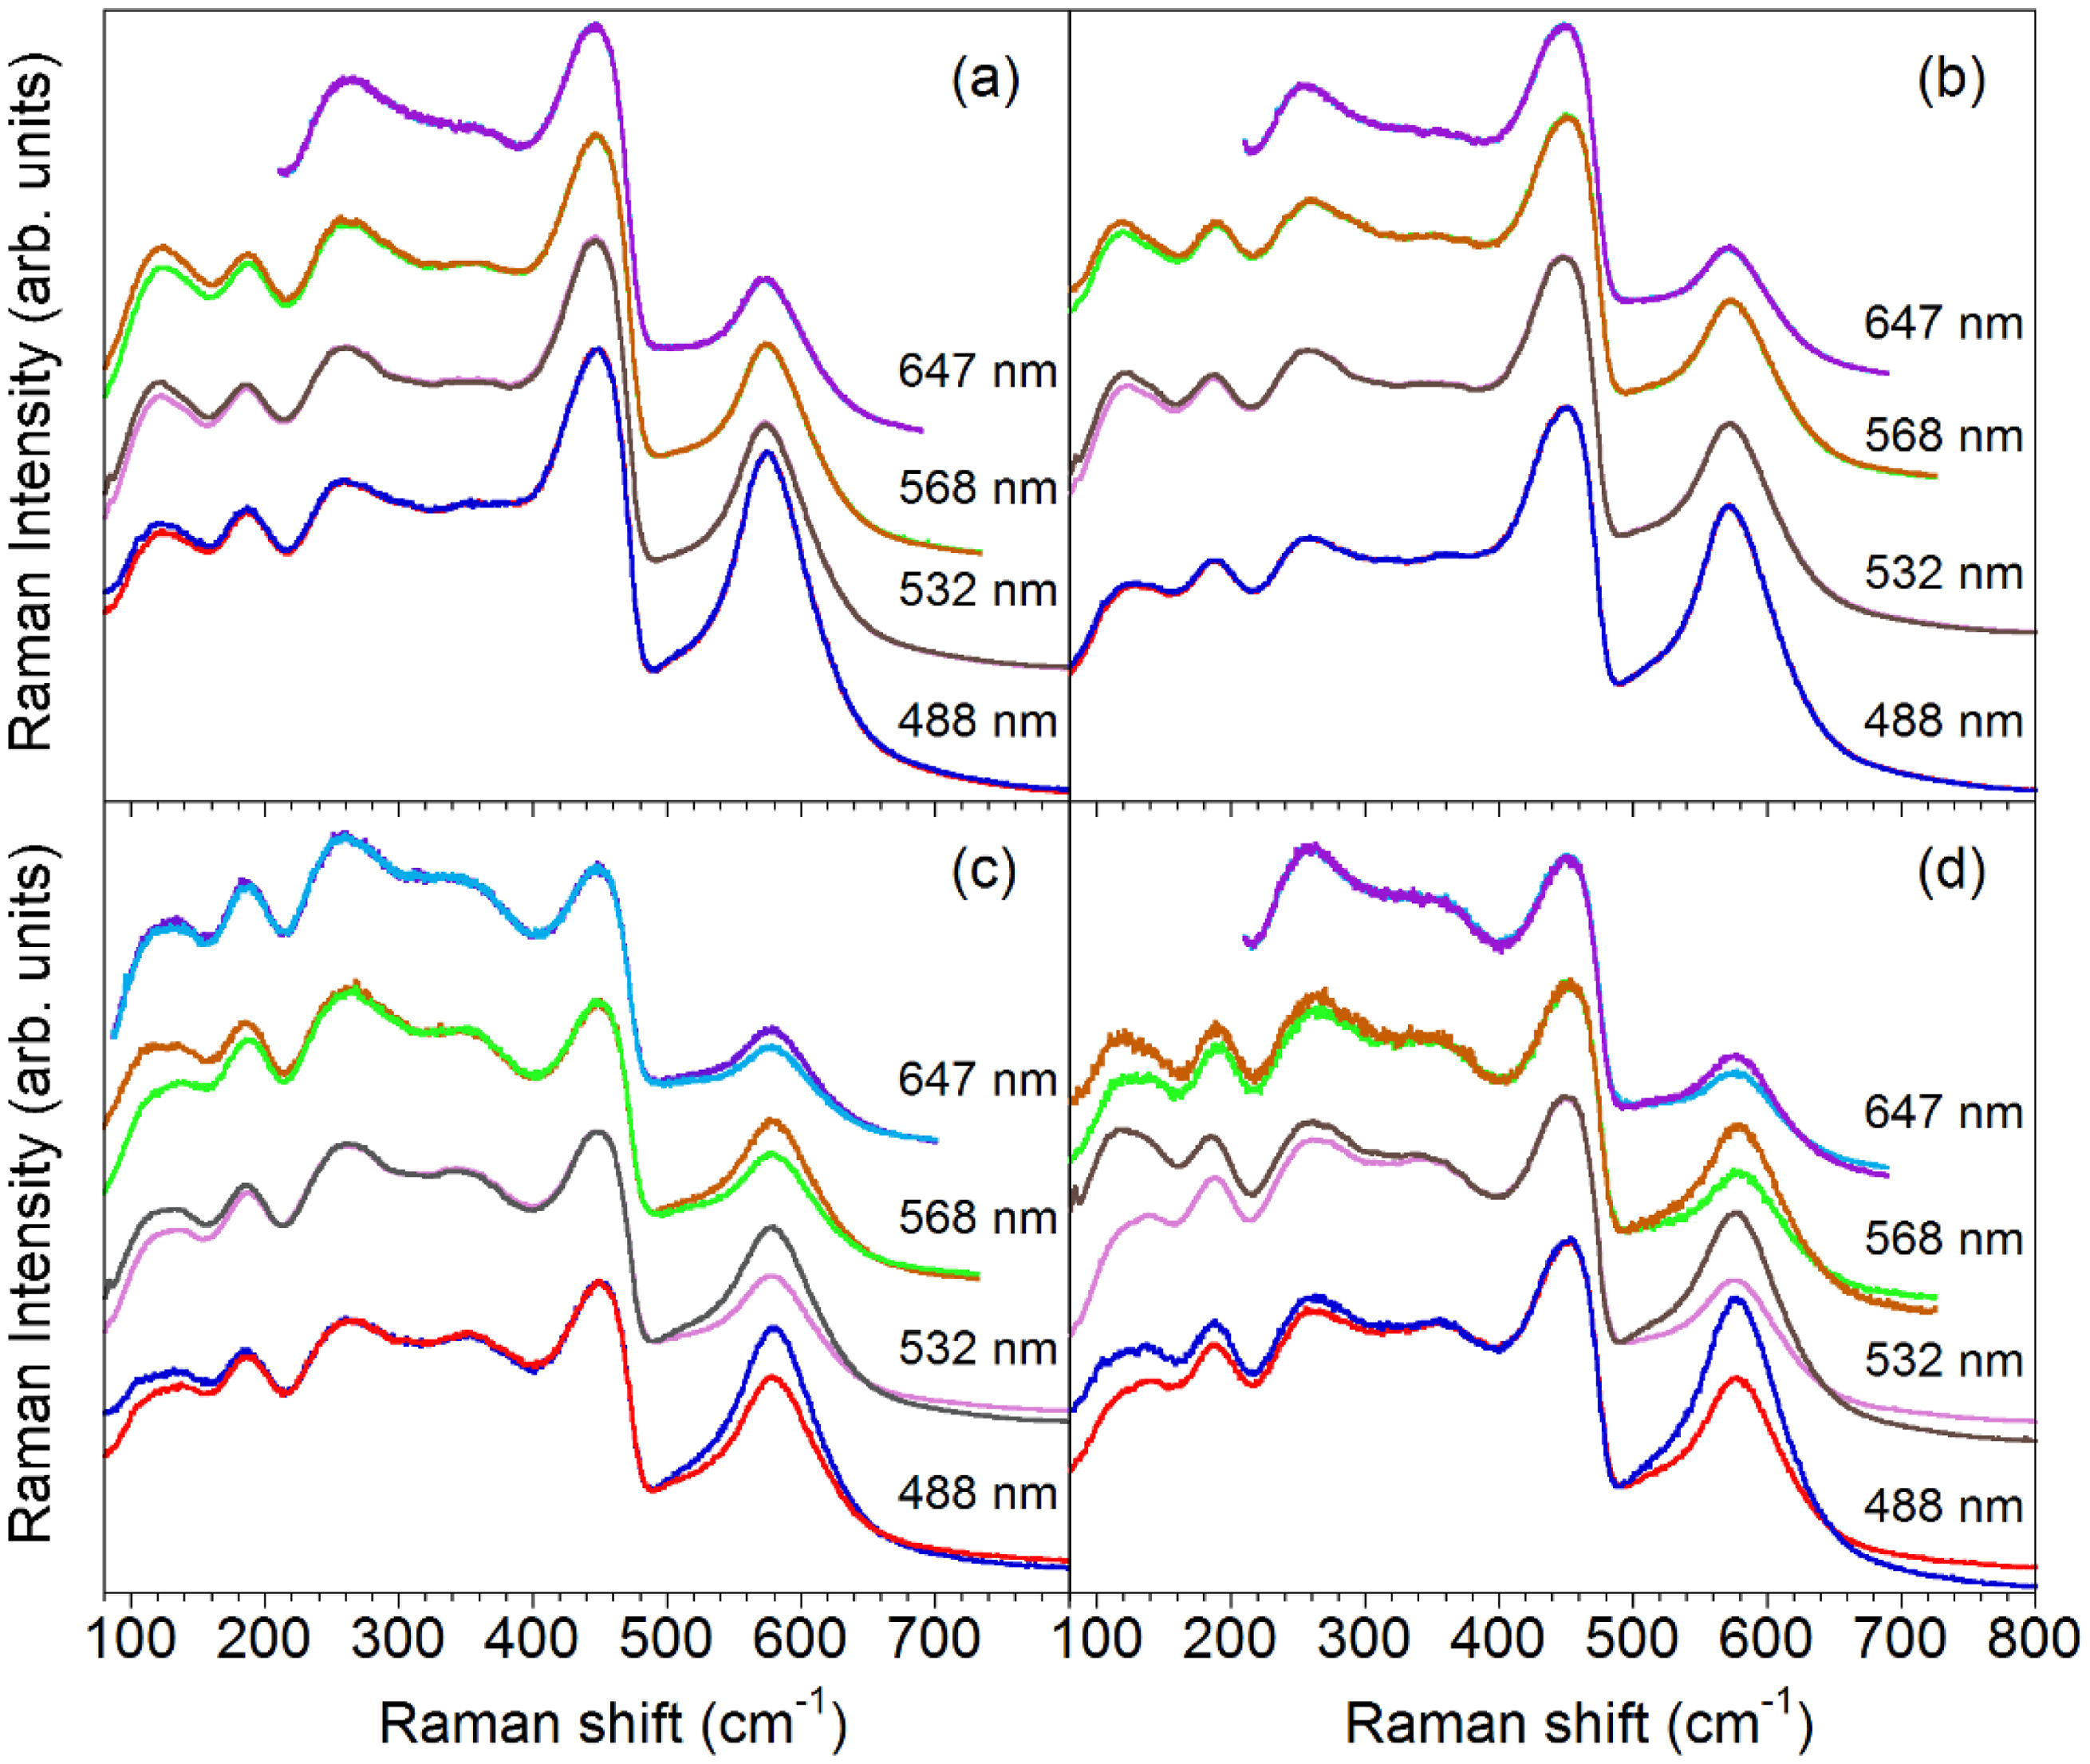
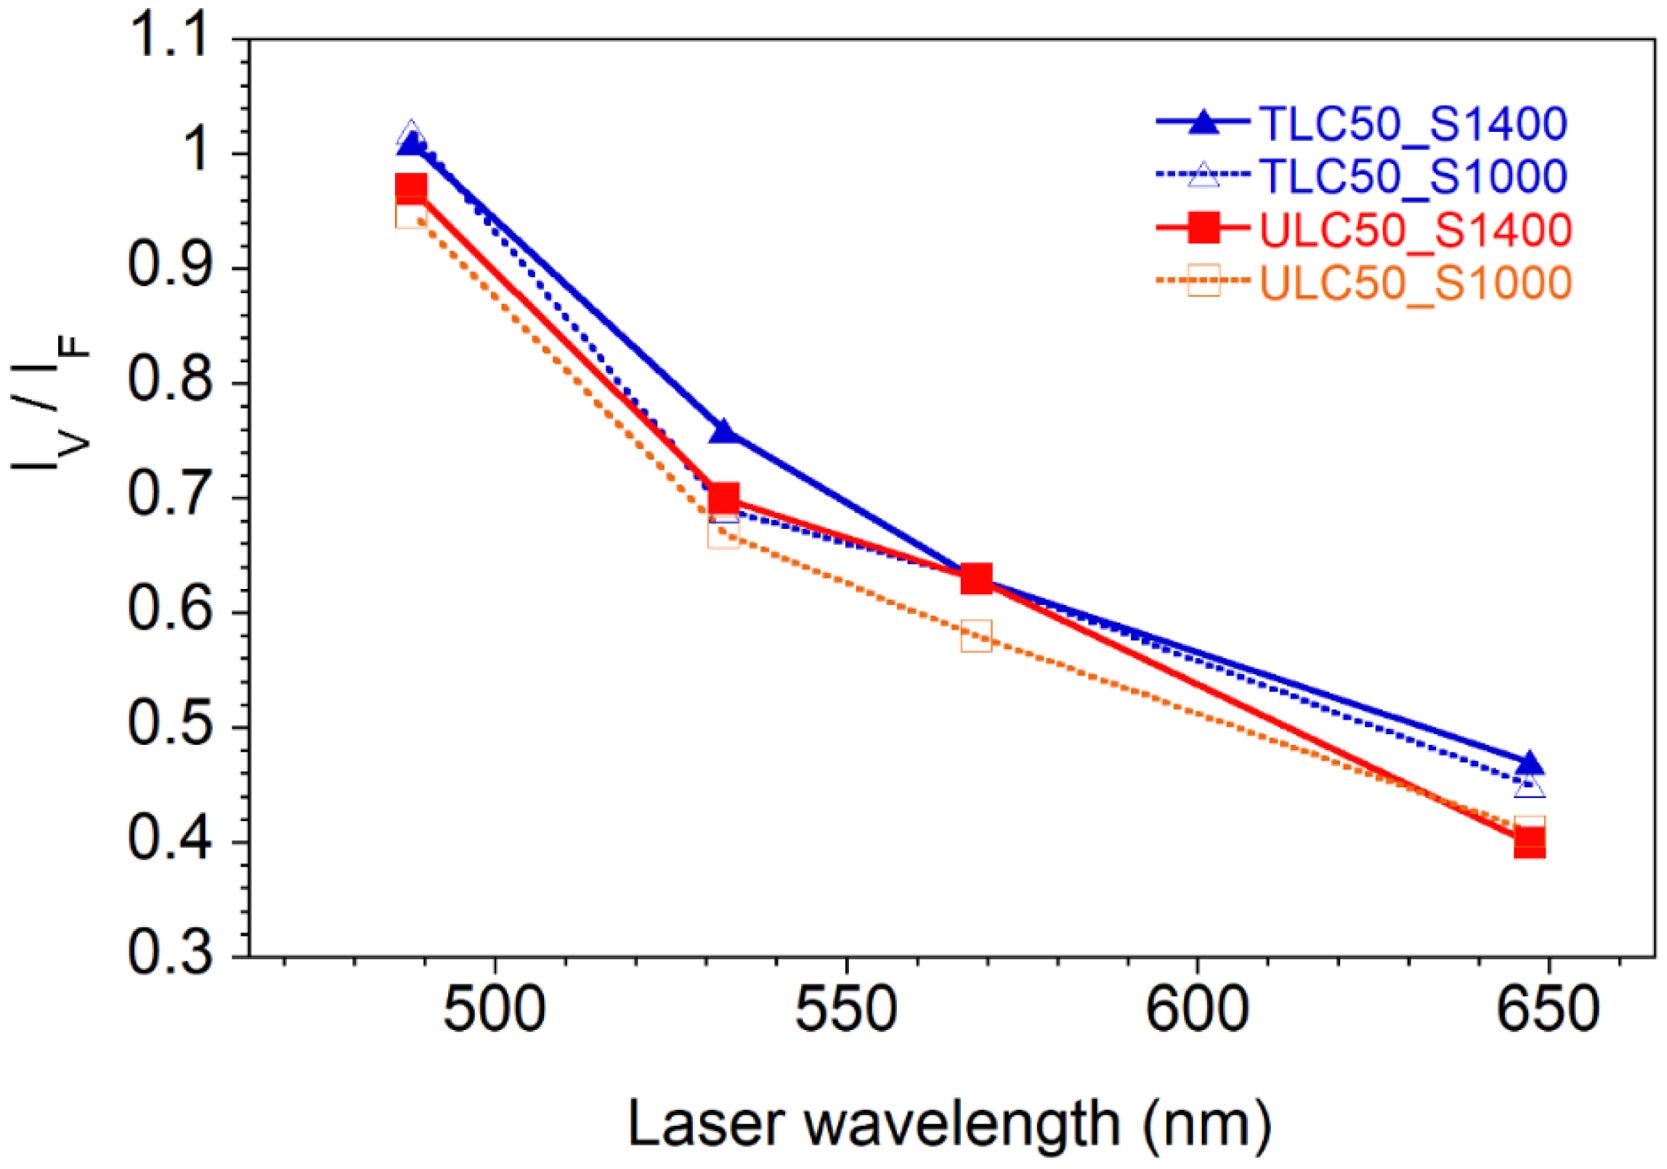
Resonance experiments. Fig. 7 shows the RT spectra of TLC50 and ULC50 samples, annealed at either 1000 or 1400°C, under excitation wavelength (λ)=647, 532, 568 and 488nm. As in previous paragraphs, spectra in // and X configurations are shown. It can be seen that, irrespective of the texture degree and annealing temperature, the V band is enhanced with respect to the rest of the spectrum as the excitation energy increases. Furthermore, Fig. 8 shows that the IV/IF ratios vary in a very similar way in all samples, which implies that the V-band enhancement is not related to texture, neither to a thermally dependent process.
 TLC50_S1000; (b) ULC50_S1000; (c) TLC50_S1400; (d) ULC50_S1400. For comparison purposes, spectra have been scaled to a constant intensity of the F band. In all cases, spectra in // and X configurations are shown, although a difference is only noticeable in (c) and (d), with the V band displaying higher intensity in // configuration.")
Raman spectra of LC50 pellets as a function of the excitation wavelength. (a) TLC50_S1000; (b) ULC50_S1000; (c) TLC50_S1400; (d) ULC50_S1400. For comparison purposes, spectra have been scaled to a constant intensity of the F band. In all cases, spectra in // and X configurations are shown, although a difference is only noticeable in (c) and (d), with the V band displaying higher intensity in // configuration.
 to the fluorite band (F) as a function of the excitation wavelength for TLC50_S1000, ULC50_S1000, TLC50_S1400 and ULC50_S1400 compounds.")
Several papers have previously reported on the increase of the IV/IF ratio in doped ceria when changing the excitation wavelength towards the UV [19,32,33], a behaviour that is usually attributed to the dramatic decrease of the laser penetration depth in CeO2-based materials at wavelengths below 400nm because of strong absorption, together with vacancy and dopant accumulation at the grain surface. Then, despite the smaller global intensity of the spectrum upon exciting near the absorption edge, the higher proportion of defects near the surface and the enhanced sensitivity to the outer layers in the UV would result in the observed increase of the IV/IF relative intensity. However, this model is expected to apply only when the surface to bulk volume proportion is high, as in nanosized materials.
In some cases, the explanation based on surface plus absorption effects has been combined with the existence of a true resonance effect involving vacancies close to the absorbing entities, such as Ce3+[34]. Then, on approaching the absorption edge at the UV, electronic transitions within the Ce3+ electronic levels might enhance the vibration of oxygen ions close to the Ce3+-vacancy defect.
In our case, the first hypothesis is unlikely to explain the observed increase of the IV/IF ratio upon changing the excitation wavelength from 647 to 488nm. Optical absorption measurements of the samples annealed at 1400°C (section “UV–VIS–NIR characterization”) show that the optical density is rather low in the visible region so that laser penetration depths would be high, in the range from 150μm (at 488nm) to ∼1mm (at 647nm). Vacancy or defect accumulation near the surface being restricted to a few tens of nm is not likely to explain the intensity variation. Moreover, if surface effects were relevant, the IV/IF ratio would vary according to differences in grain sizes, for instance as a function of thermal treatments. Such effect is, however, not observed.
We must then search for another explanation, probably involving a true resonance phenomenon between electronic states of vacancy-related defects. A first possibility assumes that the resonance is related to the band observed in the visible (centred around 500nm), as suggested by the linear relationship between IV/IF and the absorption coefficient observed in pellet TLC50_S1400, see Fig. S5 of the supporting information. The precise origin of this absorption band is uncertain. Balestrieri et al. [35] observe a similar band in CeO2 powders and pellets, suggesting it might be associated to a very slight deviation of stoichiometry of CeO2 (residual Ce2O3). As we have not detected the presence of Ce3+ ions, neither by optical absorption in the infrared, nor as electronic Raman bands between low-lying multiplets, the electronic transitions involved in the resonance effect might have a different origin. We then propose that the evolution of IV/IF with the excitation wavelength is a resonance effect involving electronic transitions of vacancy-related defects. The similar vacancy concentration in all samples, irrespective of thermal treatments, explains that they all present similar resonance effects.
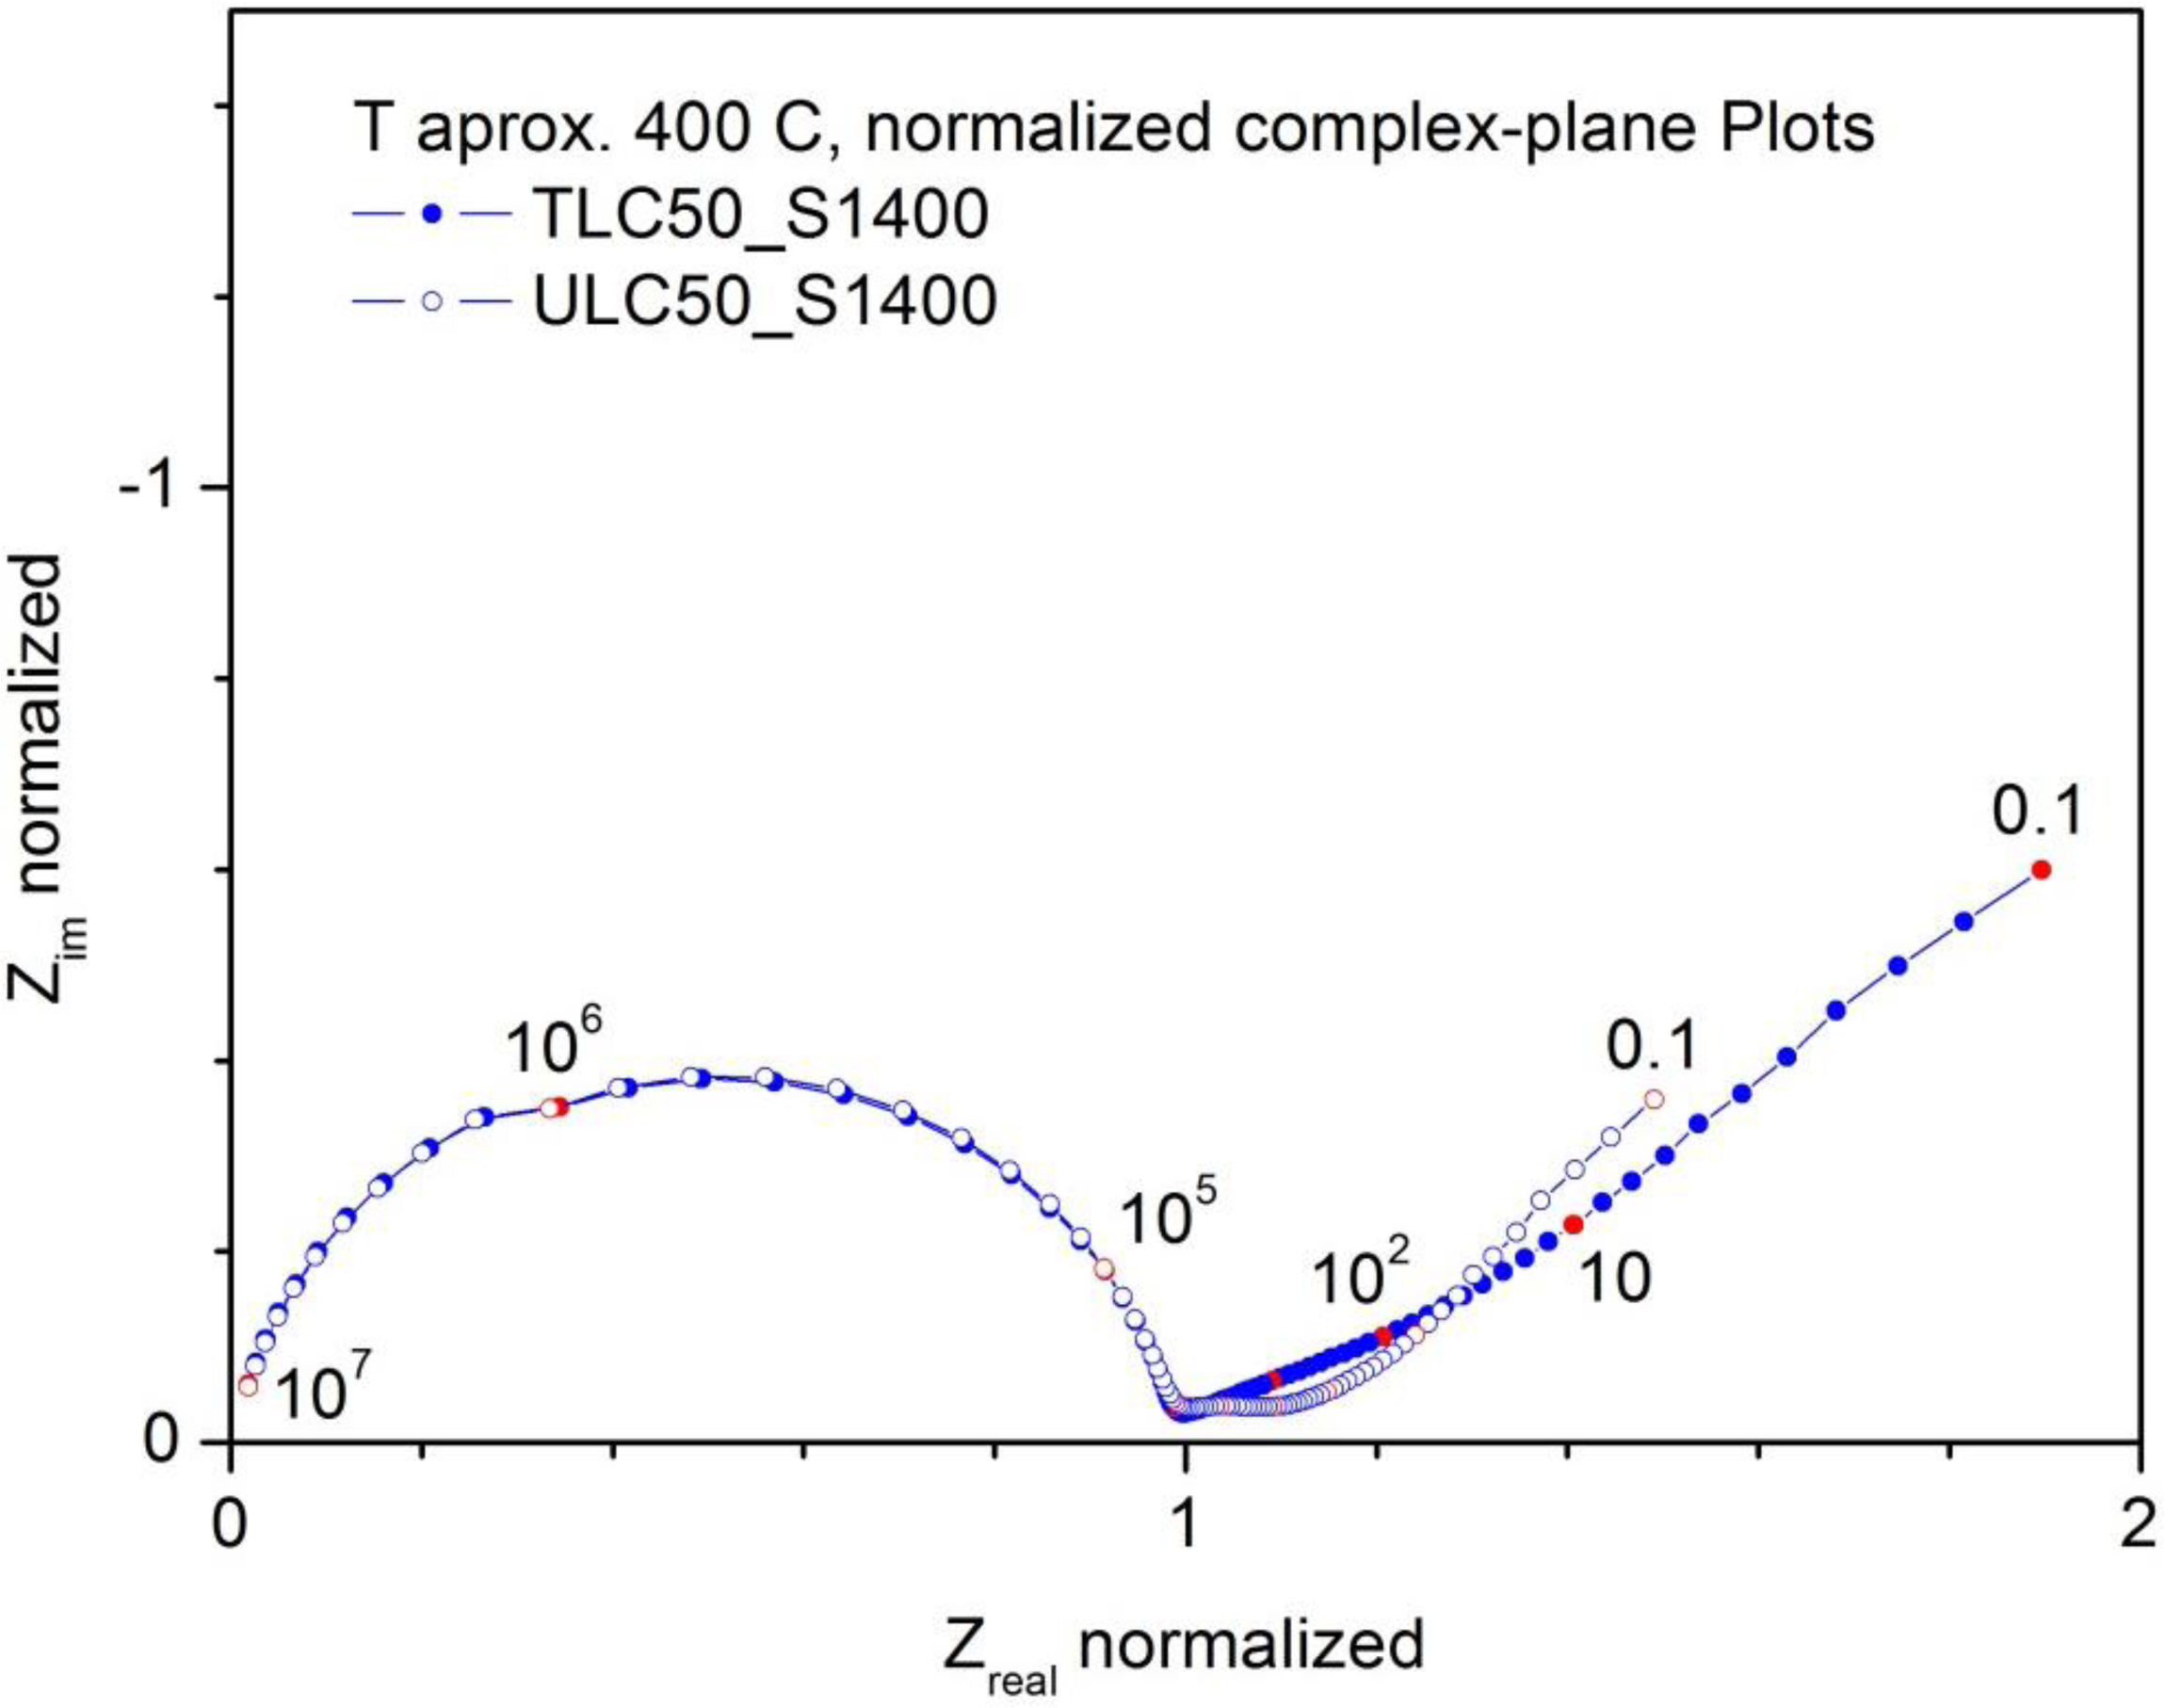
ConductivityThe frequency dependence of the impedance in the ACROSS geometry is a consequence of the sample microstructure and the frequency dependence of the electrical properties of the material. The impedance diagrams (complex-plane plots, Fig. 9) show one depressed arc at high frequency (equivalent capacitance of around 20pF), and another one at smaller frequencies with several contributions. The highest frequency contribution of this lower frequency response shows equivalent capacitances around 0.1–1μF, thus associated to the electrodes. The overall resistance of the electrodes increases when the measurement is made with flowing Ar, a hint that the electrical transport in the samples is dominated by oxide ion conductivity.

Normalized complex-plane plots at around 400°C measured in air for samples TLC50_S1400 and ULC50_S1400. Each spectrum was normalized by dividing the impedance by the respective sample resistance. The points in red are values corresponding to power-of-ten frequency. The frequency values in Hz are indicated on the plot.
The high frequency contribution is dominated by the bulk conductivity. It is not possible to separate a grain boundary contribution, which seems to be overlapped with the electrical response of the grains (bulk). In Fig. 9 we give the normalized complex-plane plots measured for both samples at around 400°C. The impedance is normalized by dividing by the respective resistance of the high frequency arc. The points in red correspond to powers-of-ten frequency values (in Hz). It is clear that the frequency response of both materials, TLC50_S1400 and ULC50_S1400, are the same. From the Zim vs frequency Bode plots one observes a half width at half maximum of 0.75 decades.
The sample resistance was taken as the resistance of this high frequency arc or as the Zreal at the minimum of |Zim|, as each individual spectrum allows. The conductivity was calculated from the resistance and the geometrical factor of the sample.
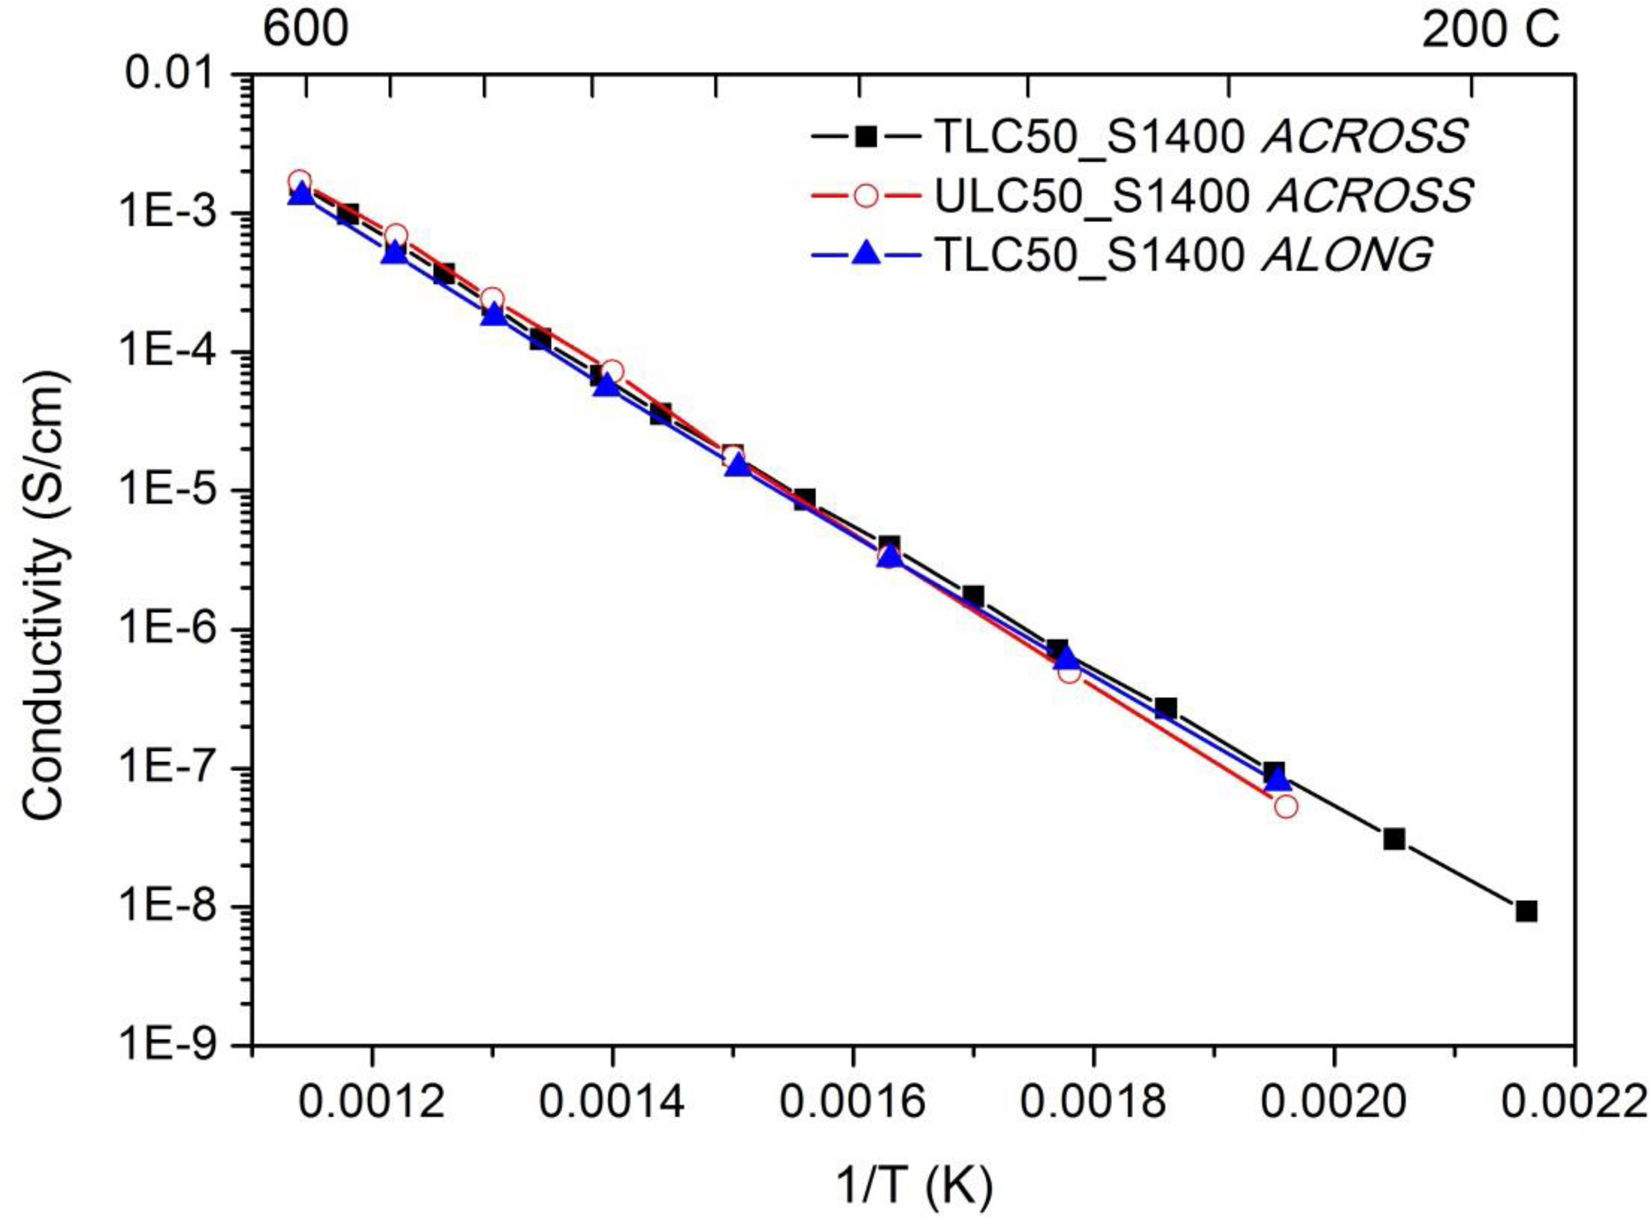
In the ALONG geometry the frequency dependence is strongly influenced by a capacitive contribution of the measurement apparatus and cell, and is not representative of the sample frequency response. Moreover, as in the previous data, it is not possible to separate a grain boundary contribution in the measured spectra. Only the total sample conductivity, dominated by the bulk of the sample, can be obtained.
In Fig. 10 we give the conductivity values. These are very similar among samples and geometries, with slightly higher slope for the ULC50_S1400 sample. The activation energies (Table 1) were obtained by fitting an Arrhenius dependence to the data in the measured temperature range as

T is the absolute temperature (in kelvin), k is the Boltzmann constant, E is the activation energy and A0 is a preexponential factor to be determined from the experiment. Conductivity and activation energies are similar to the bulk conductivity values reported by Zamudio-García et al. [17] for this composition.
DiscussionThe Raman studies presented in this work address two different aspects: the first one is a general discussion of the spectrum evolution with regard to thermal treatments and as a function of the excitation wavelength, focusing on the hypothetical relation of the observed trends with variations of the vacancy concentration and/or ordering. The second objective is to address whether a correlation can be established between the preceding aspects and the observed 〈111〉 texture.
The weak variation of the Raman spectrum along different points of the samples in both textured and untextured pellets denotes a high sample homogeneity. The only hint of vacancy-ordering effects is the detection of a band around 346cm−1 which has been previously attributed to the formation of short-range-ordered domains with vacancies located in just one of the C-phase anion sites [15,17,31]. First-principles modelling [13,14] supports that vacancy alignment in La2Ce2O7 takes place in a manner quite similar to that of the C-phase, with almost equal probability of pairing along 〈110〉 and 〈111〉 directions. Vacancy ordering in La2Ce2O7 occurs very locally, not yielding a long-range order but resulting in a recognizable C-like Raman spectrum. The enhancement of the C-like band with increasing annealing temperatures supports the thermally activated domain growth. In any case, all observations concerning C-like domains in the present work are common to textured and untextured materials and depend only on the annealing temperature, which leads us to conclude that texture and vacancy ordering are independent phenomena.
The wavelength dependence of the intensity ratio of the vacancy related V band to the fluorite-like F band has been attributed to a resonance effect involving a defect-related band of unspecified origin. Previous models based on vacancy accumulation at the grain surface and the low penetration depth at the UV are not applicable in our large-grain samples when exciting in the visible range.
Concerning texture effects, we conclude that no significant correlation exists between texture and Raman-sensitive properties. In particular, no relationship is found between texture and vacancy amount, vacancy ordering or resonance phenomena.
As regards electrical measurements, the absence of grain-boundary associated arc in the complex plane plots in these samples, which have grain sizes in the range of 1–2μm (1.55±0.61μm for TLC50_S1400 and 1.19±0.52μm for ULC50_S1400, see Fig. 2) is in agreement with the results of Zamudio-García et al. [17]. They are able to fit a grain-boundary contributed arc only at La concentrations≤0.5 (Ce0.5La0.5O2−δ) with grain size around 2.5μm for this specific concentration. The grain boundaries in both kind of samples are conductive enough so as not to impair the total sample conductivity, which is determined by the bulk conductivity. This also precludes extracting information about the grain boundary performance in the textured or untextured materials.
From the data, it is also evident that the bulk conductivity shows no relevant dependence on texture. Samples TLC50_S1400 show a clear texture, with 〈111〉 diffraction peaks dominating the XRD diagrams, while samples ULC50_S1400 are untextured (refer to Fig. 1b). This is not surprising as the compound has a cubic symmetry, and its conductivity should be therefore isotropic. Accordingly, the conductivity estimated along the pellet plane agrees with the one measured across it for the textured sample.
The present conclusions – no correlation between texture, vacancy ordering and electrical properties – concur with other observations, such as the irrelevance of texture for thermal conductivity [18].
Summary and conclusionsWe have explored the hypothetical correlation between texture and vacancy-related properties such as vacancy amount, ordering and alignment in La2Ce2O7. For this purpose, samples with varying degree of 〈111〉 texture, depending on the sintering temperature, are compared with commercial, untextured compounds subjected to the same thermal treatments. Raman scattering was used to highlight vacancy-related properties. X-ray diffraction, electron microscopy and optical absorption are used as complementary techniques to provide information on the degree of texture, grain size and laser penetration depth, respectively. Impedance spectroscopy has also been used to investigate the electrical properties.
Concerning the Raman results, no significant difference was found between textured and untextured materials upon changing the sintering temperature or the excitation wavelength. A selective enhancement of the vacancy-related band upon decreasing the excitation wavelength from 647 to 488nm in both textured and untextured materials is attributed to a resonance phenomenon involving vacancy-related electronic transitions. The only hint of vacancy ordering was the observation of a band at ∼346cm−1, characteristic of C-R2O3-like short-range ordered regions embedded within the long-range fluorite matrix; its enhancement with annealing temperature is attributed to the thermally activated growth of the C-like regions. The conductivity of the fully dense materials (sintered at 1400°C for 2h) is dominated by the bulk conductivity of oxide ions and is very similar among samples (textured or untextured) and geometries (along or across the 〈111〉 texture direction). Activation energies (1.08–1.16eV) and conductivity values (around 10−5S/cm at 650K) are similar to those reported previously.
In conclusion, there is no relationship between texture and vacancy amount or vacancy ordering. A similar conclusion – no influence of texture – is reached concerning the electrical properties.
Conflict of interestsThe authors declare that they have no known competing financial interests or personal relationships that could have appeared to influence the work reported in this paper.
MLS and RIM acknowledge funds for the research through grant PID2021-124863OB-I00 funded by MCIN/AEI/10.13039/501100011033 and through the financial support to the Research Group T02_23R by the Departamento de Ciencia, Universidad y Sociedad del Conocimiento del Gobierno de Aragón. AKL is indebted to the financial support provided by IIT Patna.
The followings are the supplementary data to this article:

