


Bacterial spot is an important disease of pepper in Bulgaria and Macedonia. For characterization of Xanthomonas species associated with bacterial spot, 161 strains were collected from various field pepper-growing regions. Among them, 131 strains were identified as Xanthomonas euvesicatoria and 30 as Xanthomonas vesicatoria using species-specific primers and polymerase chain reaction followed by restriction fragment length polymorphism analysis. To assess the genetic diversity of the strains, two methods (Random Amplified Polymorphic DNA and Repetitive Element Palindromic-Polymerase Chain Reaction) were applied. Discriminatory index was calculated and analysis of molecular variance was carried out.
Combined random amplified polymorphic DNA analysis of the X. euvesicatoria strains with primers CUGEA-4 and CUGEA-6 had greater discriminative power (0.60) than repetitive element palindromic-polymerase chain reaction with ERIC and BOX A1R primers, which makes this method applicable for strain diversity evaluation. Discrimination among the X. vesicatoria strains was achieved by the use of ERIC primers and only for the Bulgarian strains. The results demonstrated that X. euvesicatoria was more diverse than X. vesicatoria and heterogeneity was observed mainly in the Bulgarian populations. According to the analysis of molecular variance, genetic variations in X. euvesicatoria were observed among and within populations from different regions, while the differences between the two countries were minor. Following the principal coordinates analysis, a relation between the climatic conditions of the regions and a genetic distance of the populations may be suggested.
Bacterial spot is one of the most serious diseases of pepper (Capsicum annum L.) and tomato (Solanum lycopersicum L.) plants worldwide. In areas with warm and humid weather conditions, the disease can be destructive to pepper and tomato seedlings and can result in total crop loss. Plant debris and contaminated seeds are the most common source of primary infection.1 To date, three genetically and phenotypically distinct pathogens have been defined as causative agents of bacterial spot: Xanthomonas euvesicatoria (including the former Xanthomonas perforans species), Xanthomonas vesicatoria, and Xanthomonas gardneri.2,3X. euvesicatoria and X. gardneri have been isolated from both symptomatic tomato and pepper, X. vesicatoria primarily from tomato and X. perforans, until recently, only from tomato.4,5 The X. euvesicatoria strains were reported as more aggressive on pepper plants and in several countries as the prevalent pathogen.4–8
In Bulgaria and Macedonia, bacterial spot is a common disease on pepper plants and was first described in 1963 in Bulgaria and in 1999 in Macedonia.9,10 Control of the disease mostly relies on sanitation, cultural practices, including the use of pathogen-free seeds and chemical control by using copper and streptomycin sprays. Characterization of the population structure, diversity, and evolution are the main factors for understanding the pathogen biology and providing information necessary for the development of effective means for disease control. Families of repetitive DNA sequences found in all prokaryotes, such as repetitive extragenic palindromic sequences (rep), BOX elements, and enterobacterial repetitive intergenic consensus (ERIC), as well as random amplified polymorphic DNA (RAPD) analysis have been used for determination of variability within the species of several genera.11–15 The amplification reaction using random oligomeric primers (RAPD-PCR) has been employed for analysis of genetic variations in different Xanthomonas species.16–19
Even though bacterial spot pathogens have been classified as A2 quarantine organisms by the EPPO (European and Mediterranean Plant Protection Organization) and the disease has been reported in many countries, there is not much data available on the structure and diversity of the pathogen populations.
This study aimed to investigate the heterogeneity in the populations of the species causing bacterial spot on pepper in Bulgaria and Macedonia, and the application of different methods for evaluation of diversity.
Materials and methodsStrainsThe bacteria evaluated in this work (161 pathogenic strains) were collected from field grown pepper originating from Bulgaria and Macedonia in the period 1999–2013 (Table 1). The strains were isolated from leaves, petioles, fruits, and flowers with symptoms of bacterial spot (single small necrotic spots or large water-soaked necrotic spots on leaves, ring necrosis on petioles, necrotic scabs on fruits, and brown necrotic flowers with bacterial exudates). The type cultures X. vesicatoria NBIMCC 2427 (DSM-22252), X. euvesicatoria NBIMCC 8731 (DSM-19128), X. perforans NBIMCC 8729 (DSM-18975) and X. gardneri NBIMCC 8730 (DSM-19127) were used as references.
Strain designation, year of isolation, location and host variety for Xanthomonas isolates from Bulgaria and Macedonia.
| Strain designation | Year of isolation | Location | Host variety |
|---|---|---|---|
| 1b,2b | 1999 | Lovech, Bulgaria (NB) | Kapiya |
| 3b | 1999 | Lovech, Bulgaria (NB) | Hot pepper |
| 4b,5b | 2000 | Institute of Genetics, Sofia, Bulgariaa (WB) | Sortiment |
| 6b,7b | 2001 | Institute of Genetics, Sofia, Bulgariaa (WB) | Genetic material |
| 8b | 2002 | Lovech, Bulgaria (NB) | Kapiya |
| 9b | 2002 | Trebich, Bulgaria (WB) | cv. Chorbadzhiyska |
| 10b | 2002 | Pazardzhik, Bulgaria (SB) | Kapiya |
| 11b | 2003 | IPP, Kostinbrod, Bulgariab | cv. California wonder |
| 12b | 2003 | Petrich, Bulgaria (WB) | Kapiya |
| 13b | 2004 | IPP, Kostinbrod, Bulgariab (WB) | cv. California wonder |
| 14b,15b | 2005 | Institute of Genetics, Sofia, Bulgaria (WB) | Ornamental |
| 16b | 2006 | Kavarna, Bulgaria (NEB) | Kapiya |
| 17b | 2006 | IPP, Kostinbrod, Bulgariab (WB) | Kapiya |
| 18b,19b | 2006 | IPP, Kostinbrod, Bulgariab (WB) | cv. Golden medal |
| 22b | 2006 | IG, Sofia, Bulgariaa (WB) | L No. 82 |
| 23b,24b | 2006 | IG, Sofia, Bulgariaa (WB) | cv. OK |
| 25b | 2006 | IG, Sofia, Bulgariaa (WB) | L 80×67 |
| 26b | 2006 | IG, Sofia, Bulgariaa (WB) | cv. Rama |
| 27b | 2006 | IG, Sofia, Bulgariaa (WB) | L B2/13 |
| 28b,29b | 2006 | IG, Sofia, Bulgariaa (WB) | Selection material |
| 30b | 2006 | IG, Sofia, Bulgariaa (WB) | L 206 |
| 31b | 2006 | IG, Sofia, Bulgariaa (WB) | Hot pepper |
| 32b,33b | 2007 | Haskovo, Bulgaria (SB) | Kapiya-red |
| 34b,35b | 2007 | Stara Zagora, Bulgaria (SB) | Kapiya-red |
| 36b,37b | 2008 | IPP, Kostinbrod, Bulgariab (WB) | cv. Golden medal |
| 38b | 2008 | IG, Sofia, Bulgariaa (WB) | Orange kapiya |
| 39b,40b | 2009 | Kostinbrod, Bulgaria (WB) | Kapiya |
| 41b,42b | 2009 | Veliko Tarnovo, Bulgaria (NB) | Kapiya |
| 43b | 2009 | Veliko Tarnovo, Bulgaria (NB) | Hot pepper |
| 44b | 2010 | MVCRI, Plovdiv, Bulgariac (SB) | Kapiya |
| 45b | 2010 | MVCRI, Plovdiv, Bulgariac (SB) | Kurtovska kapiya |
| 47b | 2010 | MVCRI, Plovdiv, Bulgariac (SB) | Kapiya |
| 48b | 2010 | MVCRI, Plovdiv, Bulgariac (SB) | Hot pepper |
| 49b,50b | 2010 | MVCRI, Plovdiv, Bulgariac (SB) | Shipka |
| 51b,52b | 2010 | MVCRI, Plovdiv, Bulgariac (SB) | Hot pepper |
| 53b | 2011 | Novi Iskar, Bulgaria (WB) | Kapiya |
| 54b | 2011 | IPP, Bulgariab (WB) | Siwriya |
| 55b,56b | 2011 | Kostinbrod, Bulgaria (WB) | Kapiya |
| 57b,58b | 2011 | MVCRI, Plovdiv, Bulgariac (SB) | White kapiya |
| 59b | 2011 | MVCRI, Plovdiv, Bulgariac (SB) | White kapiya |
| 60b,61b,62b,63b,64b,65b | 2011 | IG, Sofia, Bulgariaa (WB) | White kapiya |
| 66b,67b,68b,69b | 2012 | Pavlikeni, Bulgaria (NB) | Kambi |
| 70b,71b,72b | 2012 | Pavlikeni, Bulgaria (NB) | Kapiya-red |
| 73b,74b,75b,76b | 2012 | Pavlikeni, Bulgaria (NB) | cv. Shipka |
| 77b,78b,79b | 2012 | Durankulak, Bulgaria (NEB) | cv. Chorbadzhiyska |
| 80b,81b,82b | 2012 | Shabla, Bulgaria (NEB) | Kapiya |
| 83b,84b,85b | 2012 | Tyulenowo, Bulgaria (NEB) | Kambi |
| 86b,87b,88b | 2012 | Kavarna, Bulgaria (NEB) | Kapiya-red |
| 89b,90b,91b,92b | 2013 | Kostinbrod, Bulgaria (WB) | Kapiya |
| 93b,94b.95b | 2013 | Sadowo, Bulgaria (SB) | Kapiya |
| 96b,97b | 2013 | Byala Cherkva, Bulgaria (NB) | Siwriya |
| 98b,99b,100b | 2013 | Byala Cherkva, Bulgaria (NB) | Kapiya-red |
| 101b,102b,103b | 2013 | Byala Cherkva, Bulgaria (NB) | Kambi |
| 105b | 2013 | Byala Cherkva, Bulgaria (NB) | cv. Chorbadzhiyska |
| 106b | 2013 | Shabla, Bulgaria (NEB) | cv. Chorbadzhiyska |
| 107b | 2013 | Kavarna, Bulgaria (NEB) | Kambi |
| 108b,109b,110b,111b,112b, 113b,114b,115b | 2013 | Kavarna, Bulgaria (NEB) | Kapiya-red |
| 1M,2M,5M,7M,11M | 2005 | Strumitza, Macedonia (M) | cv. Kurtovska kapiya |
| 15M,21M,25M | 2005 | Kochani, Macedonia (M) | cv. Kurtovska kapiya |
| 28M,31M,35M,37M,38M | 2005 | Belasitza, Macedonia (M) | cv. Kurtovska kapiya |
| 44M,50M,53M | 2005 | Strumitza, Macedonia (M) | cv. Kurtovska kapiya |
| 54M,55M,56M,57M,58M,59M, 60M,61M,62M,63M,64M,65M, 66M,67M,68M,69M,70M | 2012 | Lazhani, Macedonia (M) | Sivriya |
| 71M,72M,73M,74M,75M | 2013 | Radovish, Macedonia (M) | cv. Kurtovska kapiya |
| 76M,77M,78M | 2013 | Belasitza, Macedonia (M) | cv. Golden medal |
| 79M,80M,81M | 2013 | Kochani, Macedonia (M) | Hot pepper |
| 82M,83M,84M | 2013 | Strumitza, Macedonia (M) | Kapiya |
| 85M,86M,87M | 2013 | Lazhani, Macedonia (M) | cv. Babura |
DNA was extracted from bacterial suspensions with OD600=1 with DNeasy Blood & Tissue Purification Kit (Qiagen). Control of yield and purity of the obtained DNA was performed by measuring absorbance at 230nm, 260nm, 280nm, and 320nm with a spectrophotometer Nanodrop 2000 (Thermo Scientific).
PCR with species-specific primersFive species-specific primers were used for identification of the strains: Xeu 2.4/Xeu 2.5 and Bs-XeF/Bs-XeR for X. euvesicatoria, XvF/Bs-XvR for X. vesicatoria, Bs-XgF/Bs-XgR for X. gardneri and Bs-XpF/Bs-XpR for X. perforans (Table 2).
Sequences of oligonucleotide primers used in PCR amplifications.
| Primer | Oligonucleotide sequence (5′→3′) | Reference |
|---|---|---|
| Bs-XeF | CAT GAA GAA CTC GGC GTA TCG | 20 |
| Bs-XeR | GTC GGA CAT AGT GGA CAC ATA C | 20 |
| Xeu 2.4 | CTG GGA AAC TCA TTC GCA GT | 21 |
| Xeu 2.5 | TTG TGG CGC TCT TAT TTC CT | 21 |
| Bs-XvF | CCA TGT GCC GTT GAA ATA CTT G | 20 |
| Bs-XvR | ACA AGA GAT GTT GCT ATG ATT TGC | 20 |
| Bs-XgF | TCA GTG CTT AGT TCC TCA TTG TC | 20 |
| Bs-XgR | TGA CCG ATA AAG ACT GCG AAA | 20 |
| Bs-XpF | GTC GTG TTG ATG GAG CGT TC | 20 |
| Bs-XpR | GTG CGA GTC AAT TAT CAG AAT GTG G | 20 |
| 16S-p2 | CTT GTA CAC ACC GCC CGT C | 22 |
| 23S-p7 | GGT ACT TAG ATG TTT CAG TTC | 22 |
| CUGEA-3 | GCG GTA CCC G | 24 |
| CUGEA-4 | GCG AAT TCC G | 24 |
| CUGEA-5 | CGA TCG ATGC | 24 |
| CUGEA-6 | GGA AGC TTC G | 24 |
| BOX A1R | CTA CGG CAA GGC GAC GCT GAC G | 25 |
| ERIC1R | ATG TAA GCT CCT GGG GAT TCA C | 26 |
| ERIC2 | AAG TAA GTG ACT GGG GTG AGC G | 26 |
PCRs with all primer sets were performed in a total volume of 25μL, containing (final concentrations): 0.5× Red Taq DNA polymerase MasterMix (VWR Int.), 4pmol of each primer, and 100ng of template DNA. The amplification with primers Bs-XeF/Bs-XeR, Bs-XvF/Bs-XvR, Bs-XgF/Bs-XgR, and Bs-XpF/Bs-XpR was carried out as described by Koenraadt et al.20 and with primers Xeu 2.4/Xeu 2.5 as described by Moretti et al.21
PCR-RFLPRestriction of the 16S-23S ITS region, amplified with primers 16S-p2/23S-p7 (Table 2), with HpaII was performed as a second method for identification.23 Amplification was carried out in a total volume of 50μL containing (final concentrations) 1× PCR buffer (STS); 1.5mM MgCl2; 0.15mM dNTPs; 0.4U Taq DNA polymerase (STS); 10pmol of each primer; 100ng of template DNA, under the following reaction conditions: a denaturation step at 95°C for 5min, followed by 30 cycles at 94°C for 45s, 58°C for 45s, and 72°C for 45s, and a final step at 72°C for 7min.
RAPD-PCRThe amplification program was designed according to Momol et al.,24 using four random primers: CUGEA-3, CUGEA-4, CUGEA-5, and CUGEA-6 (Table 2). Amplification was carried out in a final volume of 25μL, containing (final concentrations) 1× buffer, 2.5mM MgCl2, 50pmol of each primer, 0.1mM dNTPs, 0.5U Taq polymerase, and 100ng of DNA.
REP-PCRThree primers were used: BOX A1R, ERIC1R, and ERIC2 (Table 2). PCR mix contained (final concentrations) 1× buffer, 2.5mM MgCl2, 50pmol of each primer, 0.1mM dNTPs, 0.5U Taq polymerase, and 100ng of DNA in a total volume of 25μL. PCR amplification consisted of an initial denaturing step (94°C for 7min); followed by 35 cycles of denaturation (94°C for 1min), annealing (56.5°C for 1min for BOX-PCR and 54°C for 1min for ERIC-PCR) and extension (72°C for 5min); followed by a final extension cycle (65°C for 15min). The PCR program was performed in a thermocycler Biocycler® (Applied Biosystems).
RAPD-PCRs and REP-PCRs were carried out in duplicates and only the main products were taken into consideration.
ElectrophoresisThe PCR and restriction products were separated electrophoretically in 1.5% agarose gel in Tris-borate-EDTA (TBE) buffer for 30min at 100V, stained with ethidium bromide (EtBr) and visualized under UV light. GeneRuler 100bp Plus DNA Ladder (Thermo Scientific) was used. The gels were analyzed by GenoSoft Capture and GenoSoft Imaging software (VWR Int.).
Discriminatory indexThe Discriminatory power of the methods was calculated using the Hunter and Gaston27 discriminatory index (D):
where D is the index of discriminatory power, N is the number of unrelated strains tested, S is the number of different types, and xj is the number of strains belonging to the jth type.Data analysis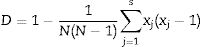
Genetic diversity among the strains of Xanthomonas species was estimated by an analysis of molecular variance (AMOVA). The strains were grouped according their geographic location into two countries (Bulgaria and Macedonia) and five regions (populations): Northern Bulgaria (22 strains), Southern Bulgaria (12 strains), North-Eastern Bulgaria (23 strains), Western Bulgaria (27 strains), and Macedonia (47 strains). Binary matrices of presence/absence of bands at specific positions were prepared from the molecular data. The results were reported by standard AMOVA table including degree of freedom (d.f.), sums of squares, variance components, percentage of variation, φ statistics and p value. The significance was examined with 999 random permutations. The genetic differences between the strains from the investigated regions were assessed by means of Nei's unbiased genetic distance.28 Principal coordinates analysis (PCoA) was performed for visualizing the patterns of relationship via the genetic distance matrix. GenAIEx 6.5 software29 was used for data analysis.
ResultsIdentificationTwo bacterial spot pathogens were identified among the analyzed strains: X. vesicatoria and X. euvesicatoria. The majority of the strains belonged to the species X. euvesicatoria (84 from Bulgaria and 47 from Macedonia), which was confirmed by both PCR amplification with species-specific primer pairs and the PCR-RFLP analysis. Only three Macedonian strains isolated in 2005 and 27 Bulgarian strains were identified as X. vesicatoria. The distribution of the two species during the study is presented in Fig. 1.
RAPD-PCR and Macedonia (B) through the years (as % from the total number of strains from each species and country).")
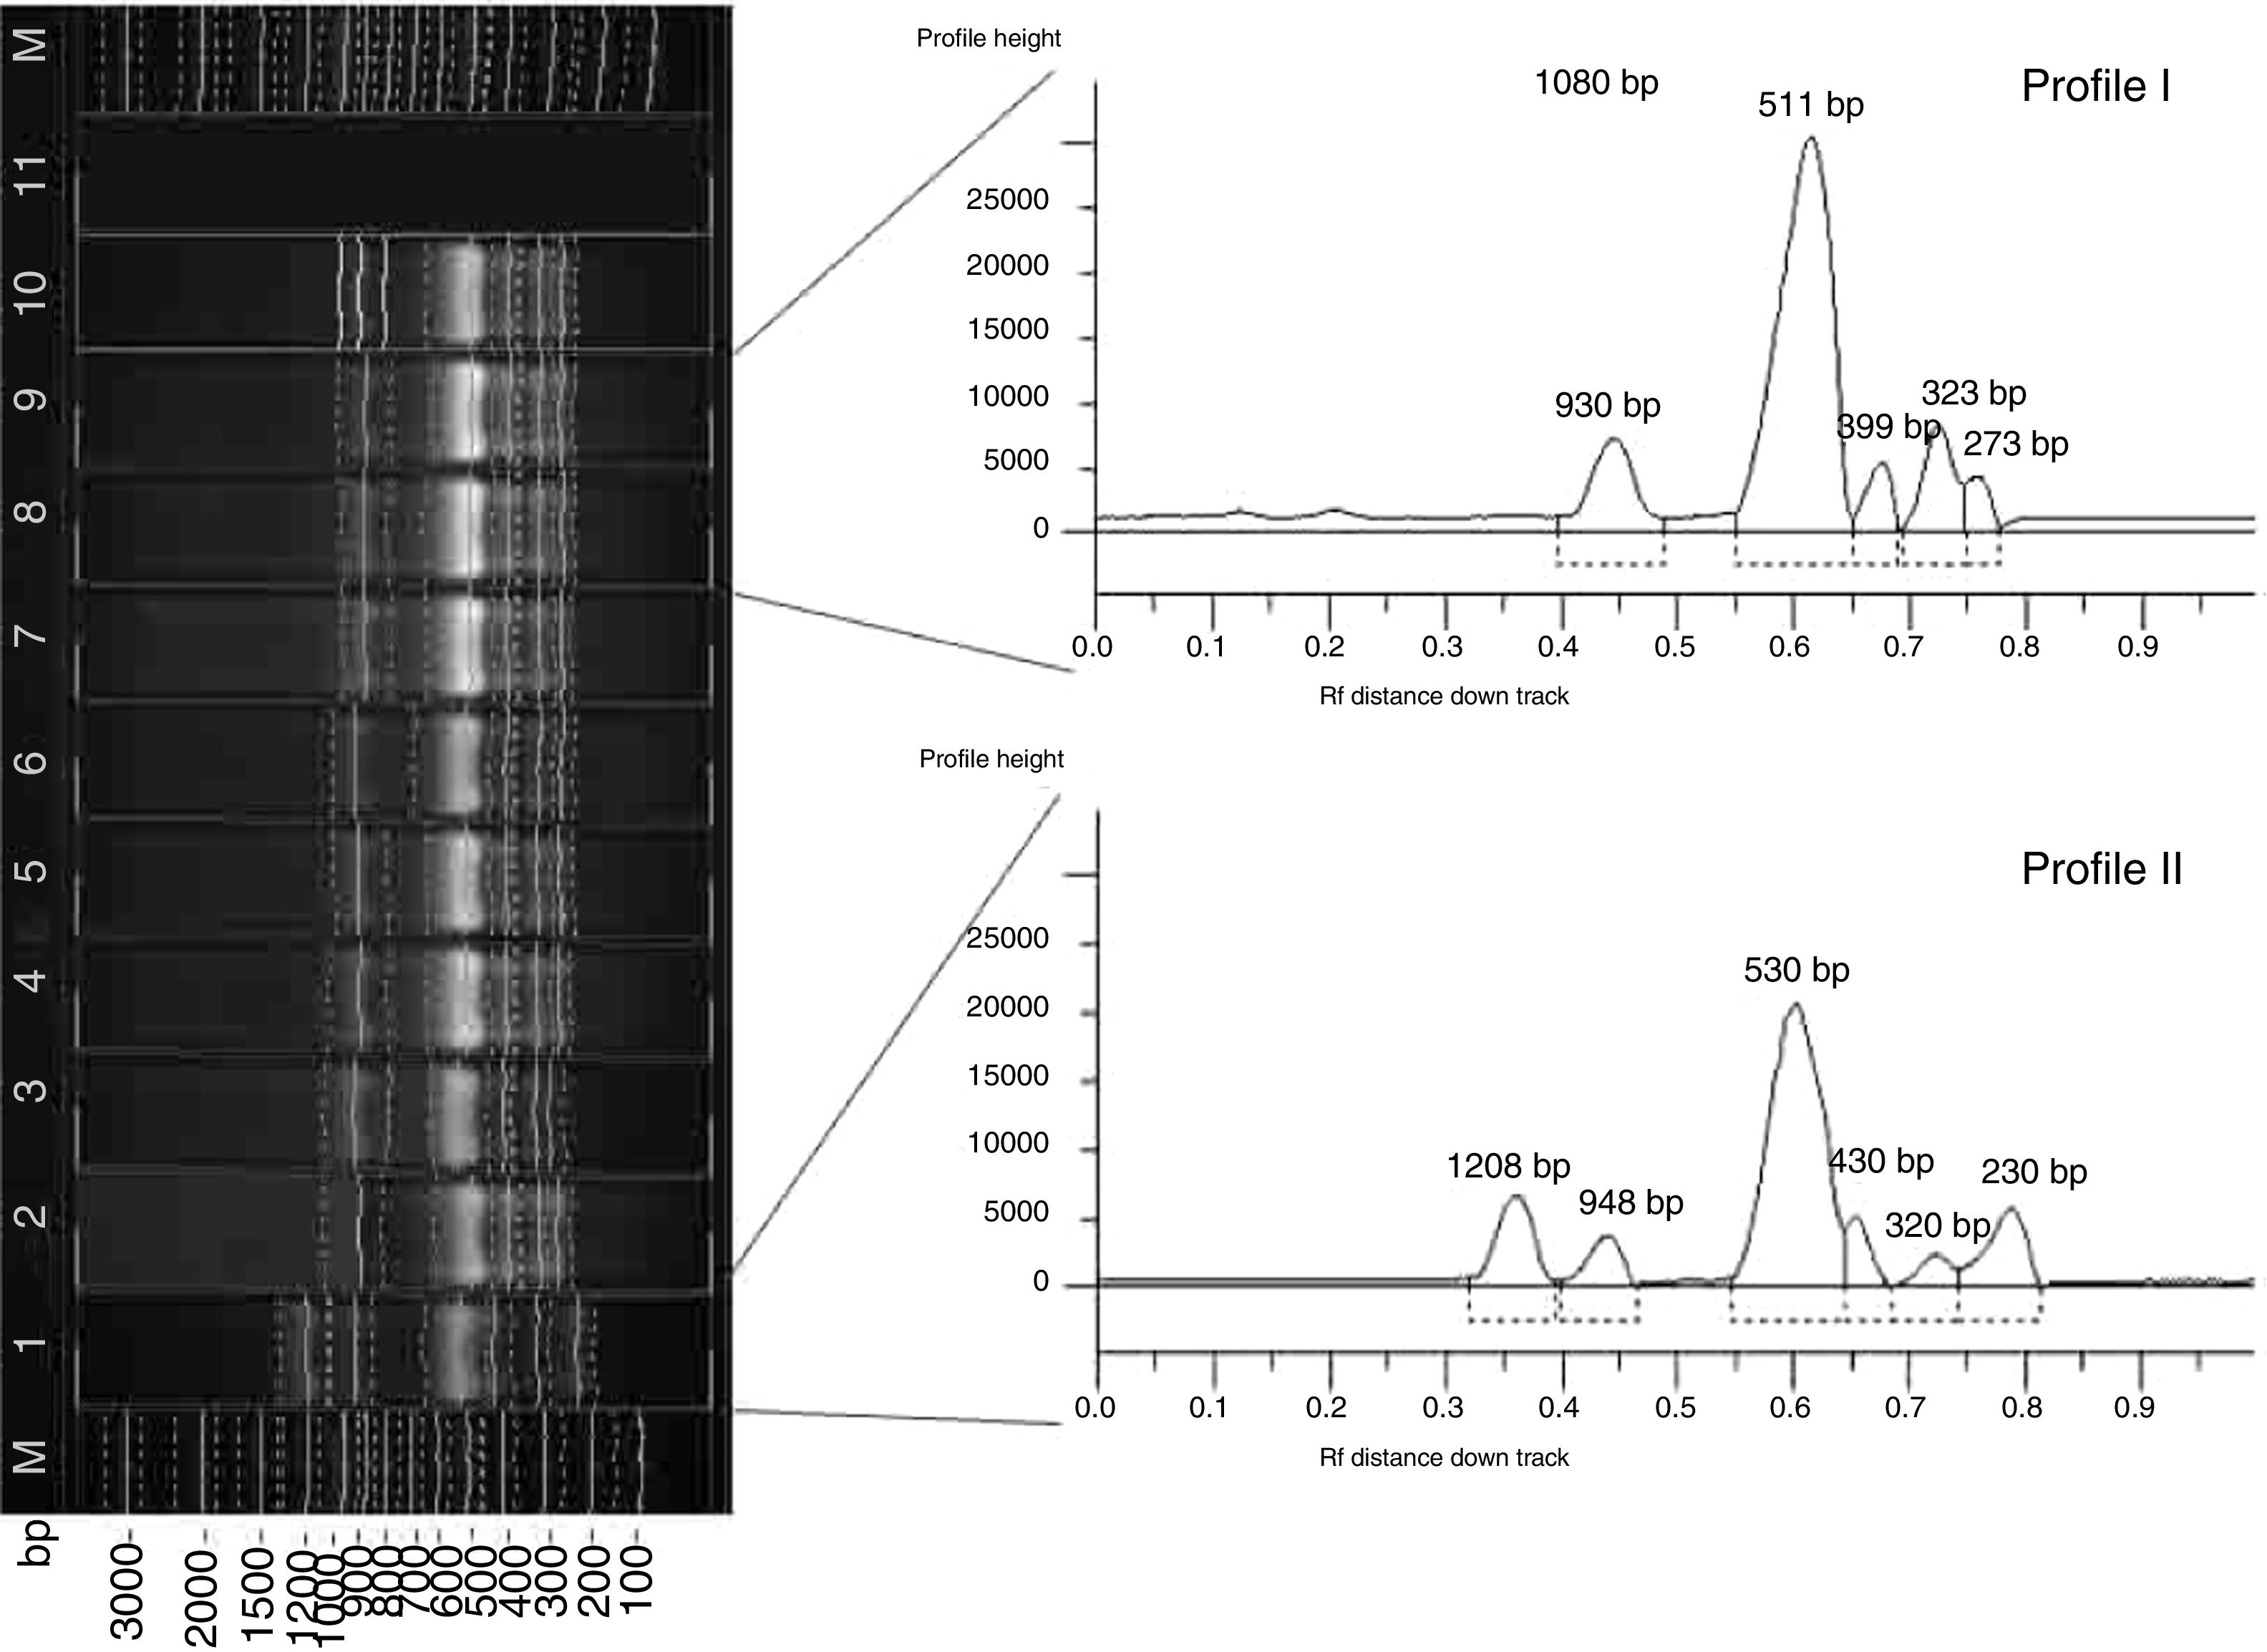
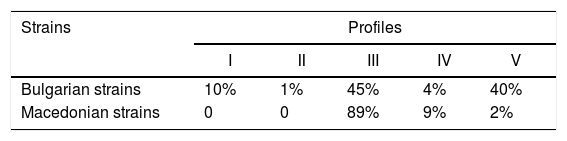
In the course of RAPD-PCR analysis, 16 amplification products were obtained for the X. euvesicatoria and 7 for the X. vesicatoria strains. The primers chosen to evaluate polymorphism generated bands in a wide size range: from 330bp to 2443bp for X. euvesicatoria and from 550bp to 2500bp for X. vesicatoria. Amplification with CUGEA-5 was not applicable for analysis and comparison due to the large number of indistinguishable products. In the presence of the CUGEA-3 primer, only one product for each species was obtained – around 650bp and 1100bp for X. euvesicatoria and X. vesicatoria, respectively. After the amplification with the CUGEA-6 primer, three profiles were revealed for X. euvesicatoria strains – profile I, II, and III, respectively. Profile I consisted of five products and was formed by only 8% of the Bulgarian strains, all isolated in 2012.8 The rest of the strains generated profile II which was characterized by five products. The type culture of X. euvesicatoria formed the third profile. With CUGEA-6, no intraspecies diversity was observed for the isolated X. vesicatoria strains: they all formed a profile of six products (about 1100bp, 1400bp, 1500bp, 1800bp, 2100bp, and 3000bp). Only the type X. vesicatoria strain showed a different pattern, consisting of two amplification products (around 1100bp and 1800bp). The amplification of the X. euvesicatoria strains with CUGEA-4 generated five profiles (Fig. 2, Table 3). Most of the analyzed strains formed profile III. Profiles I and II were exclusive to Bulgarian strains. Profile V comprised a great part of the Bulgarian (40%) and only 2% of the Macedonian strains (Table 3). X. vesicatoria strains formed only one RAPD-pattern with CUGEA-4 (550bp, 650bp, 800bp, 1000bp, 1300bp and 1600bp) with the exception of the type strain which lacked the product of 1300bp, and had additional one of 2500bp. The discriminatory index of RAPD-PCR with CUGEA-6 and CUGEA-4 for X. euvesicatoria was 0.14 and 0.55, respectively, whereas the combined analysis had D of 0.60.

RAPD-PCR amplification of X. euvesicatoria strains with the CUGEA-4 primer. On the left: M-DNA ladder; lane 12 – representative X. euvesicatoria strain forming profile I; lane 2 – representative X. euvesicatoria strain forming profile II; lanes 3–5, 11, 13, 14 – representative X. euvesicatoria strains forming profile III; lanes 6–8, 18 – representative X. euvesicatoria strains forming profile IV; lanes 1, 9, 10 – representative X. euvesicatoria strains forming profile V; lane 15 – PCR mix. On the right: graphs of the five profiles. The numbers at the tops of the peaks correspond to the lengths of the amplicons.
The REP-PCR analysis with BOX A1R generated 11 well defined amplification products with lengths of 250–2100bp and revealed four profiles among the population of the X. euvesicatoria strains (Figs. 3 and 4). The majority of the strains (97%) formed profile I which was also characteristic for the type strain, X. euvesicatoria NBIMCC 8731. All Macedonian strains were grouped together in profile I. Profiles II and III united only Bulgarian strains (11b, 38b, and 28b) isolated from Western Bulgaria. Only one strain (69b), isolated from Northern Bulgaria, characterized profile IV. The discriminatory index was 0.06.

REP-PCR amplification of X. euvesicatoria strains with the BOX A1R primer – Profiles I–III. On the left: M-DNA ladder; lanes 1, 3–5, 7–11, 13–17 – representative X. euvesicatoria strains forming profile I; lanes 2, 12 – representative X. euvesicatoria strains forming profile II; lane 6 – representative X. euvesicatoria strain forming profile III; lane 18 – PCR mix. On the right: graphs of the three profiles. The numbers at the tops of the peaks correspond to the lengths of the amplicons.

REP-PCR amplification of X. euvesicatoria strains with BOX A1R primer – Profiles I, IV. On the left: M-DNA ladder; lanes 1–15, 17 – representative X. euvesicatoria strains forming profile I; lane 16 – representative X. euvesicatoria strain forming profile IV; lane 18 – PCR mix. On the right: graphs of the two profiles. The numbers at the tops of the peaks correspond to the lengths of the amplicons.
All X. vesicatoria strains were grouped in profile I with five amplification products (Fig. 5). The type strain, X. vesicatoria NBMICC 2427 formed a separate pattern of six products (Fig. 5).

REP-PCR amplification of X. vesicatoria strains with the BOX A1R primer. On the left: M-DNA ladder; lane 1 – type strain X. vesicatoria forming profile II; lanes 2–10 – representative X. vesicatoria strains forming profile I; lane 11 – PCR mix. On the right: graphs of the two profiles. The numbers at the tops of the peaks correspond to the lengths of the amplicons.
ERIC-PCR analysis revealed two profiles among X. euvesicatoria strains. Eight well defined amplification products with length 370–1565bp were observed (Fig. 6). All the Macedonian and most of the Bulgarian strains were grouped into profile I. Only two Bulgarian strains (25b and 27b) formed profile II. One of these strains (25b) was separated also with the analysis with BOX A1R primer, where it formed profile III. The discriminatory index of REP-PCR was 0.03 which makes this analysis less usable for evaluation of genetic diversity of X. euvesicatoria than RAPD-PCR. Among X. vesicatoria strains two different profiles were defined. Most of the Bulgarian strains (70%) were grouped together with all the Macedonian strains in profile I (Fig. 7). Diversity among the Bulgarian strains of the species was achieved only by the use of ERIC primers.

REP-PCR amplification of X. euvesicatoria strains with ERIC primers. On the left: M-DNA ladder; lanes 1–5, 8–17 – representative X. euvesicatoria strains forming profile I; lanes 6, 7 – representative X. euvesicatoria strains forming profile II; lane 18 – PCR mix. On the right: graphs of the two profiles. The numbers at the tops of the peaks correspond to the lengths of the amplicons.

REP-PCR amplification of X. vesicatoria strains with ERIC primers. On the left: M-DNA ladder; lanes 1–3, 6, 9 – representative X. vesicatoria strains forming profile I; lanes 4, 5, 7, 8, 10 – representative X. vesicatoria strains forming profile II; lane 11 – PCR mix. On the right: graphs of the two profiles. The numbers at the tops of the peaks correspond to the lengths of the amplicons.
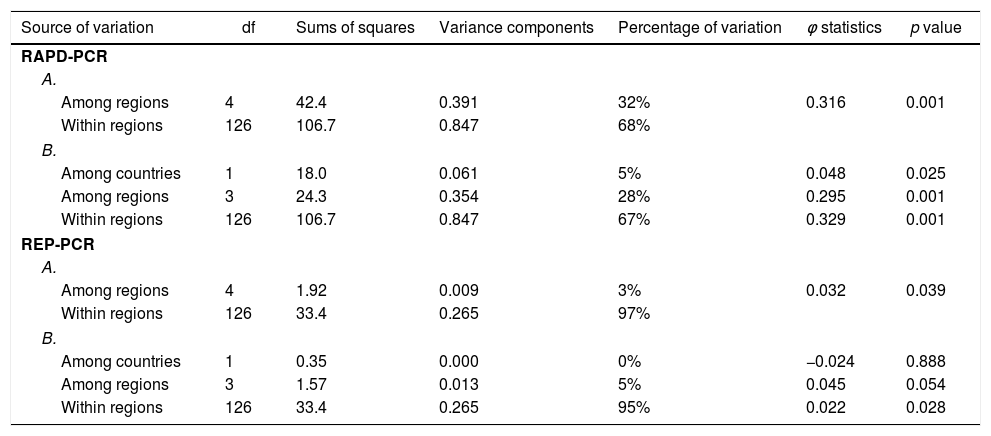
Two- and three level AMOVA were conducted for the both types of molecular primers to reveal the genetic differentiation of Xanthomonas strains. The summary statistics for X. euvesicatoria are presented in Table 4. The partitioning of genetic variation between the strains showed a larger share within the regions and was accounted for 67–68% for RAPD-PCR and 95–97% for REP-PCR respectively. In AMOVA based on RAPD-PCR, the percentages of variation attributed to among regions were 32% (two-level analysis) and 28% (three-level analysis). It was established that the difference between the countries (Bulgaria and Macedonia) was minor (5%). The contributions of all variance components were statistically significant (p=0.01 for within- and among-region levels and p<0.05 for among-country level). Furthermore, pairwise ϕ matrix showed significant differences between all regions excluding Macedonian and North-Eastern Bulgarian strains. Only 3–5% of the total variance was due to the variation among regions on the base of REP-PCR. No differences were recorded between countries. The AMOVA results for X. vesicatoria strains were not reported because of non-significant partitioning of the genetic variation.
Analysis of molecular variance of X. euvesicatoria strains based on RAPD-PCR (CUGEA-4 and CUGEA-6) and REP-PCR (with primers BOX A1R and ERIC).
| Source of variation | df | Sums of squares | Variance components | Percentage of variation | φ statistics | p value |
|---|---|---|---|---|---|---|
| RAPD-PCR | ||||||
| A. | ||||||
| Among regions | 4 | 42.4 | 0.391 | 32% | 0.316 | 0.001 |
| Within regions | 126 | 106.7 | 0.847 | 68% | ||
| B. | ||||||
| Among countries | 1 | 18.0 | 0.061 | 5% | 0.048 | 0.025 |
| Among regions | 3 | 24.3 | 0.354 | 28% | 0.295 | 0.001 |
| Within regions | 126 | 106.7 | 0.847 | 67% | 0.329 | 0.001 |
| REP-PCR | ||||||
| A. | ||||||
| Among regions | 4 | 1.92 | 0.009 | 3% | 0.032 | 0.039 |
| Within regions | 126 | 33.4 | 0.265 | 97% | ||
| B. | ||||||
| Among countries | 1 | 0.35 | 0.000 | 0% | −0.024 | 0.888 |
| Among regions | 3 | 1.57 | 0.013 | 5% | 0.045 | 0.054 |
| Within regions | 126 | 33.4 | 0.265 | 95% | 0.022 | 0.028 |
A. Two level AMOVA: the strains were grouped into regions according their geographical locations; B. Three level AMOVA: the regions from Bulgaria and Macedonia were separated.
Additionally, Nei's unbiased genetic distance between all pairs of regions was calculated using RAPD-PCR data for X. euvesicatoria (Table 5). The largest distances were obtained between Macedonian strains and those from Northern (0.154) and Southern Bulgaria (0.134), and the smallest distances – between the strains originated from North-Eastern Bulgaria and those from Macedonia (0.001) and Western Bulgaria (0.015). Principal Components Analysis (PCoA) based on the genetic distance matrix was carried out (Fig. 8). According to the results, the first two coordinates explained 86% and 13% of the total molecular variation, respectively. Scatter PCoA plot displayed the close relationship between the three regions mentioned above – Macedonia (M), North-Eastern Bulgaria (NEB) and Western Bulgaria (WB) (Fig. 8).

The distribution of X. vesicatoria and X. euvesicatoria varied through the years. Interestingly, in the last two years of the study, X. vesicatoria was not detected. The shift between the populations of X. euvesicatoria and X. vesicatoria, which we observed in 2012 and 2013, can hardly be explained. Bulgaria and Macedonia are neighboring countries with similar climate. A possible reason for the shift may be local adaptation to climate conditions of the respective years and the more narrow specialization of X. euvesicatoria to pepper compared to X. vesicatoria.
Analysis with CUGEA-6 revealed diversity only among the X. euvesicatoria Bulgarian strains. A greater diversity was observed by amplification with CUGEA-4 of X. euvesicatoria strains from both countries. The combined RAPD-PCR analysis with the two random primers CUGEA-4 and CUGEA-6 enabled a more comprehensive study of the genome and could be used for investigation of the genetic diversity in populations. However, according to our results, these primers were not suitable for seeking of intraspecies diversity within the species X. vesicatoria as only the type strain formed a profile different from the other strains. Investigations of more strains are needed to confirm this statement. Heterogenеity for the population of X. euvesicatoria was also detected by BOX-PCR and for X. vesicatoria – by ERIC-PCR. Diversity was observed mainly in the Bulgarian populations of both species. The Macedonian X. euvesicatoria strains were relatively homogenous when analyzed by RAPD-PCR with CUGEA-6, ERIC-PCR, and BOX-PCR and the X. vesicatoria strains also grouped together by all applied methods.
RAPD-PCR analysis with the two primers CUGEA-4 and CUGEA-6 had greater discriminative power (0.60) than BOX- and ERIC-PCR for X. euvesicatoria, which makes this method applicable for strain diversity evaluation. However, the genetic patterns obtained by the different methods used in this study did not show correlation in the grouping of the strains – only one Bulgarian X. euvesicatoria strain formed a different profile than the majority of the strains determined by both BOX- and ERIC-PCR analyses.
To evaluate the diversity of the strains X. euvesicatoria according to their place of isolation, AMOVA based on the regions and countries was carried out. Differences between the Bulgarian and Macedonian strains were minor with RAPD-PCR and insignificant with REP-PCR. Variations were observed among populations originating from different regions – WB, NB, NEB, SB, and M, which may be related to the specific soil and climate conditions of each region. However, much greater variation existed among the strains irrespective of their origin (67–68% vs. 28–32%). The strains in this study have been isolated during a period of 13 years which could explain these results. Similarities between the regions M and WB may be due to the closest location to each other compared to the others, while M and NEB, which have least genetic distance, are geographically the two most distant regions. However, NEB is the only region alongside the Black Sea coast, which is characterized with the mildest climate of all investigated regions, and Macedonia (M) has milder climate than SB, NB, and WB due to its most southern location.
RAPD-PCR and REP-PCR have been successfully used for the characterization of populations of different xanthomonads.16,30–35 To our knowledge, our recent and previous study7 are the first analyses of populations of the causative agents of bacterial spot of pepper using these methods. According to the obtained data, the Bulgarian population of X. euvesicatoria is more diverse and prevalent than the population of X. vesicatoria. The domination of one genotype among the xanthomonads in Bulgaria and Macedonia could be due to a common source of infection or origin. Trade of seeds and seedlings between the neighboring countries and the different regions is probable. The great homogeneity among the strains of certain species could be a result of being in an isolated and restricted area. The distribution of the pathogens in different regions is a key to the development of genetic diversity. The high genetic identity among strains, isolated from geographically close areas with nearly similar climatic conditions, is commonly observed and is crucial for the adaptation capabilities of the pathogens. There is evidence for a relationship between the regions of isolation and the grouping of strains according to their REP-PCR patterns for other Xanthomonas species.31–33,35 Relationships between the particular strain pattern groups and the regions of isolation in this study were not recorded, however, based on the PCoA, a relation between the climatic conditions of the regions and the genetic distance of the populations may be suggested. Correspondence between metabolic clusters of X. euvesicatoria and the climatic characteristics of the regions was detected in a previous study for strains isolated in a single year (2012). In this year, the Bulgarian strains from North-Eastern Bulgaria were also closest to Macedonian strains and more distant from the strains isolated from other parts of Bulgaria.8
The occupation of specialized niches could influence the organization of the genome and the distribution of repetitive elements in the bacterial genome. This could have altered the genetic profile and the emergence of new characteristic profiles for certain species or strains. The pepper varieties, at this stage of the studies, seem not to be related to the profiles formed by the repetitive elements. For example, some strains, isolated from the same local pepper varieties in Bulgaria, were separated as different and genetically heterogeneous. The population of the two pathogens, X. euvesicatoria and X. vesicatoria, in Macedonia is more homogenic. Cv. Kurtovska kapyia is the main pepper variety grown in Macedonia and adaptation to this host could not be a factor which defines the genetic diversity within the population. A comparison of a large number of strains from different pepper varieties from a single region in a single year may show some relatedness, however, based on the overall picture, the variety of the host seems to have much less significance compared to the region of isolation.
In conclusion, we evaluated the genetic diversity based on repetitive elements in the two bacterial species as an initial step to understanding the population structure of the pathogens identified as causative agents of bacterial spot of pepper in Bulgaria and Macedonia. This study may serve as a platform study for extended investigations in this area and refined characterization of the relations region – climate adaptation – host variety adaptation – genetic diversity of the pathogens. Our results also showed that the RAPD primers rather than ERIC- and BOX-primers were efficient in differentiating strains. Additional samples and yearly comparisons are needed to fully understand the population structure.
Conflicts of interestThe authors declare no conflicts of interest.
This study was supported by project DFNI Б02/4 by the National Science Fund of Bulgaria.