


We analyze the effect of two types of corporate diversification (business diversification and ownership diversification) on the market value of the Chilean firms. For a sample of 83 nonfinancial firms listed on the Santiago Stock Market from 2005 to 2013, we find a discount for both business and ownership diversification, which is consistent with that reported for other economic or institutional settings. Second, we find that the business diversification discount is related to the ownership structure and is due to the excess of the largest shareholders’ control rights. Third, we find that the ownership diversification discount becomes a premium when the ownership diversification enables the control of the affiliated firms. This effect can be explained by the improvement of internal capital markets that allows overcoming the limitations of Chilean external capital markets.
The allegedly beneficial or detrimental effects of diversification on the value of the firm have remained in the core of the business research for long time (Tong, 2011). Recent literature on corporate governance and finance has underlined the effect of corporate ownership, showing that the corporate diversification discount is more pronounced among firms with low managerial ownership and controlled by dominant shareholders (Aggarwal and Samwick, 2003; Laeven and Levine, 2007). Nevertheless, the effect of pyramidal ownership structures, which amplify the control of dominant shareholders, is not yet clear.
Using this control enhancing mechanism, the involved shareholders can engage in diversification strategies by drawing a control chain that enable them to achieve control benefits and maximize the value of the base2 company of the chain at the expense of the minority shareholders of the subsidiary firms (Claessens et al., 2000; Faccio and Lang, 2002; Laeven and Levine, 2008; Ruiz-Mallorquí and Santana-Martín, 2009).
The effect of the ownership structure on the relation between diversification and firm value can be more relevant in institutional frameworks where the investor protection is weak (La Porta et al., 1998, 1999). The previous research is inconclusive and has led to a need for researchers examining how diversification strategy affects firm performance in different institutional environments and market conditions (Lodh et al., 2014; Yigit and Behram, 2013). Prior studies have focused on developed markets and East Asia emerging countries. However, the literature on emerging South American economies is lacking.
We focus on the Chilean context due to some specific institutional features that makes an interesting case analysis. These characteristics are substantially different compared to other developed countries and emerging economies in which the literature has shown the existence of a diversification discount (Berger and Ofek, 1995; Campa and Kedia, 2002; Hoechle et al., 2012; Lang and Stulz, 1994; Lins and Servaes, 1999; Rajan et al., 2000).
First, Chile is an emerging economy with a bank-oriented corporate system, where banks play an important role in comparison with the capital markets (Fernández et al., 2010; Fernández, 2005). Even the firms belonging to economic groups or holdings, despite of having developed internal capital markets, keep a close long-run relation with the banks or own a bank in their economic groups (Majluf et al., 1998). Despite of the small size of the Chilean capital markets, compared with other South American countries, Chile presents a lower country-risk premium, lower corruptions levels, and open financial markets.
Second, partially explained by the political process at the second half of the 80s3 and as a natural response of the historical less enforcement of law, Chilean firms present a high ownership concentration, primarily in the hands of individual shareholders or well-diversified conglomerates, that give rise to pyramidal structures (Hachette, 2000; Larraín and Vergara, 2000; Lefort and González, 2008; Lefort and Walker, 2000a, 2000b). Despite the growth of the capital markets in recent decades, the legal system has not given enough protection to the investors to avoid these concentration levels. On the contrary, the Chilean legal system has traditionally operated in a reactive way toward increasing the protection of existing pension systems administrators (Iglesias, 2000).
Third, in order to improve corporate governance practices, Chilean regulators have recently adopted several capital markets rules as the corporate governance Law (Law 20.382, 2009) and the Law on transactions with related parties in limited liability firms (Law 18.046, 2010), to improve the informational transparency about corporate governance.
Our study analyzes the effect of two types of diversification (business diversification and ownership diversification) on the market value of the Chilean quoted firms. The business diversification refers to the firm segments in different sectors, and the ownership diversification4 refers to the firm holding a fraction of the ownership of other companies. For a sample of 83 nonfinancial companies listed on the Santiago Stock Market from 2005 to 2013, our main result is the evidence of a discount for both business and ownership diversification, which is consistent with that reported for other economic or institutional settings. Second, we find that the business diversification discount is related to the ownership structure and is due to the excess of the largest shareholders’ control rights. Third, we find that the ownership diversification discount becomes a premium when the diversification enhances the control of other firms. This effect can be explained by the improvement of internal capital markets that allow overcoming the limitations of external capital markets.
Our work contributes to the financial literature in three ways. First, this study is the first to analyze the impact of nonrelated diversification on the value of companies in an emerging South American economy. Second, our results extend previous works that have analyzed agency problems from high concentrated ownership structures and weaker law investor protection (Lefort and Urzúa, 2008; Majluf et al., 2006; Silva and Majluf, 2008). Finally, we use the method of control chains, which allows to draw the whole ownership pyramid and to identify the ultimate shareholders of the firms. Consequently, we compute the difference between voting rights and control rights that can result in potential tunneling problems.
The remainder of the paper is organized as follows. The second section develops the analytical framework, which includes the literature review and hypotheses development. The third section provides the description of the study sample and describes the method and variables used in the analysis. The fourth section presents the results. The final section summarizes our main conclusions.
Analytical framework and hypothesesBusiness diversificationCorporate diversification strategies are widely known as having both positive and negative implications for firm efficiency. On the one hand, tax benefits associated with diversification can improve firm value (Berger and Ofek, 1995). Diversification strategies also enable the redistribution of funds among divisions and promote internal capital markets that can mitigate financial constraints and improve efficiency (Campa and Kedia, 2002; Kuppuswamy and Villalonga, 2010; Servaes, 1996). In addition, unrelated diversification allows firms to reduce cash flow volatility and corporate risk (Hann et al., 2013; Kuppuswamy and Villalonga, 2010; Shleifer and Vishny, 1992). In sum, the diversification may allow firms to invest in marginally profitable projects (Fluck and Lynch, 1999), to transfer knowledge among business units (Becerra, 2009; Humphery-Jenner, 2010), to implement some organizational improvements (Matsusaka, 2001), and to take advantage of potential generation of synergies and economies of scope (Becerra, 2009; Gomes and Livdan, 2004; Lang and Stulz, 1994).
On the other hand, a diversification discount may arise if diversification strategies lead to discretionary behavior by firm's managers and controlling shareholders. This discount can be explained by inefficient resources allocation from more productive segments to poorer ones (Aivazian et al., 2011; Berger and Ofek, 1995; Servaes, 1996), overinvestment in business segments that have lower investment opportunities (Campa and Kedia, 2002), and the organizational complexity that can cause operational inefficiencies (Klein and Lein, 2009; Klein and Saidenberg, 2010). Thus, diversification strategies may exacerbate the so-called dark side of internal capital markets and the inefficient resource (Baker, 1992; Hoechle et al., 2012; Ozbas and Scharfstein, 2010).
Reflecting such theoretical disparities, literature has not yet arrived to a conclusive argument for the existence of a diversification discount (Lamont and Polk, 2002; Lang and Stulz, 1994; Rajan et al., 2000; Whited, 2001). Whether a diversification discount occurs and whether the reason for the discount is related to agency problems or lies in the organizational structure of the firm is an issue that is still under debate (Jiraporn et al., 2008).
These arguments apply especially in emerging economies. Purkayastha et al. (2012) build on three theoretical lenses to explain the specific relations between firm diversification and performance in developing countries. The first reason stems from the institutional view and is based on the fact that the costs and benefits of diversification can be different due to more severe market imperfections in such scenarios (Khanna and Palepu, 2000; Lins and Servaes, 2002). To cope effectively with a less efficient institutional environment, companies may wish to pursue unrelated diversification strategy as an effective means of gaining self-generated institutional support (Chakrabarti et al., 2007; Yigit and Behram, 2013). Second, from the resource-view perspective, in the relevant factors for firm performance in emerging markets are not only competencies and technological abilities but also resources such as political and bureaucratic contacts and connections (Kock and Guillén, 2001; Purkayastha et al., 2012). Corporate diversification across a wide range of businesses could be the consequence of leveraging bureaucratic connections across diverse industries. Third, the finance perspective underlines the different transaction and agency costs in less developed countries. Thus, corporate diversification through the internalization of a range of products and services can be the outcome of the different type of prominent agency problems in these countries (Chung, 2004; Garrido et al., 2014).
The above exposed arguments do not point at an unequivocal relation between diversification and firm performance in emerging countries. Higher asymmetric information might allow management to more easily run the firm for their own purposes. In addition, conflicts of interests between large shareholders who also manage the business groups, and the minority shareholders of the affiliated firms are likely to arise in these countries (Huyghebaert and Wang, 2012; Yao et al., 2010). As suggested by Yigit and Behram (2013) these agency problems can be exacerbated when shareholders rights are not well protected, the contract enforcement is difficult, and accounting standards are poor.
The empirical evidence on the existence of a diversification discount in emerging markets mirrors such a fragmented theoretical background. On the one hand, some studies report that diversification destroys firm value in emerging economies (Chen and Kim, 2000; Lins and Servaes, 2002). On the other hand, Claessens et al. (1999) and Khanna and Palepu (2000) show that diversification strategies add value in India and East Asia as a way to overcome institutional and market imperfections. However, recent evidence casts some doubts on the robustness of these studies (Lensink and van-der-Molen, 2010). Furthermore, the research on diversification in emerging markets has focused on Asia and very little is known about the emerging markets of South America (Farías, 2014; Khanna and Palepu, 2000; Lensink and van-der-Molen, 2010; Lins and Servaes, 2002).
Thus, the effect of the diversification discount on Chilean companies is an empirical question, and we state our first hypothesis is stated as follows:Hypothesis 1a In Chilean firms there is a discount for unrelated diversification strategies. In Chilean firms there is a premium for unrelated diversification strategies.
Although both business diversification and ownership diversification are corporate diversification strategies, we posit that the ownership structure of business conglomerates is such a relevant issue that requires an in-depth attention. In fact, a number of studies relate the diversification discount to the ownership structure and the large shareholders incentives to engage in private benefits seeking activities (Jensen, 1986; Morck et al., 1990). Delios and Wu (2005) find that the effect of business diversification in an emerging market is related to the ownership diversification too.
Most of the literature on corporate ownership structure and firm diversification is concerned with managerial ownership, whereas considerably less research has investigated the set of relations among outside shareholders, diversification, and firm performance in emerging countries (Chen and Yu, 2012). The evidence from Singapore reported by Chen and Ho (2000) shows that, while outside blockholders may act as a deterrent on the level of diversification, outside block ownership does not have a significant impact on the value of diversification.
Ownership pyramidal structures are one of the most commonly used mechanisms to achieve this excess of control rights over cash flow rights in emerging countries (Claessens et al., 2000; La Porta et al., 1999; Lins, 2003). The widespread use of ownership pyramids contrasts with the insufficient research on how and whether pyramidal ownership influences diversification decisions (Chung, 2013). The theoretical arguments on this impact are twofold so the pyramidal ownership structure that enhances the separation between cash flow rights and voting rights can result in tunneling and propping (Cheung et al., 2006). While tunneling refers to a transfer of resources from a lower-level firm to a higher-level firm in the pyramidal chain, propping is the transfer in the opposite direction to bail out the receiving firm from bankruptcy (Riyanto and Toolsema, 2008). Friedman et al. (2003) show that in countries with weak legal systems, under some conditions entrepreneurs can undertake both activities.
The literature has shown that controlling shareholders can have incentives to extract private benefits from the firms they control at the expense of minority shareholders (David et al., 2010; Ruiz-Mallorquí and Santana-Martín, 2011). Consistent with this view, diversification can be seen as an outcome of the incentives of controlling shareholders in relation with other shareholders. Nevertheless, ownership diversification can have positive effects on minority shareholders wealth since they may be willing to be expropriated in exchange for implicit insurance against bankruptcy (Riyanto and Toolsema, 2008).
Chile is an interesting case to test the effect of this control-enhancing mechanism on the value of diversification since Chilean business groups are characterized by pyramidal ownership structures (Lefort and Walker, 2000b). Due to the weaker legal protection of investors and creditors, Chilean companies have experienced a high degree of ownership concentration over the last twenty years, mainly in the hands of individual shareholders or well-diversified business groups (Demirgüc-Kunt and Maksimovic, 2002; Espinosa, 2009; Lefort and González, 2008). This concentrated ownership has given rise to pyramid structures as a common mean for the separation between voting rights and cash flow rights. The data reported by Lefort and Walker (2000b, 2007) and Majluf et al. (1998) show that approximately 68% of nonfinancial companies listed on the Santiago Stock Market are controlled by an economic group, and that pyramidal structures are used in about one-third of the listed companies.
Coherently with the theoretical twofold arguments, we state our second hypothesis in a dual way too:Hypothesis 2a In Chilean firms there is a discount for ownership diversification. In Chilean firms there is a premium for ownership diversification.
The sample includes 83 nonfinancial Chilean companies listed on the Santiago Stock Exchange between 2005 and 2013, totaling 622 firm-year observations. We draw our sample from two main information sources. We obtain data from financial statements (balance sheet and income and expenditures statement) and the market value of the firms from the Datastream database. The information on the ownership structure and both unrelated diversification and ownership participation of other companies comes from a hand-collected process from several information sources (the firms annual reports and the Superintendencia de Valores y Seguros reports, among others). This last information is the most restrictive in terms of limiting the size of our sample. Thus, because our dependent “excess value” variable is estimated with “imputed values”, to deal with this problem we use an auxiliary sample composed of 163 nonfinancial firms and 1463 observations for the 2005–2013 period. Table 1 provides a detailed description of the sample (auxiliary sample) including the number of firms and observations by year-industry.
Sample composition by year-sector.
| 2005 | 2006 | 2007 | 2008 | 2009 | 2010 | 2011 | 2012 | 2013 | Total | |
|---|---|---|---|---|---|---|---|---|---|---|
| Basic materials | 3 (29) | 7 (29) | 18 (29) | 18 (29) | 17 (29) | 15 (29) | 17 (29) | 14 (29) | 12 (29) | 121 (261) |
| Consumer cyclicals | 1 (26) | 1 (26) | 6 (26) | 6 (26) | 6 (26) | 7 (26) | 8 (26) | 8 (26) | 3 (26) | 46 (234) |
| Consumer non-cyclicals | 9 (35) | 14 (35) | 20 (35) | 19 (35) | 21 (35) | 20 (35) | 19 (35) | 20 (35) | 11 (35) | 153 (315) |
| Energy | 1 (5) | 1 (5) | 2 (5) | 1 (5) | 1 (5) | 1 (5) | 1 (5) | 2 (5) | 1 (5) | 11 (45) |
| Healthcare | 1 (4) | 2 (4) | 2 (4) | 3 (4) | 3 (4) | 3 (4) | 4 (4) | 3 (4) | 4 (4) | 25 (36) |
| Industrials | 3 (30) | 10 (30) | 18 (30) | 17 (30) | 17 (30) | 18 (30) | 17 (30) | 17 (30) | 10 (30) | 127 (270) |
| Technology | 1 (4) | 1 (4) | 1 (4) | 1 (4) | 1 (4) | 1 (4) | 1 (4) | 1 (4) | 8 (32) | |
| Telecommunications | 2 (4) | 3 (4) | 3 (4) | 3 (4) | 2 (4) | 2 (4) | 2 (4) | 2 (4) | 3 (4) | 22 (36) |
| Utilities | 8 (26) | 10 (26) | 13 (26) | 13 (26) | 13 (26) | 13 (26) | 13 (26) | 14 (26) | 12 (26) | 109 (234) |
| Total | 28 (159) | 49 (163) | 83 (163) | 81 (163) | 81 (163) | 80 (163) | 82 (163) | 81 (163) | 57 (163) | 622 (1463) |
Since we are interested in the effects of diversification on the firm market value, both the base firms and the auxiliary sample are traded firms. On the contrary, the firms controlled by the base firms are not necessary traded. In the cases in which the firms are listed, the effect of the diversification on the value of the firm could be affected by the valuation of the shareholders of the target firm. To control for this issue, we include as explanatory variables a set of factors related to how the control of the target firms is implemented.
VariablesExcess value and value measuresTo compute the existence of a diversification discount we use the measure of excess value proposed by Berger and Ofek (1995), who compare the total value of the company to the sum of the imputed values that are assigned to each segment as if each one is an individual single-segment company. Thus, the excess value for a company is determined by
where Exvalxi,t is the excess value for firm i in year t; MVi,t is the firm's market capitalization (market value of common equity plus book value of debt) for firm i in year t; and Imputed Value is the sum of the product of segment asset (or sales), SAsset, and the asset (or sales) multiplier. Multiplier is measured as the median total market capitalization to asset (or sales) for the single-segment firms in the same industry in the same year. A positive excess value indicates that the firm is worth more than the sum of its segments whereas a negative excess value implies that the firm as a whole is worth less than the sum of its segments. Thus, a positive excess value implies a diversification premium whereas a negative excess value indicates a diversification discount. When we use multiple assets (multiple sales), the resulting excess value is EXVALASSETS (EXVALSALES).

To check the robustness of our results with ownership diversification, we estimate Eq. (4) incorporating as a dependent variable the market-to-book ratio as a measure of firm's value (Adam and Goyal, 2008).
Diversification measuresWe analyze the diversification along two lines: unrelated business diversification and ownership diversification. To measure unrelated diversification, we use the Herfindahl index modified by Berry (1971), which reflects the absence of concentration of sales (HERFSALES) and assets (HERFASSETS). The higher this variable, the higher the level of corporate diversification of the company, either in sales or assets. Since this index has been criticized because of its sensitivity to market price volatility, we also include a measure of entropy of assets (ENTROASSETS) and sales (ENTROSALES), which considers diversification across different levels of industry aggregation. The entropy variables are positively related to the degree of diversification.
As a complement, we also employ a number of alternative measures. We define DIV, a dummy variable that equals 1 when the company is diversified into unrelated sectors, and zero otherwise. NSEC is the number of industry segments in which the company participates.
The measure of ownership diversification and control over other firms is based on the number of firms in whose ownership the base firms have a stake (NPART). We define PCONTR as the proportion of companies that are subsidiaries over the total number of companies in which the company owns some share. CERPT is the number of subsidiaries in related sectors over the total number of companies in which the base firm owns a fraction of shares. We include LNCAPINV, defined as the natural logarithm of the total capital invested in other companies. In addition, we incorporate the DIVINV dummy variable, which takes the value 1 when the investment portfolio in the ownership of other companies is diversified, and zero otherwise.
We follow La Porta et al. (1999) and Santana and Aguiar (2006) approach and use the control chain methodology, which allows us to identify a firm's ultimate owner, that is, the shareholder who effectively controls the firm. According to this procedure, we compute the separation between the ultimate shareholder's voting rights and cash flow rights (DVDFC). Additionally, we introduce two dummy variables (SEP1/SEP2) that take value 1 when the separation between voting rights and cash flow rights is higher/lower than the mean of DVDFC, and zero otherwise.
Control variablesFollowing prior literature, we introduce into our model a number of firm-level control variables that potentially affect the value of a diversified firm. We control for the firm size (LNTA), measured as the natural logarithm of total assets; the financial leverage (DTTA), measured as the ratio of total debt to total assets; the profitability (EBITSAL), calculated as earnings before interest and taxes over sales; and the growth opportunities proxied by capital expenditures over sales (CAPEXSAL).
We also control for some characteristics of the Chilean corporate system. Chile has a French civil law institutional setting with weaker external investor protection than the Anglo-Saxon countries. The corporate ownership is usually concentrated in the hands of few controlling shareholders. With this in mind, we introduce the control variable DFC1, defined as the percentage of cash flow rights held by the ultimate shareholder. We control for a possible subprime crisis effect with the CRISIS dummy variable, which equals 1 for 2008 and 2009, and zero otherwise. In addition, we introduce a set of nine industry dummy variables according to the sector classification provided by the Chilean Security Exchange Regulator (DSEC) and a set of year dummy variables (DYEAR).
See the Appendix for complete definitions of all variables.
MethodTo test the effect of the corporate diversification and the ownership diversification on the value of the firms, we estimate the following models:


A large body of literature highlights the existence of endogenous selection problems in diversification and performance models (Miller, 2006; Villalonga, 2004). These authors claim that firms decide their diversification strategy as a response to exogenous changes in the firm environment. Due to these methodological failures, the diversification discount can stem from omitting the potential endogeneity of the diversification strategy. Indeed, Campa and Kedia (2002) find that the diversification discount is alleviated, and sometimes even disappears, after controlling for endogeneity.
When we accept the possible endogeneity in our models, DIV and DIVINV are correlated with the error term in Eqs. (3) and (4), respectively. As a result, the estimated coefficients β2 may be biased because of endogenous selection problems in the model. We address this issue by using the Heckman (1979) method.
The two-step Heckman's procedure explicitly captures both firm-specific and macroeconomic factors that influence the firm propensity to diversification (Dastidar, 2009). In the first stage, we estimate the selection equation (5) as a maximum-likelihood probit model to analyze the propensity to diversify, and we calculate the Mills inverse ratio (λi). In the second stage we introduce the Mills inverse ratio as an additional explanatory variable in Eqs. (3) and (4).
According to Campa and Kedia (2002), the probit model for the first stage can be defined as follows:
where DIVit* and DIVINVit* are two unobservable latent variables. The variables potentially affecting the diversification decision are both firm-level factors (size, profitability, growth opportunities, and largest shareholder's stake in ownership) and country-level macroeconomic factors such as the GDP growth rate for the period (CRECGDPit). In this selection equation we also include two factors related to the industry: PNDIVit is the percentage of companies from the primary industry that are diversified, and PSDIVit is the proportion of sales of the diversified companies.ResultsDescriptive analysis

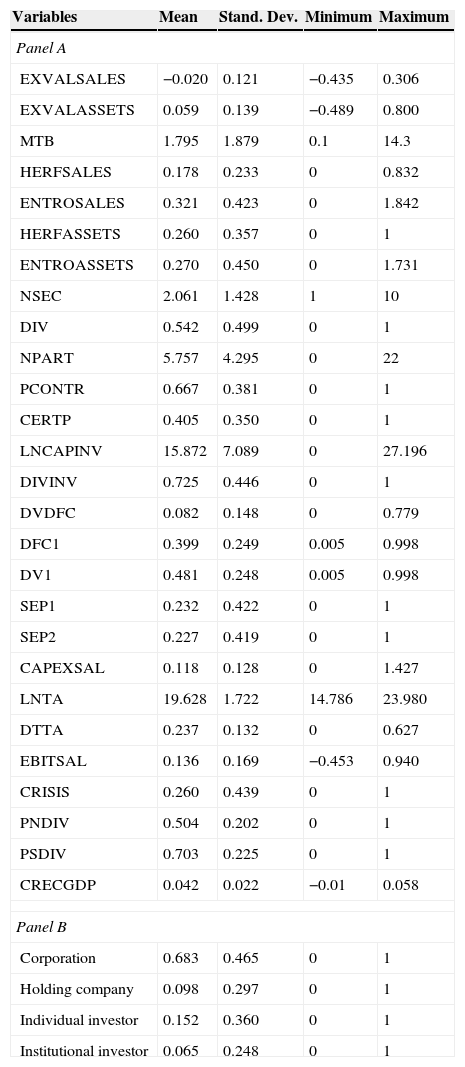
Table 2 shows the main descriptive statistics of our sample. Regarding diversification measures (Panel A of Table 2), approximately 54.2% of the companies are diversified in terms of holding more than one industrial segment (DIV). This number is higher than the results reported by Lins and Servaes (1999) for developed economies (United States, 26%; Germany, 37%; Japan, 41%; United Kingdom, 38%). Broadly speaking, the number of sectors (NSEC) in which firms are diversified is low, with an average value of 2.06 sectors, and therefore the degree of absence of concentration in sales and assets (HERFSALES and HERFASSETS) is significantly reduced. DIVINV informs that 72.5% of companies are diversified in terms of ownership, participating on average in the ownership of 5.75 companies (NPART). The base firms control the affiliated firms in 66.7% of cases (PCONTR) but only in 40.5% of cases from related industry segments (CERTP). In general, these results show that companies tend to diversify their ownership of other companies to form conglomerates and that the degree of control over these companies is essential. These conglomerates have low industrial diversification in most cases. Additionally, pyramidal ownership structures enhance the separation of voting rights and cash flow rights, with voting rights exceeding cash flow rights by 8.2% on average (DVDFC).
Descriptive statistics.
| Variables | Mean | Stand. Dev. | Minimum | Maximum |
|---|---|---|---|---|
| Panel A | ||||
| EXVALSALES | −0.020 | 0.121 | −0.435 | 0.306 |
| EXVALASSETS | 0.059 | 0.139 | −0.489 | 0.800 |
| MTB | 1.795 | 1.879 | 0.1 | 14.3 |
| HERFSALES | 0.178 | 0.233 | 0 | 0.832 |
| ENTROSALES | 0.321 | 0.423 | 0 | 1.842 |
| HERFASSETS | 0.260 | 0.357 | 0 | 1 |
| ENTROASSETS | 0.270 | 0.450 | 0 | 1.731 |
| NSEC | 2.061 | 1.428 | 1 | 10 |
| DIV | 0.542 | 0.499 | 0 | 1 |
| NPART | 5.757 | 4.295 | 0 | 22 |
| PCONTR | 0.667 | 0.381 | 0 | 1 |
| CERTP | 0.405 | 0.350 | 0 | 1 |
| LNCAPINV | 15.872 | 7.089 | 0 | 27.196 |
| DIVINV | 0.725 | 0.446 | 0 | 1 |
| DVDFC | 0.082 | 0.148 | 0 | 0.779 |
| DFC1 | 0.399 | 0.249 | 0.005 | 0.998 |
| DV1 | 0.481 | 0.248 | 0.005 | 0.998 |
| SEP1 | 0.232 | 0.422 | 0 | 1 |
| SEP2 | 0.227 | 0.419 | 0 | 1 |
| CAPEXSAL | 0.118 | 0.128 | 0 | 1.427 |
| LNTA | 19.628 | 1.722 | 14.786 | 23.980 |
| DTTA | 0.237 | 0.132 | 0 | 0.627 |
| EBITSAL | 0.136 | 0.169 | −0.453 | 0.940 |
| CRISIS | 0.260 | 0.439 | 0 | 1 |
| PNDIV | 0.504 | 0.202 | 0 | 1 |
| PSDIV | 0.703 | 0.225 | 0 | 1 |
| CRECGDP | 0.042 | 0.022 | −0.01 | 0.058 |
| Panel B | ||||
| Corporation | 0.683 | 0.465 | 0 | 1 |
| Holding company | 0.098 | 0.297 | 0 | 1 |
| Individual investor | 0.152 | 0.360 | 0 | 1 |
| Institutional investor | 0.065 | 0.248 | 0 | 1 |
Panel A reports the mean, standard deviation, minimum and maximum of each variable for the total sample. Panel B reports the proportion of firms according to the identity of the controlling shareholder.
Panel B of Table 2 provides some information on the ownership structure of the firms in our sample. We report the proportion of firms whose controlling shareholder is another non-financial corporation, a holding company, an individual investor, or an institutional investor. These data underlines the important role of corporations (68.3% of firms are controlled by another non-financial firm) and the need to control for pyramid ownership structures.
Table 3 reports some descriptive statistics along with the results of the test of means comparison. Panel A in Table 3 reports the mean (standard deviation) of the variables after splitting the sample according to the corporate diversification criteria (DIV). We also report the t-test for means comparison across sub-samples. Panel B provides analogous statistics when the sample is divided according to the ownership of other companies (DIVINV).
Mean comparisons according to diversified vs. undiversified criteria.
| Diversified | Non-diversified | Mean difference | |||
|---|---|---|---|---|---|
| Mean | S.D. | Mean | S.D. | t-Statistic | |
| Panel A: description for sales diversification | |||||
| EXVALSALES | 0.053 | 0.128 | 0.653 | 0.149 | −1.06 |
| EXVALASSETS | −0.040 | 0.124 | 0.003 | 0.111 | −4.55*** |
| MTB | 1.525 | 1.043 | 2.112 | 2.498 | −3.923*** |
| DVDFC | 0.071 | 0.126 | 0.093 | 0.169 | −1.859* |
| Total obs. | 337 | 285 | |||
| Panel B: description for ownership diversification | |||||
| EXVALSALES | 0.050 | 0.122 | 0.072 | 0.162 | −1.87* |
| EXVALASSETS | −0.030 | 0.116 | −0.002 | 0.126 | −2.81*** |
| MTB | 1.552 | 1.124 | 2.203 | 2.668 | −4.23*** |
| DVDFC | 0.088 | 0.158 | 0.059 | 0.101 | 2.00** |
| Total obs. | 391 | 231 | |||
Mean and standard deviation. Panel A provides the means comparison according to the sales diversification. Panel B provides the means comparison according to the ownership diversification.
Panel A of Table 3 shows that business diversified companies have a lower value in assets and sales, which is in line with arguments supporting the existence of a discount for diversification. Thus, not surprisingly, they have higher values for lack of concentration in the investment portfolio in other companies. According to Panel B of Table 3 the diversification discount also holds for ownership diversified firms. Interestingly, the excess of voting rights over cash flow rights is significantly higher for ownership diversified firms. This result can be induced by the large shareholders’ incentives to take stakes in the ownership of other companies and to build pyramidal control structures to achieve private control benefits (Claessens et al., 2000).
Explanatory analysisEstimating the selection equations: probit estimatesIn the first stage of our analysis, we run a probit estimation of the selection equation (5), which analyzes the propensity of companies to establish unrelated corporate diversification strategies and to diversify into the ownership of other companies. We posit that the firm diversification is affected both by firm-level factors, industry-level factors, and macroeconomic factors.
Table 4 reports the estimates of the selection models. In Column 1 the dependent variable is the unrelated corporate diversification decision (DIV), and in Column 2 the dependent variable is the decision to diversify the investment portfolio of ownership of other companies (DIVINV).
Probit estimation.
| (1)DIV | (2)DIVINV | |
|---|---|---|
| Intercept | −1.5.975*** | −1.054 |
| [−4.07] | [−0.59] | |
| Firm-level factors | ||
| DFC1 | −0.533** | 0.512* |
| [−2.13] | [1.82] | |
| DVDFC | −1.207*** | 0.534* |
| [−3.01] | [1.85] | |
| LNTA | 0.253*** | 0.174*** |
| [7.26] | [3.55] | |
| DTTA | 0.260 | −2.017** |
| [0.54] | [−2.40] | |
| EBITSAL | −0.028 | −2.611*** |
| [−1.08] | [−5.43] | |
| CAPEXSAL | −0.020 | 6.73*** |
| [−1.05] | [2.64] | |
| Industry-level factors | ||
| PNDIV | 2.329*** | −0.691* |
| [5.04] | [−1.75] | |
| PSDIV | 0.576* | 0.055* |
| [1.88] | [1.86] | |
| Macroeconomic factors | ||
| CRECGDP | −2.253 | −4.845 |
| [−0.95] | [−1.42] | |
| No. obs. | 622 | 622 |
| Log likelihood | −144.58 | −171.55 |
| LR chi2(17) | 69.04*** | 42.14*** |
| Pseudo R2 | 0. 2087 | 0.1928 |
Estimated coefficients [z-statistic] of the probit estimates of Eq. (5) (first stage of the Heckman procedure). The dependent variables are unrelated diversification (DIV) and the diversification in investment (DIVINV).
The goodness of fit (proxied by the pseudo-R2 coefficient) is 0.2087 and 0.1928, respectively. As expected, larger firms have a greater propensity to diversify into different productive segments and other companies. The cash flow rights of the main shareholder (DFC1) have a negative effect on the propensity to engage in unrelated diversification but a positive effect on the ownership diversification, which is in line with the argument that when controlling shareholders participate more in the ownership, then they will have more incentives to take decisions efficiently in order to improve the performance of the core segments of the firms.
As far as the industry-level variables are concerned, PSDIV has a consistent positive effect on both types of diversification. This result, coherent with Santalo and Becerra (2008), means that the more companies are diversified in the base industry, the higher the corporate propensity to diversify. In other words, the diversification may confer competitive advantages in industries in which diversified firms have a large fraction of the market shares. Similarly, in line with Campa and Kedia (2002), our macroeconomic condition variable lacks of statistical significance on both types of diversification.
Models estimationTables 5 and 6 report the results of the estimation of Eq. (3), which analyzes the effect of the unrelated business diversification strategies and pyramidal ownership structure on firm value. The dependent variable is the estimated excess value based on sales multiples (EXVALSALES) in Table 5, and the estimated excess value based on asset multiples (EXVALASSETS) in Table 6. The goodness of fit is assessed through the Wald-X2 test of joint significance of the estimated coefficients. It can be seen that this test is always highly significant in all the estimates.
Business diversification, pyramidal ownership structure and firm value.
| [1] | [2] | [3] | [4] | [5] | [6] | [7] | |
|---|---|---|---|---|---|---|---|
| Intercept | −1.464* | −1.767* | −1.504* | −1.418* | −1.411** | −1.260** | −1.163*** |
| [−1.60] | [−1.92] | [−1.65] | [−1.80] | [−2.49] | [−2.45] | [−2.52] | |
| HERFSALES | −0.181* | −0.031 | −0.059 | ||||
| [−1.71] | [0.19] | [0.41] | |||||
| HERFSALES*SEP1 | −0.337** | ||||||
| [−2.15] | |||||||
| SEP1 | 0.428** | ||||||
| [2.04] | |||||||
| HERFSALES*SEP2 | −0.350** | ||||||
| [−2.16] | |||||||
| SEP2 | 0.155* | ||||||
| [1.85] | |||||||
| HERFSALES*DVDFC | −1.994* | ||||||
| [−1.86] | |||||||
| DVDFC | 0.903* | 1.123* | 1.269* | 0.927* | 0.961* | 1.131** | |
| [1.69] | [1.75] | [1.86] | [1.76] | [1.90] | [2.54] | ||
| ENTROSALES | −0.409*** | −0.233 | |||||
| [−1.71] | [−0.40] | ||||||
| ENTROSALES*DVDFC | −0.385*** | ||||||
| [−3.55] | |||||||
| NSEC | −0.147** | −0.079 | |||||
| [−2.23] | [1.52] | ||||||
| NSEC*DVDFC | −0.502** | ||||||
| [−2.43] | |||||||
| DFC1 | −0.681** | −0.470** | −0.697** | −0.684** | −0.692** | −0.906*** | −0.950*** |
| [−1.98] | [−2.24] | [−2.04] | [−2.09] | [−2.11] | [−2.74] | [−2.89] | |
| CAPEXSAL | 3.475*** | 3.546*** | 3.443*** | 3.412*** | 3.408*** | 3.557*** | 3.491*** |
| [7.26] | [7.34] | [7.28] | [7.52] | [7.49] | [7.94] | [7.80] | |
| LNTA | 0.128* | 0.080* | 0.078* | 0.128*** | 0.127*** | 0.129*** | 0.120*** |
| [1.81] | [1.93] | [1.91] | [3.19] | [3.17] | [3.18] | [2.98] | |
| DTTA | −1.860*** | −1.943*** | −2.070*** | −1.835*** | −1.857*** | −1.810** | −2.008*** |
| [−4.08] | [−4.15] | [−4.46] | [−4.26] | [−4.27] | [−4.18] | [−4.60] | |
| EBITSAL | 2.953*** | 2.929*** | 2.596*** | 2.790*** | 2.726*** | 2.642*** | 2.064*** |
| [6.85] | [6.70] | [5.55] | [6.72] | [6.12] | [6.24] | [4.30] | |
| CRISIS | −0.246** | −0.261** | −0.248** | −0.350*** | −0.352*** | −0.325*** | −0.326*** |
| [−2.15] | [−2.28] | [−2.19] | [−3.10] | [−3.12] | [−2.89] | [−2.92] | |
| Lambda [λ] | 0.540*** | 0.581*** | 0.517*** | 0.510*** | 0.512*** | 0.504*** | 0.504*** |
| [3.26] | [3.53] | [3.14] | [3.21] | [3.23] | [3.16] | [3.19] | |
| No. obs. | 622 | 622 | 622 | 622 | 622 | 622 | 622 |
| Wald Chi2 | 147.95*** | 152.72*** | 156.67*** | 148.01*** | 168.02*** | 150.40*** | 172.80*** |
Estimated coefficients [z-statistic] of the ordinary least squares estimates of Eq. (3) (second stage of the Heckman procedure). The dependent variable is the excess value estimated by sales multiples (EXVALSALES). See the Appendix for an explanation of the independent variables. Lambda (λ) represents the inverse Mills ratio from the first stage of the selection model. We control for time and industry effects. Wald Chi2 is the joint significance test of the coefficients.
Ownership diversification, pyramidal ownership structure and firm value.
| [1] | [2] | [3] | [4] | [5] | [6] | [7] | |
|---|---|---|---|---|---|---|---|
| Intercept | −3.618*** | −3.863*** | −3.975*** | −3.612*** | −3.452*** | −3.884*** | −3.742*** |
| [−2.99] | [−2.58] | [−4.27] | [−2.93] | [−2.47] | [−3.15] | [−2.67] | |
| HERFASSETS | −0.452* | 0.619 | 0.318 | ||||
| [−1.76] | [1.35] | [1.46] | |||||
| HERFASSETS*SEP1 | −1.300** | ||||||
| [−1.97] | |||||||
| SEP1 | 0.717** | ||||||
| [2.39] | |||||||
| HERFASSETS*SEP2 | −2.315*** | ||||||
| [−2.85] | |||||||
| SEP2 | 0.741*** | ||||||
| [2.73] | |||||||
| HERFASSETS*DVDFC | −2.959*** | ||||||
| [−2.60] | |||||||
| DVDFC | 0.979* | 1.096** | 0.938* | 1.026*** | 0.861* | 1.075** | |
| [1.84] | [2.16] | [1.87] | [2.32] | [1.94] | [2.51] | ||
| ENTROASSETS | −0.320** | 0.138 | |||||
| [−2.05] | [0.73] | ||||||
| ENTROASSETS*DVDFC | −3.332*** | ||||||
| [2.32] | |||||||
| NSEC | −0.126*** | 0.007 | |||||
| [−2.68] | [0.13] | ||||||
| NSEC*DVDFC | −0.680** | ||||||
| [−2.51] | |||||||
| DFC1 | −1.592*** | −0.951*** | −1.152*** | −1.155*** | −1.146*** | −1.072*** | −1.090*** |
| [−3.46] | [−2.72] | [−3.45] | [−3.27] | [−3.48] | [−3.64] | [−3.35] | |
| CAPEXSAL | 0.573 | 0.201 | 0.132 | 0.596 | 0.142 | 0.572 | 0.170 |
| [1.22] | [1.38] | [1.25] | [1.28] | [1.27] | [1.24] | [1.33] | |
| LNTA | 0.128** | 0.150** | 0.132* | 0.130** | 0.118* | 0.152*** | 0.131** |
| [2.37] | [2.30] | [1.84] | [2.29] | [1.86] | [2.64] | [2.03] | |
| DTTA | −0.667** | −1.188* | −1.414*** | −0.738** | −1.425** | −0.735** | −1.361** |
| [−2.08] | [−1.81] | [−2.19] | [−2.20] | [−2.24] | [−2.20] | [−2.14] | |
| EBITSAL | 3.114*** | 1.530*** | 1.535*** | 2.991*** | 1.463** | 2.811*** | 1.438** |
| [5.44] | [2.61] | [2.52] | [5.11] | [2.47] | [4.77] | [2.44] | |
| CRISIS | −0.157* | −0.375** | −0.333* | −0.168** | −0.340* | −0.200** | −0.351** |
| [−1.98] | [−2.10] | [1.92] | [−2.06] | [−2.01] | [−2.25] | [−2.07] | |
| Lambda [λ] | 0.875*** | 1.367*** | 1.379*** | 0.838*** | 1.365*** | 0.844*** | 1.369*** |
| [3.82] | [4.34] | [4.64] | [3.61] | [4.63] | [3.67] | [4.66] | |
| No. obs. | 622 | 622 | 622 | 622 | 622 | 622 | 622 |
| Wald Chi2 | 72.36*** | 78.87*** | 80.50*** | 75.70*** | 75.64*** | 73.83*** | 75.81*** |
Estimated coefficients [z-statistic] of the ordinary least squares estimates of Eq. (3) (second stage of the Heckman procedure). The dependent variable is excess value estimated by assets multiples (EXVALASSETS). See the Appendix for an explanation of the independent variables. Lambda (λ) represents the inverse Mills ratio from the first stage of the selection model. We control for time and industry effects. Wald Chi2 is the joint significance test of the coefficients.
Column 1 of Tables 5 and 6 show a clear negative relation between the degree of diversification both in sales and in assets (HERFSALES and HERFASSETS) and the measure of excess value, be it estimated either by sales or by assets multiples (EXVALSALES and EXVALASSETS). These results confirm our hypothesis H1a, according to which there is a business diversification discount in Chilean firms. In Columns 2 and 3 we provide further arguments to explain this diversification discount. As shown, when diversification measures are interacted with the separation of voting rights and cash flow rights of the largest shareholder (SEP1 and SEP2), the HERFSALES and HERFASSETS coefficients are no longer significant. This result implies that the diversification discount does not exist per se. Interestingly, the interacted variables have a negative impact on the firm value. These estimates shed some light on the possible reason of the diversification discount since the business and ownership diversification influence negatively the value of the firm when there is a divergence between the main shareholders’ voting rights and cash flow rights. Thus, the diversification strategy can be a mean used by controlling shareholder to pursue their own interests even at expense of other shareholders’ interests.
To test the robustness of our results, Columns 4 and 5 in Tables 5 and 6 report similar analyses with complementary measures of diversification. In Columns 4 and 5 we use the entropy of sales (ENTROSALES) and the entropy of assets (ENTROASSETS) as metrics of diversification. The coefficient of these variables in Column 4 is negative, which supports the diversification discount and corroborates Hypothesis H1a. Nevertheless, when we introduce the interaction of both variables with the separation of voting rights and cash flow rights (DVDCF), the diversification per se does no longer have any significant influence on the firm value. Moreover, the interacted variables (ENTROSALES and ENTROASSETS DVDCF) take on the negative and significant coefficient.
The estimates in Columns 6 and 7 of Tables 5 and 6, which report the effect of the number of industry segments in which the firm diversifies (NSEC), are robustness checks too. According to these results, the number of segments, which proxy firm diversification has a negative relation with the value of the firm. Nevertheless, once again, when interacted with DVDCF, NSEC loses the significance, and the interacted variable becomes statistically significant. It means that a possible explanation of the negative impact of diversification on the firm value has to do with the controlling shareholders using pyramidal structures for their own private benefits.
On average, our results show that the diversification discount relative to non-diversified firms in the same sector is around 31.65% (18.1% for business diversification and 45.2% for ownership diversification). This figure is higher than the results reported by Berger and Ofek (1995) and Lins and Servaes (1999, 2002), and the explanation can be related to the lower activity of the Chilean capital markets.5
First, the Chilean capital markets are significantly less active than the ones of the developed and the emerging Asian countries. Thus, the market value in Chile can reflect some overreaction related to lower market activity. Second, highly diversified companies despite opening new market shares, invest less in R&D so that they have lower levels of growth opportunities in their core activities as compared to undiversified firms (Hyland and Diltz, 2002). Third, this discount could be the result of possible private benefits of control that rise from the existence of pyramidal ownership structures, where controlling shareholders can extract other shareholders’ wealth through diversification strategies.
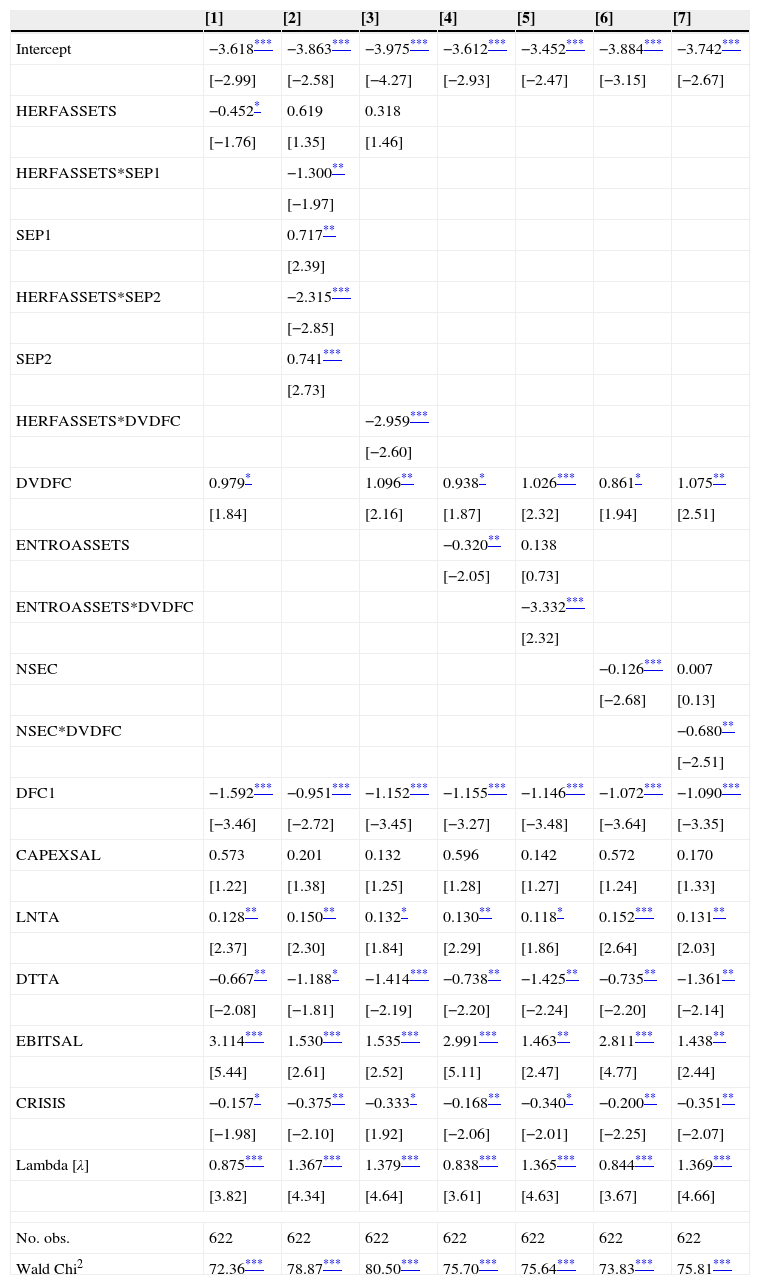
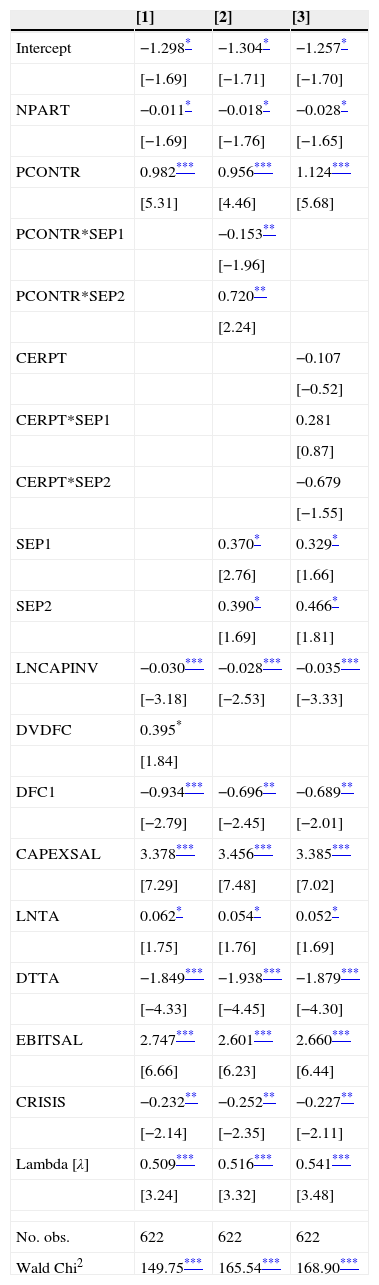
Tables 7 and 8 report the results of the estimation of Eq. (4) concerning the ownership diversification. The dependent variable is the estimated excess value based on sales multiples (EXVALSALES) in Table 7, and the estimated excess value based on asset multiples (EXVALASSETS) in Table 8. The estimates of the baseline models are reported in Column 1. We can see that NPART (the number of firms of which the base firm is a shareholder) has a negative influence on the firm value. It confirms the ownership diversification discount (Hypothesis H2a) since the higher the diversification (in the sense of number of owned firms), the lower the value of the base firm. Nevertheless, to some extent this effect can be made up for the effect of the control on the affiliated firms (PCONTR). The positive and significant effect of PCONTR must be understood as the positive view of the market when the base firm is not a minority shareholder but acquire the control of the affiliated firm.
Ownership diversification, pyramidal ownership structure and firm value.
| [1] | [2] | [3] | |
|---|---|---|---|
| Intercept | −1.298* | −1.304* | −1.257* |
| [−1.69] | [−1.71] | [−1.70] | |
| NPART | −0.011* | −0.018* | −0.028* |
| [−1.69] | [−1.76] | [−1.65] | |
| PCONTR | 0.982*** | 0.956*** | 1.124*** |
| [5.31] | [4.46] | [5.68] | |
| PCONTR*SEP1 | −0.153** | ||
| [−1.96] | |||
| PCONTR*SEP2 | 0.720** | ||
| [2.24] | |||
| CERPT | −0.107 | ||
| [−0.52] | |||
| CERPT*SEP1 | 0.281 | ||
| [0.87] | |||
| CERPT*SEP2 | −0.679 | ||
| [−1.55] | |||
| SEP1 | 0.370* | 0.329* | |
| [2.76] | [1.66] | ||
| SEP2 | 0.390* | 0.466* | |
| [1.69] | [1.81] | ||
| LNCAPINV | −0.030*** | −0.028*** | −0.035*** |
| [−3.18] | [−2.53] | [−3.33] | |
| DVDFC | 0.395* | ||
| [1.84] | |||
| DFC1 | −0.934*** | −0.696** | −0.689** |
| [−2.79] | [−2.45] | [−2.01] | |
| CAPEXSAL | 3.378*** | 3.456*** | 3.385*** |
| [7.29] | [7.48] | [7.02] | |
| LNTA | 0.062* | 0.054* | 0.052* |
| [1.75] | [1.76] | [1.69] | |
| DTTA | −1.849*** | −1.938*** | −1.879*** |
| [−4.33] | [−4.45] | [−4.30] | |
| EBITSAL | 2.747*** | 2.601*** | 2.660*** |
| [6.66] | [6.23] | [6.44] | |
| CRISIS | −0.232** | −0.252** | −0.227** |
| [−2.14] | [−2.35] | [−2.11] | |
| Lambda [λ] | 0.509*** | 0.516*** | 0.541*** |
| [3.24] | [3.32] | [3.48] | |
| No. obs. | 622 | 622 | 622 |
| Wald Chi2 | 149.75*** | 165.54*** | 168.90*** |
Estimated coefficients [z-statistic] of the ordinary least squares estimates of Eq. (4) (second stage of the Heckman procedure). The dependent variable is the excess value estimated by sales multiples (EXVALSALES). See the Appendix for an explanation of the independent variables. Lambda (λ) represents the inverse Mills ratio from the first stage of the selection model. We control for time and industry effects. Wald Chi2 is the joint significance test of the coefficients.
Ownership diversification, pyramidal ownership structure and firm value.
| [1] | [2] | [3] | |
|---|---|---|---|
| Intercept | −3.218*** | −3.063** | −3.124*** |
| [−2.53] | [−2.48] | [−2.82] | |
| NPART | −0.031* | −0.039* | −0.026* |
| [−1.66] | [−1.70] | [−1.68] | |
| PCONTR | 0.748*** | 0.859*** | 0.910*** |
| [2.93] | [2.81] | [3.21] | |
| PCONTR*SEP1 | −0.827* | ||
| [−1.93] | |||
| PCONTR*SEP2 | 1.684** | ||
| [2.04] | |||
| CERPT | −0.301 | ||
| [−1.01] | |||
| CERPT*SEP1 | 0.424 | ||
| [0.90] | |||
| CERPT*SEP2 | −0.240 | ||
| [−0.38] | |||
| SEP1 | 1.183*** | 0.894*** | |
| [3.55] | [3.10] | ||
| SEP2 | 0.920** | 0.350* | |
| [2.30] | [1.94] | ||
| LNCAPINV | −0.031** | −0.036** | −0.051*** |
| [−2.28] | [−2.29] | [−3.31] | |
| DVDFC | 0.709** | ||
| [2.14] | |||
| DFC1 | −1.383*** | −0.826** | −0.691** |
| [−2.79] | [−2.53] | [−2.21] | |
| CAPEXSAL | 0.321 | 0.528 | 0.617 |
| [1.46] | [1.12] | [1.23] | |
| LNTA | 0.113* | 0.090* | 0.112* |
| [1.91] | [1.77] | [1.87] | |
| DTTA | −1.352** | −1.597** | −1.189** |
| [−2.13] | [−2.56] | [−1.95] | |
| EBITSAL | 2.779*** | 2.350*** | 2.737*** |
| [4.58] | [3.93] | [4.52] | |
| CRISIS | −0.128* | −0.169** | −0.153** |
| [−1.80] | [−2.10] | [−1.97] | |
| Lambda [λ] | 0.856*** | 0.780*** | 0.896*** |
| [3.68] | [3.51] | [3.91] | |
| No. obs. | 622 | 622 | 622 |
| Wald Chi2 | 71.64*** | 97.42*** | 98.57*** |
Estimated coefficients [z-statistic] of the ordinary least squares estimates of Eq. (4) (second stage of the Heckman procedure). The dependent variable is excess value estimated by assets multiples (EXVALASSETS). See the Appendix for an explanation of the independent variables. Lambda (λ) represents the inverse Mills ratio from the first stage of the selection model. We control for time and industry effects. Wald Chi2 is the joint significance test of the coefficients.
We have to note that this positive relation is moderated by the level of voting-cash flow rights divergence (PCONTR SEP1 and PCONTR SEP1). Since the positive coefficient of this latter interacted variable exceeds the negative coefficient of the former one, there is a net positive effect of the separation of rights. This positive impact can be due to the internal financial organization of business groups. The firms with high divergence between voting and cash flow rights are usually parts of business groups, which enhance the functioning of internal capital markets. In these sense, Almeida and Wolfenzon (2006) suggest that, in less developed capital markets (as Chile can be), the internal capital markets attenuate the weakness of external capital markets. Our results are also in line with Buchuk et al. (2014), who find that internal capital markets inside Chilean business groups are an efficient way of resources allocation. Finally, Column 3 shows that the related sectors (CERPT) do not play any relevant role as a determinant of the effect of ownership diversification.
As a robustness check, we run the same analysis with the market-to-book ratio as a measure of firm's value (Adam and Goyal, 2008). Table 9 shows the results, which are fully consistent with the above-reported ones and corroborate the ownership diversification discount and the positive effect of the divergence between voting rights and cash flow rights.
Ownership diversification, pyramidal ownership structure and firm value.
| [1] | [2] | [3] | |
|---|---|---|---|
| Intercept | −0.094 | −0.410 | −0.411 |
| [−0.59] | [−0.39] | [−0.35] | |
| NPART | −0.076*** | −0.077*** | −0.073*** |
| [−4.17] | [−4.29] | [−4.96] | |
| PCONTR | 0.760*** | 0.894*** | 0.956*** |
| [3.48] | [3.23] | [3.30] | |
| PCONTR*SEP1 | −0.445** | ||
| [−2.20] | |||
| PCONTR*SEP2 | 0.430** | ||
| [2.05] | |||
| CERPT | −0.330 | ||
| [−1.09] | |||
| CERPT*SEP1 | 0.286 | ||
| [0.63] | |||
| CERPT*SEP2 | −0.244 | ||
| [−0.40] | |||
| SEP1 | 0.905*** | 0.949*** | |
| [3.03] | [3.39] | ||
| SEP2 | 1.04** | 0.889** | |
| [2.35] | [2.45] | ||
| LNCAPINV | −0.037*** | −0.054*** | −0.048*** |
| [−3.15] | [−3.23] | [−3.13] | |
| DVDFC | 1.824*** | ||
| [3.67] | |||
| DFC1 | −0.497** | −0.264* | −0.198* |
| [−2.03] | [−1.73] | [−1.88] | |
| CAPEXSAL | 0.505 | 0.770 | 0.820 |
| [1.36] | [1.06] | [1.56] | |
| LNTA | 0.032* | 0.035* | 0.035* |
| [1.67] | [1.74] | [1.87] | |
| DTTA | −0.521** | −0.602** | −0.394** |
| [−2.13] | [−2.41] | [−2.38] | |
| EBITSAL | 2.245*** | 2.103*** | 2.708*** |
| [5.10] | [4.74] | [4.83] | |
| CRISIS | −0.422*** | −0.431*** | −0.338** |
| [−3.40] | [−3.53] | [−2.37] | |
| Lambda [λ] | 0.144** | 0.213** | 0.101** |
| [2.27] | [2.00] | [1.95] | |
| No. obs. | 622 | 622 | 622 |
| Wald Chi2 | 211.56*** | 223.80*** | 231.79*** |
Estimated coefficients [z-statistic] of the ordinary least squares estimates of Eq. (4) (second stage of the Heckman procedure). The dependent variable is the market-to-book ratio (MTB). See the Appendix for an explanation of the independent variables. Lambda (λ) represents the inverse Mills ratio from the first stage of the selection model. We control for time and industry effects. Wald Chi2 is the joint significance test of the coefficients.
We study the effects of the corporate diversification on the value of Chilean listed firms. The research on this topic, basically focused on developed or Asian emerging countries, has documented a discount for unrelated diversification. Nevertheless, the question about to which extent this diversification discount holds in other institutional environments and the potential impact of complex ownership structures is still open.
Ownership pyramids are a control enhancing mechanism widely used to increase the dominant shareholders’ control rights over their cash flow rights. Since corporate diversification can be a decision of corporate insiders to pursue their own interests even at expense of other stakeholders’ interests, the analysis of how corporate diversification interacts with ownership structure arises as an interesting field of study.
Our study is the first to analyze the impact of the diversification strategies in an emerging market as Chile, a country with a concentrated ownership structure and relatively low legal protection of investors. We study two types of diversification: the business diversification and the ownership diversification. The business diversification refers to the firm segments in different sectors, and the ownership diversification refers to the firm holding a fraction of the ownership of other companies. Given the concentrated ownership framework of Chilean companies we study not only the relation between firm diversification and firm value but also to which extent this relation is moderated by the pyramidal ownership structure.
We analyze a sample of 83 nonfinancial companies listed in the Chilean capital markets from 2005 to 2013. Our main result is the evidence of a discount for both business and ownership diversification, which is consistent with that reported for other economic or institutional settings. Second, we find that the business diversification discount is related to the ownership structure and is due to the excess of the largest shareholders control rights. The high ownership concentration of Chilean firms, exacerbated by the use of ownership pyramids, may result in the ultimate shareholder using corporate diversification to extract private benefits. Our results point out that the pyramidal structures can be related to an inefficient use of resources and reduced value for companies.
We also find that the ownership diversification discount becomes a premium when the ownership diversification enables the control of other firms. This result lends support to the idea that the indirect control of other companies by a parent company has a positive impact on the value of the latter. Given the low activity of the Chilean capital markets, this effect can be explained by the improvement of internal capital markets that allow overcoming the limitations of external capital markets.
Our results can be interesting both for academia, practitioners, and policy makers. For academia, we provide innovative research on the joint effects of ownership structure and corporate diversification in a geographical area such as Latin America with a French civil law system and concentrated ownership structure. For practitioners and investors, we show how some corporate control and diversification issues affect the firm market valuation and, thus, we suggest the need to take them into account when assessing stock prices. Policy makers can find in our paper some clues for further regulation of the corporate control enhancing mechanisms for the creation of market value.
Our paper suggests several avenues for future research. One of the most promising ones is extending this analysis over a wide sample of emerging countries. In this way, we could gain a better understanding of the firm- and country-level factors that make diversification strategies more valuable in different legal and institutional environments. Another interesting field is studying the impact of the ultimate owner nature on the diversification premium or discount.
| Abbreviation | Variable | Definition |
|---|---|---|
| Value measures | ||
| EXVALSALES | Excess value (sales multiples) | Logarithm of the market capitalization over the sum of segment imputed values using sales multiples. |
| EXVALASSETS | Excess value (assets multiples) | Logarithm of the market capitalization over the sum of segment imputed values using assets multiples. |
| MTB | Market-to-book | (Market value of equity+book value of debt)/Book value of the assets. |
| Business diversification measures | ||
| HERFSALES | Inverse Herfindahl index of sales | Absence of concentration of sales across unrelated segments. |
| ENTROSALES | Entropy of sales | Index to measure the diversification on sales across different levels of industry aggregation. Estimated as the sum of the percentages of sales from the i-segment multiplied for the logarithm of the inverse of the percentage of sales from the i-segment. |
| HERFASSETS | Inverse Herfindahl index of assets | Absence of concentration of assets across unrelated segments. |
| ENTROASSETS | Entropy of assets | Index to measure the diversification on assets across different levels of industry aggregation. Estimated as the sum of the percentages of assets from the i-segment multiplied for the logarithm of the inverse of the percentage of assets from the i-segment. |
| NSEC | Number of segments | Number of industry segments in which the firm participate. |
| DIV | Unrelated diversification | 1 if the base firm is diversified, and zero otherwise. |
| Ownership diversification measures | ||
| NPART | Number of firms | Number of firms in whose ownership the base firm has a stake. |
| PCONTR | Control proportion | Proportion of firms that are controlled by the base firm over NPART. |
| CERTP | Related subsidiaries | Proportion of firms controlled on related industry segments over total of controlled firms. |
| LNCAPINV | Invested capital | Natural logarithm of total capital invested in other firms. |
| DIVINV | Ownership diversification | 1 if the base firm participates in the ownership of other firms, and zero otherwise. |
| DVDFC | Excess of voting rights | Voting rights minus cash flow rights of the ultimate owner of the firm. |
| DFC1 | Cash flow rights | Cash flow rights of the ultimate owner of the firm. |
| DV1 | Voting rights | Voting rights of the last owner of the firm. |
| SEP1/SEP2 | Levels of DVDFC | 1 if DVDFC is higher/lower than the mean, and 0 otherwise. |
| Firm-level control variables | ||
| CAPEXSAL | Investment ratio | Capital expenditures over sales. |
| LNTA | Size of the company | Natural logarithm of total assets. |
| DTTA | Debt | Total debt to total assets. |
| EBITSAL | EBIT margin | EBIT over sales. |
| CRISIS | Financial crisis period | 1 for 2008 and 2009, and zero otherwise. |
| Country/industry-level control variables | ||
| CRECGDP | Economic growth | GDP growth rate. |
| PNDIV | Proportion of diversified companies | Percentage of companies from the primary industry that are diversified. |
| PSDIV | Diversified sales proportion | Proportion of sales of the diversified companies over total sales of the industry. |
The authors appreciate the financial support of the Chilean Fondecyt Grant No. 11110021 and the Spanish Ministry of Science and Innovation (ECO2011-29144-C03-01) is gratefully acknowledged. Early versions of this study were presented at ENEFA 2012 and CLADEA 2012. We are grateful for the suggestions of Jose Luis Ruiz (Universidad de Chile), David Diaz (Universidad de Chile) and Carlos Maquieira Villanueva, Alisa Larson, and two anonymous referees for their comments on previous versions of this work. Any possible errors are our responsibility.
Tel.: +34 983184395.
Base company is defined as the firm that invests in the ownership of other companies.
This phenomenon, called “popular capitalism”, resulted in the privatization of several of the most important firms in stock markets.
Ownership diversification or participation in ownership is defined as the base firm participation in the ownership of other companies, which are either subsidiaries or affiliates, in both related and unrelated industrial segments.
According to the information provided by the World Bank, the average stock trading (scaled by GDP) between 2005 and 2012 was 248% in the USA, 136% for East Asian countries and 20% for Chile.
articles