


This research aims at analyzing the impact of continuous improvement and learning processes regarding efficiency and production volume in an armament manufacturer. A longitudinal case study comprising a period of six years of analysis in the company production lines was carried out. Data Envelopment Analysis (DEA) combined ANOVA test and linear regression were used. The survey results show that continuous improvement and learning projects were not enough to increase efficiency in two of the three production lines analyzed. Therefore, the variables related to Kaizen events, hours of training and experience of employees did not increase the efficiency of these lines. Moreover, the study elucidates that the production volume negatively impacts efficiency in one of the lines. With the analysis, it is possible to identify which factors are representative to increase production efficiency. Therefore, it is concluded that technology upgrade, in this context, is an important factor to be considered. The research contributed to analyse the relevance of continuous improvement actions, accumulation of knowledge and learning in an armament manufacturer. In addition, it allows managers of companies to evaluate more effectively the production process and technological evolution with a greater understanding of factors that impact on increased operational efficiency.
Continuous improvement programmes have been studied in operations management (Glover et al., 2011). This occurs because these programmes have elements that enable improvement in process performance and the use of best practices in organisations (McLean et al., 2015; Wu and Chen, 2006). However, despite the benefits presented, there are reports of a high failure rate in employment efforts for implementation of continuous improvement programmes (Easton and Jarrell, 1998; Glover et al., 2011; McLean et al., 2015).
In addition to continuous improvement, organisations use learning curves to increase operational performance and to understand the behaviour of processes (Franceschini and Galetto, 2003; Terwiesch and Bohn, 2001). Learning is useful to minimise costs of a new product insertion into the production process. Thus, a part of the research involving learning curves aims at optimising the performance of processes, improvement of the use of resources and reduction of processing costs (Stroieke et al., 2013). Studies (Levy, 1965; Li and Rajagopalan, 1997; Terwiesch and Bohn, 2001) revealed that the experience gained over time enables a company to produce more units in a particular time interval with reduced production costs.
However, despite the benefits presented by the continuous improvement and learning curve, it is observed that there is a lack of studies that measure the results obtained over time. Studies usually focus only on an optimistic approach for continuous learning and improvement programmes. Thus, this approach does not represent the reality of many organisations (McLean et al., 2015). Consequently, there is a risk of not knowing the true benefits of these programmes. In addition, the literature points out the need to develop analysis of the benefits provided by continuous improvement (Bond, 1999; Glover et al., 2011; Gonzalez and Van Aken, 2016) and learning projects (Egelman et al., 2016). The literature also reports the need to make efficiency measurements (Cook and Seiford, 2009; Kao, 2014) and production volume (Gelders et al., 1994). However, it was not possible to identify studies addressing the relationship among continuous improvement, learning, efficiency and production volume in an integrated manner.
Thus, this study conducts an investigation into an armament manufacturer. The company has an old, obsolete industrial park, and most of the machinery and technology are from the period, 1930s to 1970s. In addition, the main efficiency measurement used by an organisation is the ratio between hours of reported output and man hours. In a company, there is no robust measurement for assessing efficiency, and nor is there for evaluating the results of continuous improvement and learning programmes over time. In addition, a company has no knowledge of the impact of production volume on its efficiency, which can lead to weakly measurable investments in continuous improvement projects.
The context presented refers to difficulties in identifying the real inefficiencies in production lines. Thus, the right time to invest in new technologies is unknown. Managers consider that continuous improvement programmes are mainly responsible for company development over time. Due to the old, obsolete factories, this company accumulates high costs of maintenance, hiring of consultants, constant layout changes, tool breakage and other costs with programmes focused only on continuous improvement.
Thus, the objective of this study is to analyse the relationship among continuous improvement, learning, efficiency and volume of production in an armament manufacturer. From the study, it is possible to verify whether or not there was improvement in operational efficiency over time, considering the continuous improvement processes based on the accumulation of knowledge and learning. A research was conducted through a longitudinal case study, considering a period of six years of analysis of the company’s production lines. Combined Data Envelopment Analysis (DEA), ANOVA test and linear regression were used as analytical techniques.
The study aids managers to assess whether or not continuous improvement and learning programmes are helping to increase company efficiency. Similarly, the study contributes to knowledge by providing an explanatory model with capacity for differentiation compared to conventional methods of measuring efficiency. In addition, combined evaluation of improvement programmes can help a company move from a reactive approach to a proactive one in relation to these projects. Therefore, the research may help to identify which improvement projects are more important to increase the operational efficiency of the organisation. It is understood that the conceptual model developed can serve as a basis for other organisations to analyse the effects generated by continuous improvement and learning programmes over time.
The article is organised into five sections including this Introduction. The following section presents a theoretical overview of continuous improvement and its relationship to learning, efficiency and production volume. In addition, it shows the relationship between production volume and efficiency. Then, in Section ``Research design’’, methodological procedures that support planning and research are described. The results are presented in Section ``Analysis of results’’ and discussed in Section ``Discussion of results’’. Finally, conclusions, work limitations and suggestions for future work are discussed in Section ``Conclusion’’.
Literature reviewContinuous improvement is an activity aimed at enhancing the performance level of the entire organisation through increased changes whose main focus is on productive processes (Bessant and Caffyn, 1997; Wu and Chen, 2006). However, its management can be inappropriately conducted (Bessant et al., 2001). A simplistic interpretation of the essence of continuous improvement programmes may actually contribute to failure of these initiatives (McLean et al., 2015). Thus, despite the benefits demonstrated in continuous improvement programmes, reports of unsuccessful application attempts are recurring (Easton and Jarrell, 1998; McLean et al., 2015). In addition, continuous improvement cannot be sustained in the long term, even when programmes are initially successful (Glover et al., 2011). Lack of adequate measurement concerning programmes leads to unexpected side effects that are often harmful, which can cause premature collapse and abandonment of continuous improvement programmes (Keating et al., 1999). Thus, there is a need for developing studies and measurements regarding continuous improvement and its interrelationships (Bateman, 2005).
Relationship between continuous improvement and learning (independent variables) with efficiency (dependent variable)Continuous improvement refers to that in personal life, home life, social life and at work (Imai, 1986), and it has strategic importance for all organisations (Scott et al., 2009). Continuous improvement programmes enable scrap, rework costs, waste and non-value added activity reductions (Rungtusanatham et al., 1998). In addition, continuous improvement can improve the financial and operational performance of organisations (Grandzol and Gershon, 1997). Other benefits can be mentioned, for example, increased flexibility, agility, and hence operational efficiency (Carpinetti and Martins, 2001; Choi, 1995; Ghalayini and Noble, 1996). Efficiency improvement as an implementation effect of continuous improvement is also reported (Jorgensen et al., 2007; Readman, 2007; Tanco et al., 2012). Among continuous improvement programmes, the A3 report (Chakravorty, 2009), Training and Kaizen events can be mentioned (Farris et al., 2009; Glover et al., 2011).
An A3 report is a tool orientated to simple, rapid analysis and solution of problems, in which the most important information for the case under study are organised on a sheet of paper size A3. Such a report is structured in eight logical steps: (i) classification of the problem; (ii) decomposition of the problem into smaller parts; (iii) definition of the objective; (iv) analysis of the root cause; (v) development of countermeasures; (vi) perception of countermeasures; (vii) monitoring of processes and results; and (viii) standardisation of the successful processes (Chakravorty, 2009).
Training seeks to improve the employee ‘‘s preparation to perform the tasks (Esteban-Lloret et al., 2014). Kaizen is an event considering objective actions taken in a particular short period, seeking continuous improvement in a certain process. Normally it is undertaken in the workplace, involving operators, supervisors and managers (Imai, 1986). The actions trained are fundamental for the personnel, contributing towards implementation of the improvements in the enterprise (Martínez-Jurado et al., 2014).
Given the above, the following hypotheses regarding the relationship between continuous improvement and production process efficiency are verified:
H1a: There is a relationship between the use of A3 reports and the efficiency of the production process.
H1b: There is a relationship between Kaizen events and the efficiency of the production process.
H1c: There is a relationship between training of the production team and the efficiency of the production process.
Learning refers to improvements in the performance of individuals, groups or organisations over time as a result of experience (Grosse et al., 2015). The investment in learning must impact the development of activities performed by the workers (Diaz-Fernandez et al., 2017).
The literature on production and operations management emphasises that learning and experience can provide improved performance of the production process (Egelman et al., 2016). Nevertheless, few works provide empirical evidence of these effects (Barba Aragón et al., 2014). Thus, it is expected that the learning process, considering the experience gained over time, can improve overall performance (Farris et al., 2009), especially considering efficiency improvement.
Efficiency is considered an important measurement of the productive process because low yields reflect gaps in understanding and experience about manufacture, and are closely related to the learning process (Terwiesch and Bohn, 2001). The learning of a company may be incorporated by its people, processes, technology or organisational structure (Walsh and Ungson, 1991). In this specific case, learning generated by operators will be considered in the light of their service time on the same production line. Operational performance improves over time, as long as a work is repeatedly performed, which is attributed to experience gained, accumulated by the individuals who perform the work (Egelman et al., 2016; Grosse et al., 2015) thus, improving their experience in the execution. Given the above, the following hypothesis is verified:
H2: There is a relationship between the service time of employees (experience) on the production line and efficiency of the production process.
There are few quantitative studies at the operational level on the cumulative effects of improvement programmes over time (Filho, 2011; Keating et al., 1999; Lyu, 1996). It is observed that, operationally, the effort for continuous improvement increases productivity. However, losses from excessive increase in production volume are also observed (Elmoselhy, 2013). Thus, continuous improvement projects must be aligned with the existing demands in the market. Therefore, the maintenance of produced volumes and manufacturing flexibility are important factors to be considered. In addition, improvement actions focused on constraints (bottlenecks) in the production process lead to increased production capacity and provide conditions to absorb higher production volumes (Inman et al., 2009). Thus, the performance measurement concerning the volume produced consists of a common indicator for certain companies (Gelders et al., 1994). However, the main reason for production volume measurement is related to senior management control. In this sense, a reduced number of companies use this indicator in order to analyse problems and evaluate the effectiveness of continuous improvement programmes. Given the above, the following assumptions regarding the relationship between continuous improvement and production volume are verified:
H3a: There is a relationship between the use of A3 reports and production volume.
H3b: There is a relationship between Kaizen events and production volume.
H3c: There is a relationship between the training of the production team and production volume.
The service time of employees on the same production line can lead to a positive relationship between learning and production volume. Similarly, a low level of learning and little experience on the part of operators can result in low yield and low production rates (Terwiesch and Bohn, 2001). Thus, there is a trade-off between production volume (output) in the short term and the experience of operators (Terwiesch and Bohn, 2001).
The production process has characteristics, such as machine breakages, the process, among others. However, the learning and experience of the operators of the production process and equipment tend to increase yields in relation to production capacity over time (Terwiesch and Bohn, 2001). The importance of the causal relationship between learning and volume production is recognised by the literature, and detailed analysis is required in order to provide useful lessons for management (Terwiesch and Bohn, 2001). It is important and necessary to expand research on learning and experience in the production process (Egelman et al., 2016). For example, (Pedersen and Slepniov, 2016) show the positive influence of direct and indirect work on the production learning curve. Given the above, the following hypothesis is verified:
H4: There is a relationship between the service time of employees (experience) on the production line and production volume.
The optimal scale of production contributes to a productive organisation’s competitiveness improvement (Çelen, 2013). The output function is the relation of the production obtained from the amount of production factors used (Gremaud et al., 2002). Scale yields result from the variation in inputs used in a particular production system (Cook et al., 2014). Scale yields can be constant, increasing or decreasing. In general, researchers are concerned when returns of scale are decreasing. With decreasing returns of scale, it is considered that to increase the amount of a variable factor, the remaining quantities of other fixed factors initially present growth in production. However, after a certain amount of the variable factor is used, production may exhibit a decrease (Gremaud et al., 2002).
This phenomenon is named the law of decreasing marginal productivity. Technological development is an option to reduce the problem of decreasing yields of scale. To a certain extent, technological advances may be the only viable solution capable of preventing productive inefficiency from the attempt at a continuous increase in production. Therefore, it is understood that an increase in production volume, without proper technological development, leads to productive inefficiency. With productive resource overload, waste increases and efficiency decreases (Gremaud et al., 2002). In view of this, it is understood that there exists a relationship between the production volume and company efficiency, as an increase in output may lead to an increase, or even a reduction, in efficiency. Given the above, the following hypothesis is verified:
H5: There is a relationship between production volume and efficiency.
After this summary of the main theoretical concepts that led to the research hypothesis formulation, the details of the methodological procedures used to conduct the study is presented in the next section.
Research designThe case-based research as a methodological approach was assumed to research development. The case studies are appropriate when an in-depth understanding of the research is necessary (Dubé and Paré, 2003). A longitudinal case study, suitable for single or multiple cases, was chosen due to its potential to enhance the internal validity of the results (Voss et al., 2002). Thus, the study was conducted considering the following stages: (i) context and definition of the analysis units; (ii) design of the DEA model; (iii) definition of the DEA variables and data collection; (iv) data collection from continuous improvement projects and production volume; (v) data analysis; (v) analysis of the results; (vi) discussion; and (vii) conclusions.
Context and definition of the units of analysisThe research was conducted in the Brazilian unit of a multinational armament manufacturer. In the manufacturing process, each product is produced in equipment with a specific set of tools. During this research, three types of products manufactured in three independent lines that do not share resources were evaluated. The production lines were named C1, C2 and C3. Products are manufactured in monthly batches of each model. Thus, the monthly produced batches were considered as analysis units of research. The analysis units were considered for six consecutive years, totalling 72 batches for each product model in each production line analysed.
During the six years of analysis, no machine was purchased to increase plant capacity, because the production had no significant increase in volume due to market constraints. Continuous improvement programmes, such as Kaizen events, A3 reports and training programmes for employees were the main improvements performed in the period. Thus, data were collected from all continuous improvement projects, hours of employee training, production volumes and average service time of employees in each production line.
Design of the DEA modelFrom the literature (Jain et al., 2011), the monthly batches produced by each production line analysed was defined as the Decision Making Unit (DMU). The monthly batch consists of the total of manufactured products in the period of one month in each production line. The relative efficiency of each DMU is defined as the ratio of the weighted sum of its products (outputs) to the weighted sum of inputs needed to generate them (inputs) (Cook et al., 2014). The equations that represent the DEA model used in the analysis can be found in Appendix 1 – Part 1.
The types of efficiency by the DEA were calculated: (i) standard efficiency; (ii) inverted frontier; and (iii) compound efficiency (Yamada et al., 1994). For this analysis, compound efficiency was used, which consisted of a mean between the DMU ‘‘s with best and worst performances (Yamada et al., 1994). The inverted frontier of technical efficiency or IDEA evaluates the inefficiency of a DMU constructing a frontier constituted of units with the worst managerial practices (Entani et al., 2002). For calculation of the inefficiency frontier, an exchange is made from inputs to outputs and vice versa in the original DEA model, equation showed in Appendix 1 – Part 2. The compound technical efficiency is an aggregate index, which corresponds to the composition between standard efficiency and inverted frontier efficiency (Mello et al., 2008), as can be seen in the equation showed in Appendix 1 - Part 3. For a DMU to have maximum compound technical efficiency, it needs to have good performance at the standard frontier and not have good performance at the inverted frontier (Mello et al., 2008). The inverted efficiency has been used for analyses in the operations management field (e.g. Barbosa et al., 2017; Gilsa et al., 2017; Piran et al., 2016).
For greater rigor in assessment, compound efficiency is used, given that the worst performers are also included in the metric. For design of the DEA model, the authors had the support of company’s professional experts (Jain et al., 2011; Park et al., 2014), considering their experience, knowledge of the production process and support condition in the research development.
The team specialised in the process compromised production engineers in the product and process areas. Besides these, a ballistic technician also provided research support. The experts helped with data collection, definition of the attributes to be considered, and the definition of the variables to be used in the DEA model.
Definition of DEA variables and data collectionData were collected directly from the database of the company ‘‘s management system and production monitoring worksheets. This collection type reduces the possibility of perception bias by operators and/or managers. The analyses comprise 72 DMUs for each production line, as follows: (i) 12 DMUs from 2007; (ii) 12 DMUs from 2008; (iii) 12 DMUs from 2009; (iv) 12 DMUs from 2010; (v) 12 DMUs from 2011; and (vi) 12 DMUs from 2012. The total number of DMUs of the three lines (C1, C2, C3) are 216 DMUs.
The analysis was independently performed, i.e., each production line had only one type of product without sharing resources among the lines. The criteria for verification of the degree of importance of each product type were: gain (price – totally variable cost) (Inman et al., 2009) and production volume. This procedure allowed the identification of the most significant products aimed at restricting the universe of analysis.
In order to determine the amount of inputs and outputs, the criterion used was that the number of DMU should be at least three times greater than the sum of the number of inputs and outputs (Golany and Roll, 1989). In addition, the variable selection procedure named Stepwise was used to increase the discriminatory power of DMUs (Wagner and Shimshak, 2007). Table 1 shows the variables. For definition of the inputs, the manufacturing time and the main raw materials in the process were considered (Cook et al., 2014). In an armament manufacturer, the main material inputs are: cases, lead, gunpowder, tools and fuse. The output was defined as the quantity of manufactured products (Cook et al., 2014), in this case, the amount of loaded and empty cartridges.
Variable final list of Production Process.
| Variable | Description/unit measure (a batch production of a particular loaded cartridge during a period of one month) | Theoretical base | Function at model |
|---|---|---|---|
| Manufacturing time | Consists of time taken in hours for a batch production of a particular loaded cartridge during a period of one month (hrs). | (Jain et al., 2011; Park et al., 2014) | Input1 |
| Case | It represents the total number of cases consumed for a batch production of a particular loaded cartridge during a period of one month (units). | (Cook et al., 2014; Jain et al., 2011; Park et al., 2014) | Input2 |
| Lead | It represents the total number of kilograms of lead consumed during a batch production of a particular loaded cartridge during a period of one month (kg). | Input3 | |
| Gunpowder | It represents the total number of gunpowder consumed during a batch production of a particular loaded cartridge during a period of one month (kg). | Input4 | |
| Tool | It represents the total number of tools consumed during a batch production of a particular loaded cartridge during a period of one month (units). | Input5 | |
| Fuse | It represents the total number of fuse consumed during a batch production of a particular loaded cartridge during a period of one month (units). | Input6 | |
| Loaded cartridge | It represents the total number of cartridges produced during a batch production of a particular loaded cartridge during a period of one month (units). | (Cook et al., 2014; Jain et al., 2011) | Output1 |
| Empty cartridge | It represents the total number of cartridges produced during a batch production of a particular empty cartridge during a period of one month (units). | M(Cook et al., 2014; Jain et al., 2011) | Output2 |
The VRS (Variable Returns Scale) model was used due to having no proportional relationship between outputs and inputs. Finally, orientation for input was used. The orientation for input is recommended in this case, because the resources used in the process (inputs) are more controllable than outputs, which depend on market demand, for example. In this case, a reduction in the use of inefficient unit resources is proposed (Hamdan and Rogers, 2008).
Data collection of continuous improvement projects, learning and production volumeInformation regarding continuous improvement projects, learning and volume of production conducted over the analysed period were collected and divided by production line (Table 2). Among the continuous improvement projects, the total numbers of A3 reports, Kaizen events and hours of training were assessed. Analysis of learning was defined to consider only the employee experience, considering the average service time on the line. The total sum of components produced over the six years was calculated for the volume of production.
Number of variables used for the C1, C2 and C3 Lines during the analysed period.
| Relationship | Studied variables | C1Line | C2 Line | C3 Line |
|---|---|---|---|---|
| Continuous improvement | Number of A3 reports | 5 | 10 | 5 |
| Number of Kaizen events | 9 | 42 | 38 | |
| Training hours | 77.5 | 65.5 | 63.5 | |
| Learning | Operator service time (in years) on the line | 6.06 | 5.67 | 4.97 |
| Production volume | Components produced per month | 44,963,200 | 33,516,304 | 18,936,091 |
In the next section, the technical procedures employed for the analysis and evaluation of the data collected will be shown.
Data analysisThe data analysis started with the evaluation of the results obtained through DEA. At this stage, the efficiencies of DMUs were evaluated. To complement this research, the ANOVA test for each production line was used. With this analysis, it was possible to verify whether or not there was difference in efficiency scores per production line in each year analysed. In addition, a multiple linear regression test was performed in order to evaluate the relationship of the hypotheses tested. A p-value lower or equal to 0.05 (5%) was established as the level of significance. In the next section, the analysis of the results will be presented.
Analysis of resultsInitially, the efficiency of each DMU was calculated. Due to the high number of DMUs (216), the individual efficiencies are listed in Appendix 3. Afterwards, the mean annual efficiency per line (C1, C2 and C3) was found. This mean allows indication of the relation of these with the variables: Continuous Improvement, Learning and Production Volume. Subsequently, the ANOVA test was performed aimed at verifying whether there is a difference between the annual average efficiency scores obtained through DEA, which comprises the analysis period. Table 3 shows the efficiency average for each year and the results of the ANOVA test.
Annual average of DEA efficiency, and ANOVA of Lines C1, C2 and C3.
| Year | Annual average of DEA efficiency | ||
|---|---|---|---|
| C1 Line | C2 Line | C3 Line | |
| 2007 | 0.5010 | 0.5123 | 0.4964 |
| 2008 | 0.5011 | 0.5047 | 0.5011 |
| 2009 | 0.4996 | 0.5010 | 0.5075 |
| 2010 | 0.5006 | 0.5032 | 0.5198 |
| 2011 | 0.5004 | 0.4983 | 0.5287 |
| 2012 | 0.5011 | 0.5048 | 0.5259 |
| Standard deviation | 0.00232 | 0.00145 | 0.02003 |
| F (ANOVA) | 0.776 | 1.896 | 8.104 |
| Significance (p-value) | 0.570 | 0.107 | 0.000* |
The average efficiency of the C1 Line indicated low variability. The ANOVA test confirmed that the difference between the averages of each year were not statistically significant (p-value = 0.570). The results show evidence that the variables related to continuous improvement, learning and production volume had no significant effect on increased C1 Line efficiency over time. During this period, the C1 Line had the lowest amount of improvements of Kaizen events (9 projects) and A3 reports (5 projects) types compared to C2 and C3. However, it was the one that had the highest average of employee service time (6.06 years), the largest number of training hours (77.5 h) and the largest production volume (44,963,200 units). Furthermore, it is in line with its newer equipment compared to that of the other production lines.
For the C2 Line, the ANOVA test confirmed that the difference between means was not significant (p-value = 0.107). The C2 Line had 42 projects of Kaizen events and 10 projects of A3 reports for the period (a greater number of improvement projects compared to the C1 and C3 Lines). In addition, a total of 65.5 h of training was carried out and the volume of production was 33,516,304 units. The C2 Line is the production line with equipment in the worst condition, that is, compared to that of the C1 and C3 Lines. Experts pointed out that this is the line with the highest rate of machine maintenance, extra hours and rework.
The average compound efficiency of each year of the C3 Line showed greater variability compared to the others. The ANOVA test confirmed that the difference between the means of the C3 Line was statistically significant (p-value = 0.000). This finding indicates improved efficiency over time. In the C3 Line, a total of 38 Kaizen project events, 5 projects of A3 reports and 63.5 h of training were performed. However, C3 is the line with the least service time of employees (4.97 years) and the lowest production volume (18,936,091 units). According to experts, this is the line with the best equipment conservation status among the three lines surveyed.
Based on the results, it was observed that only the efficiency of the C3 Line improved over time, indicating best operational practices and a positive influence of continuous improvement projects, learning and volume production on efficiency. In addition, there were indications that the variables studied had no effect on the efficiency of the C1 and C2 Lines. However, in order to accept or to refute the research hypotheses, the results related to multiple linear regression are analysed. Based on this analysis, it was possible to test the research hypotheses.
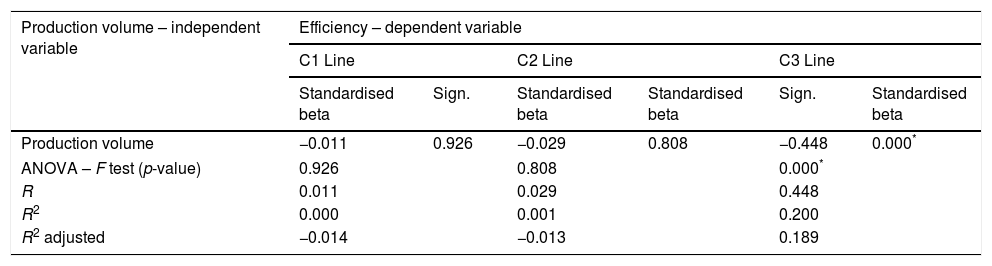
Relationship analysis among continuous improvement, learning and efficiencyTable 4 shows the results of multiple linear regression with analysis of the independent influence of the variable, related to continuous improvement and learning, on the dependent efficiency variable for Lines C1, C2 and C3. In Table 4, the dependent variable (Efficiency) corresponds to the general mean (2007–2012) of the efficiencies per line (C1, C2, C3). The independent variables correspond to the general total of each variable related to the period under analysis. The adjusted values of R, R2 and R2 represents the linear regressions of the efficiencies against the four independent variables.
Relationship between continuous improvement, learning and efficiency.
| Continuous improvement and learning – independent variable | Efficiency – dependent variable | |||||
|---|---|---|---|---|---|---|
| C1 Line | C2 Line | C3 Line | ||||
| Standardised beta | Sign. | Standardised beta | Sign. | Standardised beta | Sign. | |
| Number of A3 reports | −0.023 | 0.863 | −0.074 | 0.537 | −0.103 | 0.297 |
| Number of Kaizen events | −0.011 | 0.936 | 0.151 | 0.220 | 0.337 | 0.010* |
| Training hours | 0.083 | 0.517 | 0.050 | 0.671 | −0.043 | 0.677 |
| Service time of employees | 0.091 | 0.477 | 0.211 | 0.092 | 0.440 | 0.000* |
| ANOVA – F test (p-value) | 0.857 | 0.172 | 0.000* | |||
| R | 0.139 | 0.299 | 0.610 | |||
| R2 | 0.019 | 0.090 | 0.373 | |||
| R2 adjusted | −0.039 | 0.035 | 0.335 | |||
The C1 and C2 Lines are not statistically significant in the ANOVA test, according to the result of the F test (p-value = 0.857, p-value = 0.172). In this case, the independent variables had no significance for the efficiency of the two production lines. The results complement the evaluations previously carried out. Thus, the results obtained in the multiple linear regression test indicate that the variables related to continuous improvement and learning had no significant influence (p-value >0.05) on the result for the efficiency of the C1 and C2 Lines, that is, continuous improvement and learning did not contribute to improvements in efficiency in the case studied.
It is observed, for example, that the C2 Line had the highest amount of Kaizen events and A3 reports projects compared to the C1 and C3 Lines. However, the programmes did not result in significant efficiency improvement. In summary, the data analyses showed no significant results compared to the continuous improvement and learning variables with efficiency for the C1 and C2 Lines.
Line C2 obtained a greater quantity of Kaizen projects and A3 reports in relation to Lines C1 and C3. However, these aspects did not result in a significant improvements in efficiency. In the same manner, the variables: number of A3s and hours of training did not show statistical significance in relation to the efficiency of any of the three lines analysed. This finding shows signs that these investments contributed only to keeping the lines running, without contributing to increased efficiency.
The C3 Line showed statistical significance in ANOVA, F (p-value = 0.000). The standardised regression coefficients indicated that the service time of employees (β = 0.440, p-value = 0.00) and the total number of Kaizen (β = 0.337, p-value = 0.010) had a significant, positive influence on the efficiency of Line C3. This shows that Kaizen events performed contributed to improve C3 Line efficiency of the production process. R2 for the C3 Line was 0.373, i.e., the sum of the independent variables explains 37.3% of the variance of the dependent variable (efficiency). It is observed that the C3 Line, even with the shorter service time of employees (4.97 years) had a positive and significant results in relation to learning and increased efficiency. This shows that service time contributed to improve C3 Line efficiency of the production process. Given the situation confirmed by analysis, it is concluded that variables, service time of employees (learning) and total number of Kaizen events (continuous improvement) had a significant influence on the C3 Line efficiency. Thus, unlike what was observed in Lines C1 and C2, it is noted in Line C3 that the continuous improvement and learning contributed to the improved efficiency. Section 4.4 (summary of results) presents the results of each hypothesis tested.
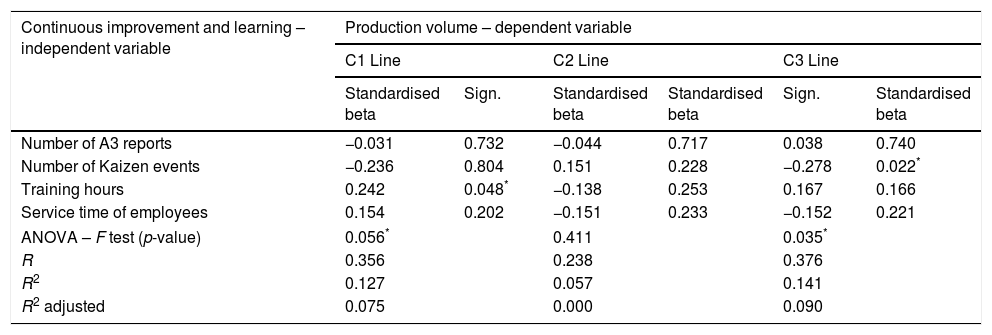
Relationship analysis among continuous improvement, learning and production volumeIn this section analysis concerning the relationship between continuous improvement, learning and production volume will be presented. Thus, Table 5 shows the results of multiple linear regression with influence analysis of the independent variables related to continuous improvement and learning on the dependent variable of production volume for the three production lines. In Table 5, the dependent variable (Production Volume) corresponds to the total sum of the production (2007–2012) in each line analysed (C1, C2, C3). The independent variables correspond to the general total of each variable in relation to the period analysed. The adjusted values of R, R2 and R2 represent the linear regressions of the efficiencies against the four independent variables.
Relationship among continuous improvement, learning and production volume.
| Continuous improvement and learning – independent variable | Production volume – dependent variable | |||||
|---|---|---|---|---|---|---|
| C1 Line | C2 Line | C3 Line | ||||
| Standardised beta | Sign. | Standardised beta | Standardised beta | Sign. | Standardised beta | |
| Number of A3 reports | −0.031 | 0.732 | −0.044 | 0.717 | 0.038 | 0.740 |
| Number of Kaizen events | −0.236 | 0.804 | 0.151 | 0.228 | −0.278 | 0.022* |
| Training hours | 0.242 | 0.048* | −0.138 | 0.253 | 0.167 | 0.166 |
| Service time of employees | 0.154 | 0.202 | −0.151 | 0.233 | −0.152 | 0.221 |
| ANOVA – F test (p-value) | 0.056* | 0.411 | 0.035* | |||
| R | 0.356 | 0.238 | 0.376 | |||
| R2 | 0.127 | 0.057 | 0.141 | |||
| R2 adjusted | 0.075 | 0.000 | 0.090 | |||
The C1 Line has statistical significance in the ANOVA test, F (p-value = 0.056). For the C1 Line, the p-value result was slightly above the cut-off. However, the result was considered significant with a cutting point as a parameter used in social research (p-value ≤ 0.10). The R2 evaluation of C1 Line was 0.127, thus, the sum of independent variables explains 12.7% of the dependent variable variance. The standardised regression coefficients indicated that the total training time had a significant, positive influence on production volume of C1 Line (β = 0.242, p-value = 0.048). Thus, it is understood that the learning contributed positively to raising the production volume in Line C1.
The other variables (Number of A3 Reports, Number of Kaizen Events, Service Time of Employees) did not contribute to improvement in the production volume of Line C1. In this manner, the investments made had no effect. When confronted with the results, the company specialists highlighted that the continuous improvement may have contributed to avoiding a fall in the line ‘‘s production volume.
The C2 Line had no statistical significance in the ANOVA test, F (p-value = 0.411), indicating that the variables related to continuous improvement and learning did not affect the volume of production, that is, the investments made over time did not bring the expected effect. Thus, it is understood that the learning and continuous improvement did not contribute to raising the production volume in Line C2.
The C3 Line has statistical significance in the ANOVA test, F (p-value = 0.035). For the C3 Line, R2 was 0.141, indicating that the sum of the independent variables explains 14.1% of the variance of the dependent variable. For the C3 Line, the total number of Kaizen events had a significant, negative influence in relation to the production volume (β = −0.278, p-value = 0.022). In other words, the continuous improvements caused a fall in the production volume of Line C3. This result was unexpected, and, for this reason, discussed with the company specialists assisting the research. According to the process experts, as the company possesses out-of-date technology, the initiatives of Kaizen events to improve the production volume resulted in an increase in the production of faulty products, which adversely affected the production volume on the entire line. Thus, it was perceived that instead of performing Kaizen events to raise the production volume, the company needed to invest in a technological upgrade. Another aspect pointed out by the company specialists was that the holding of Kaizen events requires that production on the line be halted, that is, not producing. Thus, the stoppage time to cater for the Kaizen events harmed production volume.
It is observed that the variable on service time of employees (learning) was not significant in any of the three production lines. In other words, the service time of employees (learning) did not contribute to a rise in production volume in the C3 Line over time. Section ``Summary of results’’ shows the summarised results of each hypothesis tested. After the analysis of the variables related to continuous improvement and volume of production, analysis results relating volume of production and efficiency concerning Lines C1, C2 and C3, will be presented.
Relationship analysis between efficiency and production volumeThis section presents the analysis regarding the relationship between efficiency and production volume. In this sense, Table 6 presents the results of simple linear regression with influence analysis of the volume production independent variable on the efficiency dependent variable for C1, C2 and C3 Lines. In Table 6, the dependent variable (Efficiency) corresponds to the general mean of efficiency (2007–2012) per line (C1, C2, C3). The independent variable (Production Volume) corresponds to the total sum (2007–2012) of the production volume attained on each line (C1, C2, C3).
Relationship between efficiency and production volume.
| Production volume – independent variable | Efficiency – dependent variable | |||||
|---|---|---|---|---|---|---|
| C1 Line | C2 Line | C3 Line | ||||
| Standardised beta | Sign. | Standardised beta | Standardised beta | Sign. | Standardised beta | |
| Production volume | −0.011 | 0.926 | −0.029 | 0.808 | −0.448 | 0.000* |
| ANOVA – F test (p-value) | 0.926 | 0.808 | 0.000* | |||
| R | 0.011 | 0.029 | 0.448 | |||
| R2 | 0.000 | 0.001 | 0.200 | |||
| R2 adjusted | −0.014 | −0.013 | 0.189 | |||
The C1 and C2 Lines were not statistically significant in the ANOVA test according to F, respectively (p-value = 0.926, p-value = 0.808), indicating that production volume has no effect on the efficiency of these production lines. The C3 Line was statistically significant (p-value = 0.000 and β = −0.448).
The standardised regression coefficients indicated that the production volume has a significant, negative influence on the efficiency of Line C3. However, the C3 Line showed R2 of 0.200, indicating that the independent variable (production volume) explains 20% of the variance of the dependent variable (efficiency). The study showed that the C3 Line had the lowest volume of production during the six years of analysis. However, it was the only line that had a significant influence on efficiency due to the increased production volume. Therefore, it can be inferred that the increased volume in the C3 Line led to reduced efficiency.
The increased production volume without proper technological development may lead to productive inefficiency. There are indications that overload on the C3 Line contributed to increased waste and reduced efficiency. According to the experts consulted, the C3 Line had no technological upgrade process during the analysis period. Also, a reduction in efficiency due to the volume increase was empirically observed. Also, it is emphasised that the main inputs to be consumed in excess during the volume increase are the inputs 2 (case) and 3 (lead). One of the reasons is concerned with a lack of time and the pressure to meet production goals imposed on employees. With increased volume, settings and adjustments are neglected in order not to allow machine downtime. This approach increases the index of tool breakage and the amount of scrap.
Equipment strength and durability of the C3 Line are other effects noted by process experts. The increase in volume contributed to a greater number of problems with machinery, such as wear of axles, bushes and devices. Thus, equipment has slack and vibration, favouring tool breakage and the generation of scrap. Depending on the type of breakage, there may be a misalignment of machine bushes, especially in double-effect type presses. These conditions contribute to the incidence of new operational problems. Besides the wear problem, there is a risk in not stopping equipment for maintenance or lubrication due to absence of time. This practice also contributes to breakage and waste.
The process experts also highlighted employee satisfaction as a relevant issue. With the excessive increase in production volume, the operational problems with machinery and equipment multiply. This effect leads to a high overtime incidence, and also employee fatigue. In some cases, it generates resignation requests, forcing the company to hire new operators. However, newly hired operators take time to reach the level of productivity and experience required. Such change also contributes to reduced efficiency. Moreover, the process of fatigue generated by operational problems and excessive overtime leads employees to neglect settings and adjustments, thus increasing tool breakage and generation of scrap.
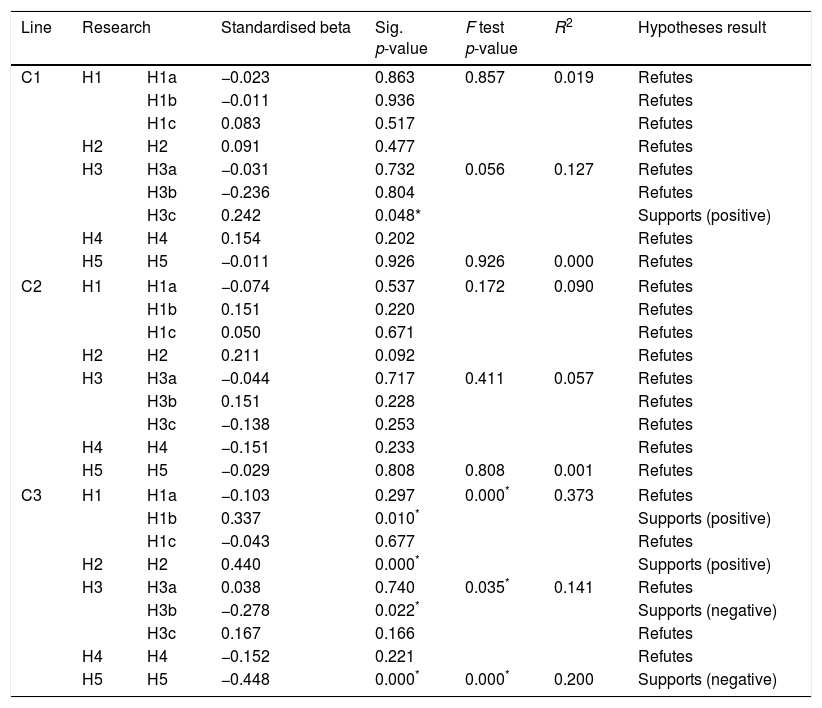
Summary of resultsThe results of the multiple linear regression test can answer the hypotheses of tested research. The synthesis of hypotheses tested is presented in Table 7.
Summary of hypotheses results.
| Line | Research | Standardised beta | Sig. p-value | F test p-value | R2 | Hypotheses result | |
|---|---|---|---|---|---|---|---|
| C1 | H1 | H1a | −0.023 | 0.863 | 0.857 | 0.019 | Refutes |
| H1b | −0.011 | 0.936 | Refutes | ||||
| H1c | 0.083 | 0.517 | Refutes | ||||
| H2 | H2 | 0.091 | 0.477 | Refutes | |||
| H3 | H3a | −0.031 | 0.732 | 0.056 | 0.127 | Refutes | |
| H3b | −0.236 | 0.804 | Refutes | ||||
| H3c | 0.242 | 0.048* | Supports (positive) | ||||
| H4 | H4 | 0.154 | 0.202 | Refutes | |||
| H5 | H5 | −0.011 | 0.926 | 0.926 | 0.000 | Refutes | |
| C2 | H1 | H1a | −0.074 | 0.537 | 0.172 | 0.090 | Refutes |
| H1b | 0.151 | 0.220 | Refutes | ||||
| H1c | 0.050 | 0.671 | Refutes | ||||
| H2 | H2 | 0.211 | 0.092 | Refutes | |||
| H3 | H3a | −0.044 | 0.717 | 0.411 | 0.057 | Refutes | |
| H3b | 0.151 | 0.228 | Refutes | ||||
| H3c | −0.138 | 0.253 | Refutes | ||||
| H4 | H4 | −0.151 | 0.233 | Refutes | |||
| H5 | H5 | −0.029 | 0.808 | 0.808 | 0.001 | Refutes | |
| C3 | H1 | H1a | −0.103 | 0.297 | 0.000* | 0.373 | Refutes |
| H1b | 0.337 | 0.010* | Supports (positive) | ||||
| H1c | −0.043 | 0.677 | Refutes | ||||
| H2 | H2 | 0.440 | 0.000* | Supports (positive) | |||
| H3 | H3a | 0.038 | 0.740 | 0.035* | 0.141 | Refutes | |
| H3b | −0.278 | 0.022* | Supports (negative) | ||||
| H3c | 0.167 | 0.166 | Refutes | ||||
| H4 | H4 | −0.152 | 0.221 | Refutes | |||
| H5 | H5 | −0.448 | 0.000* | 0.000* | 0.200 | Supports (negative) | |
Regarding the relationship between continuous improvement, learning and efficiency, based on the results of Table 7, the H1a H1b, H1c and H2 hypotheses were refuted for the C1 and C2 production lines. This indicates that the variables regarding continuous improvement and learning had no relation with efficiency over time. The research hypothesis of a relationship among continuous improvement, learning and efficiency was supported, in part, on the C3 Line. Regarding continuous improvement, the number of Kaizen events, considering H1b hypothesis was supported (β = 0.337, p-value = 0.010). For learning, long service of employees, H2 was supported (β = 0.440, p-value = 0.00). This indicates that Kaizen events and the long service of employees variables on the production line helped to increase the C3 Line efficiency over time.
Concerning the relationship among continuous improvement, learning and volume of production, the hypotheses were supported in part for the C1 and C3 Lines. In the C1 Line, the variable that showed a positive relationship with the volume of production was H3c – hours of training (β = 0.242, p-value = 0.048). This indicates that the increase in hours of training reflects positively for increase the production volume. In the C3 Line, it is observed a negative relationship between number of Kaizen events and volume of production (H3b, (β = −0.278, p-value = 0.022)). This reveal that the increased in the number of Kaizen events reflects in a reduction in the volume of production. This result presents evidence that the increased volume does not allow sufficient time to perform Kaizen projects. Regarding the C2 Line, all hypotheses have been refuted (H3a, H3b, H3C and H4) indicating that the variables related to continuous improvement and learning have no relation to the production volume of the C2 Line.
Regarding the relationship between efficiency and production volume, the results for the C1 and C2 Lines showed no relation, denying H5. The H5 hypothesis research was supported for the C3 Line (β = −0.448, R2 = 0.200, p-value = 0.000). However, the relation was negative with a negative Beta. The result indicates that the increase in production volume produces a reduction in the efficiency of C3. However, the relationship explains only 20% of the variance of the dependent variable.
Discussion of resultsThis work contributed to the performance of an in-depth analysis of relationships among continuous improvement, learning, efficiency and volume of production in an armaments company. The use of Data Envelopment Analysis (DEA) was an effective way to evaluate the productive efficiency in the company studied, contributing to an adequate assessment of the improvement projects carried out over time. Data Envelopment Analysis (DEA) is among the main suggested techniques for monitoring, in real-time, the operational performance of manufacturing systems (Esmaeilian et al., 2016).
Through this examination, it is possible to alert the manager about relevant points of the production process that require actions to improve performance. Thus, from this study, it was possible to provide a robust model to support decision-making. Thus, it becomes possible to evaluate decisions related to investments in improvement projects, technological upgrades, training, service time of employees and the impact of the production volume on the manufacturing process.
The research also contributed to analysis as to whether or not there was improvement in company operational efficiency over time, considering continuous improvement processes based on the accumulation of knowledge and learning. However, the result indicated that only one of the production lines (C3) showed evolution of efficiency over time, indicating a positive impact of Kaizen event projects and service time of employees. However, these variables were not significant to enhance the efficiency of the C1 and C2 Lines.
The empirical findings suggested that the relationships between the independent variables, continuous improvement and learning, and the dependent variables, efficiency and production volume, are mostly weak in Lines C1 and C2. This suggests that others factors might be driving variation in efficiency and volume production. Considering this results and the discussions with company managers, it can be inferred that the obsolescence and conservation state of the lines had the greatest impact related to continuous improvement projects, suggesting that investment in technological upgrades can be a viable alternative to the operation.
Continuous improvement is important as a component of business strategy, aiming at maintaining or increasing competitive advantage (Carpinetti and Martins, 2001). However, this research aligns with literature reports (McLean et al., 2015) that show a high failure rate in its use. Another contribution of the study is to show empirical evidence from an in-depth case study about obtaining, or not, benefits from the use of continuous improvement and learning curves in the company. The need to seek this empirical evidence is mentioned by (Farris et al., 2009; Pedersen and Slepniov, 2016).
The survey identifies which continuous improvement variables are related to the efficiency and production volume. In this sense, the study indicated that Kaizen event projects and service time of employees represent the most relevant variables for increased efficiency in only one of the lines studied (C3 Line). Regarding volume of production, the hours of training were important for the C1 Line. On the other hand, the number of Kaizen had a significant, negative relationship in the C3 Line. In addition, the volume of production has no statistical significance compared to the C2 Line efficiency.
The impact of production volume on efficiency was significant only in the C3 Line, indicating that such an increase is a reduction in efficiency. The C3 line, even with better efficiency, suffered losses in this issue due to operating on an inefficient scale. By judging the evidence, it can be also concluded that the C2 Line, considering the high concentration of improvement actions in the period, was not statistically significant in any of the proposed relationships.
In this sense, the work also contributed to alerting the manager concerned to the limitations in which the company is subject in terms of maintaining an old, obsolete industrial park. This condition can impose a limit on increased efficiency and competitive advantage of the company. The study also found that the concentration of investments focused on continuous improvement and learning is necessary, but not sufficient to increase operational efficiency. Investments in technological upgrades should be included in business strategy as an important way to increase efficiency and competitiveness.
Another contribution of this research is the longitudinal efficiency assessment compared to continuous improvement and learning programmes. Previously, the company had no knowledge of the real importance of these programmes. However, the manager can evaluate their impact on efficiency and production volume, complementing the current indicators used in the company.
It is also noted that there is a possibility of integrated evaluation of continuous improvement, learning, efficiency and volume production. This assessment provides the manager a wider perspective from the operational point of view. This contributes to the assertiveness of decisions related to investments in improvement, machinery purchase, consulting hours, among others.
Many companies have found that it is extremely difficult to sustain continuous improvement in the long term, even when programmes are initially successful (Glover et al., 2011; Keating et al., 1999). The lack of feedback accounting in relation to projects leads to unexpected side effects that are often harmful, which can cause premature collapse and abandonment of initiatives. So, in these terms, the study contributed an explanatory model for such a condition. Therefore, the model does not explain all the variables related to company efficiency. Nevertheless, it provides an important contribution to orientate manager decisions.
ConclusionsBased on the results, it is concluded that the use of investments, only focused on actions related to continuous improvement, is insufficient to increase company efficiency. However, there are signs that investment in technology upgrades can significantly contribute to increasing operational efficiency of the organisation. The information obtained in this study contributes to the development of new projects aimed at increasing efficiency and production volume. Moreover, it is observed that the continuous improvement process and learning effects were not observed in all the production lines analysed. However, it can be inferred that such projects are not sufficient for efficiency increase.
The study offers the opportunity for new research on the evolution of efficiency over time in manufacturing companies, contributing to the impact assessment of projects or changes in production processes. Future research can be developed considering the possibility of applying relationships between continuous improvement, learning, efficiency and volume of production in other companies, in different contexts. Therefore, the work can contribute to assessment of all the production units of the organisation, verifying the main variables that represent impacts on production efficiency. For the study, there is the possibility of linear regression to be used to assess the influence of each one of the inputs used in relation to learning and continuous improvement projects.
The following are Supplementary data to this article: