


This work adds to the debate on corporate governance regulations and its effects on performance and firm value. The paper empirically tests whether there is a significant price reaction to corporate governance announcements following the publication of the Aldama Code of Best practice (2003) in Spain. In particular, news announcements are classified according to the code principles to distinguish among different dimensions of corporate governance and have a better understanding of investors’ reaction. Results show first, that investors react to this kind of practices, second, that the sign of their reaction depends crucially on the nature and extension of the recommendation and finally that firms that disclose more do not enjoy higher market prices or return on the medium-long term.
Corporate governance structure helps to solve agency problems inside organizations (Hermalin and Weisbach, 2003). The managerial power view of governance suggests that certain arrangements are associated with managerial rent extraction. Accordingly, listed firms are prompted to follow good governance practices to mitigate corporate risks (Werder et al., 2005). Codes of best practice (Codes) are considered to promote governance quality (Shleifer and Vishny, 1997). Provided stock market functions correctly, it should monitor compliance with Codes and adjust capital allocation accordingly (MacNeil and Li, 2006).
However, governance choices are endogenously decided and value maximizing decisions for one firm may not serve another. Therefore, the relationship between governance choices and shareholder value is ambiguous and may explain the mixed empirical evidence of previous literature (Larcker et al., 2011). One way to overcome this reverse causality problem is to analyze short term market reaction to recently passed corporate governance regulations (Hermalin, 2010; Larcker et al., 2011). Since only firms whose corporate governance do not comply with the new regulation would need to make changes, stock market reaction to these changes will give a direct estimate of the value effect associated to corporate changes discarding alternative explanations (Kruger, 2015).
This paper relates to the analysis of new corporate governance regulations impact on value (Larcker et al., 2011; Bebchuk et al., 2013; Armstrong et al., 2014) and also to Code adoption effects on share value (Black et al., 2006; Goncharov et al., 2006; Bebchuk et al., 2009). In particular, the purpose of this study is to analyze whether corporate governance news, following the approval of the Spanish Corporate Governance Code (Aldama Code: ACGC from now on), are regarded as a signal of actually good corporate governance or if, on the contrary, they are not in fact considered value-relevant at all. The main contribution to the literature comes from the individual and timeliness analysis of corporate governance announcements. By taking advantage of the Spanish code classification of recommendations, and contrary to previous papers on the matter, it develops a disaggregate analysis to analyze the effects of different kinds of corporate governance news. This is done with a unique hand-collected database on Spanish firms corporate governance individual announcements for the period of existence of the ACGC (2003–2005). Spain as a case of analysis is also interesting due to the increasing financial activity, security market expansion and investor participation increase in those years.
Results show first, that investors react to corporate governance announcements, second, that the sign and significance of their reaction depends crucially on the nature and extension of recommendations. Therefore, distinguishing among different types of announcements is shown to be crucial to understand market reaction. Additionally, it is shown that firms that disclose more news on corporate governance do not enjoy higher return or market prices. The short-run association between governance and share value disappears when lengthy periods of time are considered.
The structure of the paper is as follows. First, hypotheses are derived and discussed. Second, the data and methodology used are presented. Results are then exposed and finally we draw some conclusions.
Main hypothesesProvided existing governance practices are the result of managerial rent extraction, regulation that limit rent-extracting governance arrangements would increase shareholder value (Larcker et al., 2011). Had Codes’ recommendations improved corporate governance practices through which outside investors protect themselves against expropriation by the insiders, asymmetric information would diminish and capital markets efficiency would increase (MacNeil and Li, 2006). Therefore, market value of a company with bad corporate governance mechanisms should be lower than that of a company without corporate governance problems (Gompers et al., 2003 and Goncharov et al., 2006). Accordingly, investors would not tolerate a higher risk of expropriation without receiving a higher risk premium for such investments.
As stated in the introduction, the main objective of ACGC it to define a set of recommendations that helps improving corporate governance of Spanish listed firms. Following the above discussion, announcements about compliance would be associated to good corporate governance practices. Our first hypothesis should therefore be as follows:Hypothesis 1 Provided the ACGC recommendations are generally associated to good corporate governance practices, announcements about compliance should have a positive effect on stock price.
Literature on voluntary disclosure claims that an important motivation to disclose is that companies want to send a signal to the market to obtain economic benefits (Fung et al., 2007). However, voluntary disclosure is likely to be biased, because firms have an incentive to overstate the good and understate their bad practices (Kruger, 2015). Therefore, for a signal to be credible, it must have economic benefits and it should be sufficiently costly to show firm commitment. In particular, if disclosure of code compliance were a credible signal, this would be because the cost of the signal is significantly higher for firms with bad governance than for firms with good governance: the “bad” company cannot mimic the “good” one (Spence, 1973). The content and costs of code recommendations will therefore affect the credibility of the signal. Provided that recommendations are relatively trivial, like the ones of formal box-ticking, and costless in mitigating agency problems, they may not be considered as a credible signal (Arcot and Bruno, 2006). Accordingly, markets will not react or even react negatively. Therefore, investors will be sensitive to corporate governance practices that are costly for the firm, since they would be the ones that allow distinguishing between “good” and “bad” firms. In this case, as Lombardo and Pagano (2002) suggest shareholders would be willing to pay higher price for firms that follow code recommendations that reduce expropriation risks. We then can formulate the following hypothesis:Hypothesis 1b The more trivial and less costly the ACGC recommendation announced to comply, the less of the positive impact it has on the value of the company.
Market reaction to corporate governance news related to compliance with the code approved in 2003 is analyzed. ACGC is an attempt to balance effective legal protection to shareholders, basic for capital market development, and flexibility demanded by listed companies to organize their own governing bodies. For instance, ACGC's recommendations collect legal prescriptions determined by the Spanish Capital Market Act passed in 2002 and disclosure requirements established in the law 26/2003. We construct a unique database on Spanish listed companies. The companies included have belonged to the IBEX 35 index during the period when ACGC applies. The composition of this index changes from year to year. In the period of analysis 42 companies belonged to it in different moments of time, therefore 42 firms are included in the analysis.
The companies in the IBEX 35 represent 77.7% of the total value of shares traded on the stock market in 2006. Despite the growing market capitalization (41.4% increase along the period, value equal to 72.6% of nominal GDP), equity market capitalization is still very concentrated and IBEX-35 firms’ trading volume account for 94.3% of the market in 2006. The panel of 42 companies represents more than 80% of the total value traded. Concentrating in these companies is interesting since larger companies get more attention and are more scrutinized by the media and investor community. Moreover, larger companies can afford to comply more easily due to scale economies, since the cost of compliance is fixed, at least to some extent (Akkermans et al., 2007).
As corporate governance announcements, we consider news related to compliance of different corporate governance recommendations included in the ACGC. To identify these announcements, we analyze different sources: first of all, the Stock Exchange Commission (CNMV) formal communication records that collect all relevant actions taken by firms: financial news, shareholding changes, adoption of best practices, etc. Second, we revise annual reports on corporate governance and on financial statements to verify the information compiled by the CNMV; and, third, we check the LexisNexis database, which collects all company articles published in the main economic newspapers to account whether some information was released in the newspapers before than provided to the market regulator. When the same announcement is found in more than one source, we use the date it was first published. This allows for an analysis of the price reaction the day the information arrives to the market. We find 271 pieces of news related to the ACGC. Some filters are applied to isolate announcements related to governance. In particular, when they coincide with other relevant events, such as dividends, stock options plans, takeover and profit prospects’ announcements, they are removed from the sample. The final sample comprises 224 announcements.
ACGC focuses on three aspects of corporate governance: transparency, managers’ fiduciary duties, and company governing bodies. With all this information we develop a database with news on ACGC, the date it was publicly disclosed and the type of governance announcement.
Each type of corporate governance measure could have different costs. First, fiduciary duty recommendations require boards to apply high ethical standards and devote enough time and energy to the performance of their duties. For example board members should not be overburdened by multiple directorships. This kind of recommendations has direct costs due to the process but also, may have indirect costs related to network relations and conflicts of interests (Laan, 2009; Aguilera and Cuervo-Cazurra, 2004). However, this formality may have little consequences for corporate activity (Akkermans et al., 2007) and recommendations on fiduciary duties may be easy to adopt from a formal point of view. Further, due to code ambiguities (to guarantee firm flexibility) it is also difficult to evaluate announcements and companies’ commitment with the recommendations on fiduciary duties (CNMV, 2006).
Second, transparency recommendations can be more demanding, since companies must reveal information that would otherwise be kept private. The ACGC principle in this area is that the disclosure duty implies adopting measures to guarantee the correctness and usefulness of corporate governance information (Aldama, 2003). Furthermore, firms should provide information about the company ownership structure and management, related-party and intra-group transactions, risk control systems, functioning of the shareholder meeting. It also suggests different instruments of disclosure. Therefore, comply with transparency recommendations would have information costs, but also costs associated to the explanation and justification of disclosure (for instance, ordering and publishing independent reports by rating agencies or analysts, development and maintenance of a webpage) in order to assure information quality and credibility.
Third, recommendations related to governing bodies imply an active commitment by companies to good corporate governance. First, external control is enhanced through the empowerment of shareholder meeting as the firm basic decision making body. Second, the introduction of external and independent directors in the board and the guarantee that such directors should be able to comply with their duties adequately and in equally terms with insiders. This implies not only information but also coordination costs. Further, in the case of the ACGC, board commissions and committees should be created and incorporated into the decision making process and should have a relevant number of independent members, for instance the new nomination and remuneration committee. The incorporation of new commissions and committees has direct costs for the firm. Moreover, to comply with these recommendations, companies are legally enforced to adapt their bylaws and change current practices when necessary, especially on the nomination process. Therefore, recommendations on governing bodies imply higher costs. Furthermore, legally enforced recommendations may have more credibility, since authorities monitor the implementation of legal provisions and hence the degree of compliance with the recommendations may be easier to evaluate.
Following the above discussion, we will consider fiduciary recommendations to be the more trivial and recommendations on governing bodies to be the least trivial and most costly. Recommendations on transparency would lie between the two.
Table 1 presents a summary of announcements. Panel A classifies events by type and year. News related to fiduciary duties account for 16.38, 11.25 and 3.57% for 2003, 2004 and 2005 respectively. The observed decreasing trend would indicate an initial effort to comply with the new code. Similar tendency is evidenced for recommendations on governing bodies (70.69, 41.25 and 39.29%); however, news on transparency presents a positive trend (12.93, 47.5 and 57.14%). The concentration of certain types of news in 2003, especially those related to governing bodies, is remarkable. It would suggest that ACGC recommendations on governing bodies are binding for many firms. Panel B is a summary of the events by economic sector according to the CNMV classification. Petrol and power is the leading sector, followed by industry and construction. The third most relevant sector is market services. It is remarkable how the financial services sector is ranked fourth in adopting ACGC recommendations. Further, if we compare number of announcements and trading volume by sector, we find interesting evidence as well. The most relevant sectors, financial services and technology and communication (35.47% and 24.9% of trading volume respectively) are ranked fourth and fifth in ACGC announcements. A possible interpretation is that financial firms’ corporate arrangements were complying with the recommendations prior to the ACGC approval. This is especially interesting since financing companies usually demand transparency and good governance practices from their potential borrowers and clients. Similar evidence for financial firms was found in the analysis of the Olivencia Code adoption (Bilbao Calabuig, 2004).
Description of ACGC announcements.
| Panel A: News classification and percentage in sample | |||
|---|---|---|---|
| Type of event | 2003 | 2004 | 2005 |
| Fiduciary duty | 16.38% | 11.25% | 3.57% |
| Transparency and information duty | 12.93% | 47.50% | 57.14% |
| Governing bodies | 70.69% | 41.25% | 39.29% |
| Number of ACGC announcements | 116 | 80 | 28 |
| Panel B: Summary of ACGC announcements by sector along the period | ||
|---|---|---|
| Sector | Events | Trading volume |
| Consumer goods | 8.92% | 6.3% |
| Petrol and power | 33.03% | 22.3% |
| Financial services and real state | 13.39% | 35.47% |
| Industry and construction | 20.53% | 6.03% |
| Market services | 14.76% | 5% |
| Technology and telecommunication | 9.37% | 24.9% |
Spanish Stock Exchange Sector Classification as of 01/01/2005.
The role of the ACGC announcements is assessed by means of value relevance analysis. From a general point of view, “some amount is defined as value relevant if it has a predicted association with the equity market values” (Barth et al., 2001). Two types of studies are common in the literature to evaluate the value relevance of information (Kothari, 2001): association study and event study designs. An association study “tests for a positive correlation between an accounting performance measure and stock returns, both measured over relatively long, contemporaneous time periods, e.g., one year” (Kothari, 2001). An event study “infers whether an event, such as an earnings announcement, conveys new information to market participants as reflected in changes in the level or variability of security prices or trading volume over a short time period around the event” (Kothari, 2001, p. 116). We will use both techniques to provide a thorough analysis of the possible impact of corporate governance news related to codes of best practice on stock prices. This allows for an evaluation of the usefulness of information revealed by firms in the short and long run to investors, in this case related to news on ACGC.
The event study methodology has been extensively used to analyze market reactions to different pieces of news (Kothari and Warner, 2007). With this type of methodology, the semi-strong hypothesis of capital market efficiency is assumed; that is, new public information is continually assessed, valued, and reflected in the stock price, which includes current and expected firm financial performance. Despite the wide use of this methodology, our research objective may have some limitations. First, it is not clear how fast Spanish market reacts to new information. The choice of a (too) narrow window can lead to the false conclusion that some value-relevant information is not associated with market prices. Second, the main concern of an event study is the timeliness of information, yet it may be the case that some of the information disclosed as a consequence of the code adoption was already known by investors through the disclosure of recent financial statements.
The association methodology has been successfully implemented to analyze different topics: environmental policy (Hassel et al., 2005), R&D capitalization (Cazavan-Jeny and Jeanjean, 2006) and also corporate governance (Goncharov et al., 2006). The Ohlson model will be used as a framework that allows the estimation of the proportion of the firm value that is related to firm's corporate governance announcements possible.
Market participants will base trading decisions on present information about future performance but not all information available is used in the decision-making process. The main issue in this methodology is to choose the right valuation model to reduce potential econometric problems due to heteroskedasticity and correlated omitted variables (Kothari, 2001).
Event studyOnce the events to be analyzed are defined (in our case, news on different aspects of ACGC), the effect each event has on the stock price must be calculated. For this, we proceed in two stages. First, we estimate the “normal” expected return for each stock (adjusted for dividends). This expected return is obtained by means of a valuation model. In this case, similar to previous studies with this methodology, we use the market model that seems most appropriate. This model relates the return of a certain stock to the market return:
where Rit is the return of stock i at time t, Rmt is market return at time t, ¿it is the residual term of stock i at time t, and αi and βi are the parameters to be estimated. The return variables are expressed as logarithms and Rit includes the dividend payout. The Índice General de Bolsa de Madrid (IGBM) index is considered the market index. The calculation of the expected return is made 170 to 20 days before the event. This period is known as the estimation window (−170, −20). Therefore, we take into account a long period prior to the announcement (151 days). Since the estimation period ends 20 days before the event date, the risk that the estimated returns are affected by information about the event is minimized.
Second, we calculate the abnormal outcome caused by the event. The abnormal return (AR) is defined as the difference between the actual and predicted returns during the event window (ARit=Rit−E(Rit)). The calculations are made for different event window lengths around the announcement day, since results can be sensitive to the event window size. In particular, we consider t days around the event date, where t=(−7, 7). This period was chosen by taking into account previous papers, see Kothari and Warner (2007). Once the ARit are estimated, the average AR for each day of the event day is computed:

We compute also the cumulative abnormal returns for different subperiods in the pre and post announcement dates:

Abnormal returns estimated through ordinary least squares (OLS) could be biased due to the persistent volatility of daily returns. Following Bollerslev et al. (1994), the model is corrected through a GARCH (1,1) to control for the conditional heteroskedasticity of financial returns. Therefore, the variance of each stock is modeled as

A second problem associated with financial assets is infrequent trading. However, since the stocks of our sample present the highest trading volume in the Spanish market, we do not consider this a serious concern.
Association studyThe major issue in this field of research is the choice of a valuation model. One of the most popular models is that developed by Ohlson (1995). This model was previously used, for example, by Hassel et al. (2005) and Goncharov et al. (2006) among others. The underlying assumptions are (a) the market value equals the present value of future dividends, (b) a clean surplus relationship, and (c) linear information dynamics. Based on these three assumptions, firm value can be represented as a linear function of the book value of equity, the present value of expected future abnormal earnings (i.e., earnings less the charge for capital), and other value-relevant non-accounting information. In the empirical implementation of the Ohlson model, the market value (P) is expressed as a function of a constant, the book value of equity (BV), earnings per share (EPS), and the error term (as used in Naceur and Goaied, 2004; Goncharov et al., 2006):

This equation is labeled as the price model. The intercept captures the mean effect of other value-relevant information. Regression residuals pick up the effect of non-accounting information. The downside of the price equation is that severe econometric problems can be caused by heteroskedasticity and correlated omitted variables (Kothari, 2001).
An alternative to the price model is the return specification. This model can be obtained by taking first differences in the variables on both sides of the price model. Therefore, changes in stock prices (including dividends) are regressed on earnings per share (EPS) and changes in earnings (ΔEPS).

One advantage of this return model is that it controls for any serial correlation that may exist among observations. The second advantage is that it mitigates the effects of omitted variables (Easton, 1999). Using the price model in addition to the return model may allow more definitive inferences (Kothari and Zimmerman, 1995). Therefore both specifications are used to obtain statistically robust results.
To incorporate all financial and non-financial information into price and return models, we compute price and return variables for a one-year period ending six months after the balance sheet date (December 31). BV, EPS and ΔEPS as book value, earnings per share and change in earnings per share of firm i for year t (December 31). In the empirical implementation, we first estimate the proposed equations and, afterwards, introduce the corporate governance variable CG for the degree of disclosure related to the ACGC announcements for each year t, as our proxy for value-relevant non-accounting information. Additionally, as highlighted previously, we differentiate between three types of announcements, pertaining to transparency, fiduciary duty, and governance bodies’ recommendations as well. To capture the degree of disclosure with the whole code and the different types of recommendations, we first compute the percentage of disclosure. This is defined as the relative importance of the number of announcements realized by each firm in every respect for a given year to the total number of announcements made by all firms in that year. Second, we construct a dummy variable taking a value of one if the percentage of announcement is greater than the year median and zero otherwise. Table 2 presents the descriptive statistics (panel A) and correlations (panel B) between the main variables and the variables related to the ACGC announcements. CG is positively correlated with returns at 10% level but the correlation between price and CG news is not significant, although positive as well. Looking at news about different aspects of the code, only announcements on fiduciary duty are significantly correlated with price. A multivariate analysis will be performed in the next section.
Variables used in the value relevance analysis.
| Panel A: Descriptive statistics | |||||
|---|---|---|---|---|---|
| Mean | Sd | Q1 | Median | Q3 | |
| P | 22.0387 | 17.9268 | 11.2500 | 16.8200 | 26.3200 |
| R | 0.2247 | 0.28003 | 0.0762 | 0.2361 | 0.3941 |
| BV | 7.3928 | 7.1315 | 2.9746 | 6.1857 | 9.6774 |
| EPS | 0.9682 | 1.2759 | 0.1114 | 0.5624 | 1.2200 |
| ΔEPS | 0.02705 | 0.0704 | 0.0009 | 0.0096 | 0.03163 |
| Panel B: Correlation analysis for the relevance analysis | |||||||
|---|---|---|---|---|---|---|---|
| P | BV | EPS | CG | Fiduciary | Transparency | Gov. bodies | |
| Price specification | |||||||
| P | 1 | ||||||
| BV | 0.6634*** | 1 | |||||
| EPS | 0.6020*** | 0.3658*** | 1 | ||||
| CG | 0.0643 | 0.1265 | 0.1059 | 1 | |||
| Fiduciary | −0.1870* | −0.0988 | −0.1460 | 0.4238*** | 1 | ||
| Transparency | 0.1333 | 0.0819 | 0.2625*** | 0.5181*** | 0.1404 | 1 | |
| Gov. bodies | 0.0584 | 0.1195 | 0.0309 | 0.4129*** | 0.1077 | 0.0793 | 1 |
| Rent | EPS | ΔEPS | CG | Fiduciary | Transparency | Gov. bodies | |
|---|---|---|---|---|---|---|---|
| Return specification | |||||||
| R | 1 | ||||||
| EPS | 0.1455 | 1 | |||||
| ΔEPS | 0.2410** | 0.0324 | 1 | ||||
| CG | 0.0682* | 0.1059 | 0.1890* | 1 | |||
| Fiduciary | −0.1503 | −0.1460 | 0.1344 | 0.4238*** | 1 | ||
| Transparency | 0.1510 | 0.2625*** | 0.0159 | 0.5181*** | 0.1404 | 1 | |
| Gov. bodies | 0.0140 | 0.0309 | 0.0049 | 0.4129*** | 0.1077 | 0.0793 | 1 |
P is stock price, R is stock return, BV is book value of equity, EPS is the earnings per share ratio, ΔEPS is changes in earnings per share, CG is the degree of disclosure of the ACGC and Fiduciary, Transparency and Gov. bodies are the degree of disclosure of different types of recommendations.
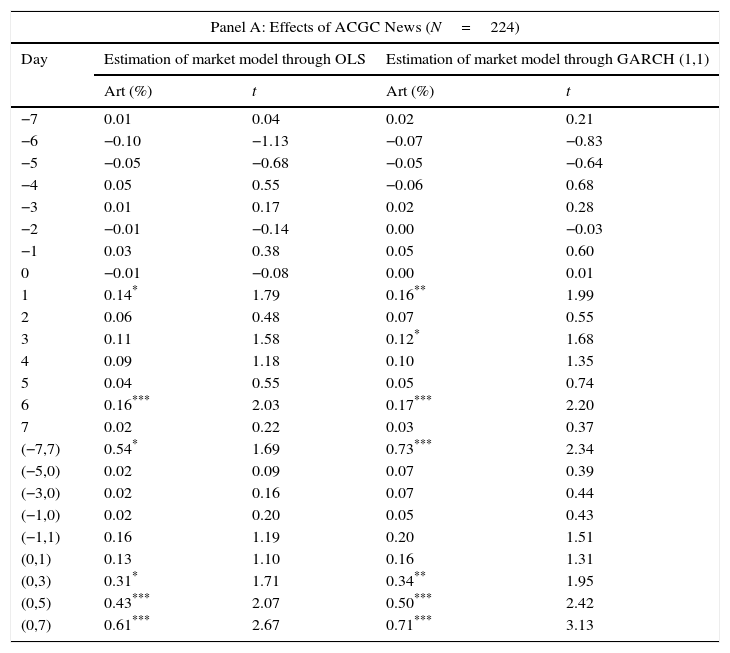
Table 3 shows the results of ACGC announcements computed for different days and periods around the event day for AR and CAR. Panel A presents the results for the complete sample and panel B collects the results for each year individually. In both cases, the market model is estimated through OLS and GARCH (1,1) respectively. For both models, there is a positive and significant AR the day after the announcement (0.14% and 0.16%, respectively). The CAR values, at the bottom of Table 3 of panel A, are also positive and significant for the periods (−7, 7), (0, 3), (0, 5), and (0, 7). This positive sign implies that investors react favorably to the communication of news related to compliance with the ACGC. Therefore, evidence supporting Hypothesis 1 is found for the ACGC. This result is in line with Fernández-Rodríguez et al. (2004) who analyze annual corporate governance report but did not take into account the timeliness of the individual announcements.
Event analysis.
| Panel A: Effects of ACGC News (N=224) | ||||
|---|---|---|---|---|
| Day | Estimation of market model through OLS | Estimation of market model through GARCH (1,1) | ||
| Art (%) | t | Art (%) | t | |
| −7 | 0.01 | 0.04 | 0.02 | 0.21 |
| −6 | −0.10 | −1.13 | −0.07 | −0.83 |
| −5 | −0.05 | −0.68 | −0.05 | −0.64 |
| −4 | 0.05 | 0.55 | −0.06 | 0.68 |
| −3 | 0.01 | 0.17 | 0.02 | 0.28 |
| −2 | −0.01 | −0.14 | 0.00 | −0.03 |
| −1 | 0.03 | 0.38 | 0.05 | 0.60 |
| 0 | −0.01 | −0.08 | 0.00 | 0.01 |
| 1 | 0.14* | 1.79 | 0.16** | 1.99 |
| 2 | 0.06 | 0.48 | 0.07 | 0.55 |
| 3 | 0.11 | 1.58 | 0.12* | 1.68 |
| 4 | 0.09 | 1.18 | 0.10 | 1.35 |
| 5 | 0.04 | 0.55 | 0.05 | 0.74 |
| 6 | 0.16*** | 2.03 | 0.17*** | 2.20 |
| 7 | 0.02 | 0.22 | 0.03 | 0.37 |
| (−7,7) | 0.54* | 1.69 | 0.73*** | 2.34 |
| (−5,0) | 0.02 | 0.09 | 0.07 | 0.39 |
| (−3,0) | 0.02 | 0.16 | 0.07 | 0.44 |
| (−1,0) | 0.02 | 0.20 | 0.05 | 0.43 |
| (−1,1) | 0.16 | 1.19 | 0.20 | 1.51 |
| (0,1) | 0.13 | 1.10 | 0.16 | 1.31 |
| (0,3) | 0.31* | 1.71 | 0.34** | 1.95 |
| (0,5) | 0.43*** | 2.07 | 0.50*** | 2.42 |
| (0,7) | 0.61*** | 2.67 | 0.71*** | 3.13 |
| Panel B: Effects of AGCG News by year | ||||||||||||
|---|---|---|---|---|---|---|---|---|---|---|---|---|
| Day | 2003 | 2004 | 2005 | |||||||||
| OLS | GARCH (1,1) | OLS | GARCH (1,1) | OLS | GARCH (1,1) | |||||||
| Art (%) | t | Art (%) | t | Art (%) | t | Art (%) | t | Art (%) | t | Art (%) | t | |
| −7 | 0.004 | 0.026 | 0.0075 | 0.0502 | −0.04 | −0.41 | −0.001 | −0.14 | 0.13 | 0.61 | 0.16 | 0.76 |
| −6 | −0.1 | −0.7 | −0.103 | −0.69 | −0.15 | −1.42 | −0.095 | −0.89 | 0.08 | 0.59 | 0.11 | 0.8 |
| −5 | −0.11 | −0.88 | −0.12 | −0.96 | 0.02 | 0.16 | 0.034 | 0.33 | −0.02 | −0.11 | 0.0009 | 0.0056 |
| −4 | 0.09 | 0.68 | 0.08 | 0.61 | 0.01 | 0.11 | 0.046 | 0.4 | −0.04 | −0.24 | −0.01 | −0.09 |
| −3 | −0.07 | −0.56 | −0.068 | −0.52 | 0.16 | 1.47 | 0.17 | 1.48 | −0.06 | −0.35 | −0.02 | −0.11 |
| −2 | 0.07 | 0.59 | 0.075 | 0.56 | −0.08 | −0.71 | −0.06 | −0.52 | −0.17 | −0.92 | −0.15 | −0.78 |
| −1 | 0.043 | 0.41 | 0.053 | 0.52 | −0.07 | −0.52 | −0.046 | −0.34 | 0.25 | 1.11 | 0.28 | 1.21 |
| 0 | −0.06 | −0.41 | −0.06 | −0.45 | −0.02 | −0.18 | 0.001 | 0.0091 | 0.26* | 1.77 | 0.29* | 1.94 |
| 1 | 0.02 | 0.21 | 0.03 | 0.26 | 0.22* | 1.86 | 0.25** | 2.09 | 0.37** | 2.71 | 0.39*** | 2.87 |
| 2 | 0.11 | 0.46 | 0.1 | 0.46 | 0.02 | 0.23 | 0.03 | 0.34 | −0.03 | −0.2 | −0.003 | −0.021 |
| 3 | 0.21* | 1.94 | 0.22* | 1.95 | 0.02 | 0.3 | 0.04 | 0.42 | −0.08 | −0.44 | −0.06 | −0.35 |
| 4 | 0.14 | 1.11 | 0.14 | 1.13 | 0.07 | 0.95 | 0.09 | 1.2 | −0.1 | −0.72 | −0.07 | −0.49 |
| 5 | 0.14 | 1.2 | 0.13 | 1.14 | −0.13 | −1.29 | −0.09 | −1.01 | 0.11 | 0.93 | 0.13 | 1.11 |
| 6 | 0.18 | 1.54 | 0.17 | 1.49 | 0.19 | 1.57 | 0.23* | 1.85 | −0.03 | −0.2 | −0.001 | −0.04 |
| 7 | 0.15 | 1.12 | 0.16 | 1.14 | −0.01 | −0.11 | 0.004 | 0.04 | −0.45 | −1.67 | −0.41 | −1.52 |
| (−7,7) | 0.83 | 1.61 | 0.83 | 1.63 | 0.23 | 0.52 | 0.6 | 1.43 | 0.19 | 0.35 | 0.62 | 1.14 |
| (−5,0) | −0.03 | −0.13 | −0.14 | −0.41 | 0.02 | 0.08 | 0.03 | 0.1 | 0.21 | 0.49 | 0.66 | 1.44 |
| (−3,0) | −0.01 | −0.06 | −0.04 | −0.17 | −0.07 | −0.03 | 0.14 | 0.49 | 0.28 | 0.74 | 0.38 | 0.89 |
| (−1,0) | −0.01 | −0.11 | −0.01 | −0.09 | −0.09 | −0.52 | −0.04 | −0.26 | 0.52* | 1.9 | 0.57** | 2.11 |
| (−1,1) | 0.006 | 0.03 | 0.01 | 0.08 | 0.13 | 0.64 | 0.21 | 0.99 | 0.89** | 2.73 | 0.96*** | 2.97 |
| (0,1) | −0.03 | −0.19 | −0.03 | −0.19 | 0.2 | 1.23 | 0.25 | 1.53 | 0.63*** | 2.81 | 0.68*** | 3.01 |
| (0,3) | 0.28 | 0.93 | 0.28 | 0.94 | 0.25 | 1.17 | 0.33 | 1.54 | 0.51** | 2.01 | 0.61** | 2.44 |
| (0,5) | 0.56 | 1.58 | 0.56 | 1.59 | 0.21 | 0.83 | 0.33 | 1.42 | 0.52* | 1.67 | 0.68** | 2.11 |
| (0,7) | 0.91** | 2.34 | 0.9** | 2.37 | 0.38 | 1.37 | 0.57** | 2.08 | 0.02 | 0.06 | 0.25 | 0.65 |
Taking into account the year when the announcement is made, we get interesting results as well. According to panel B, market reacts more slowly the first year of ACGC and more rapidly at the end of the period. This change indicates that Spanish market is increasingly concerned about ACGC recommendations’ adoption. Similarly, Bebchuk et al. (2013) highlight the necessity of changes in the attention paid to governance by market participants to explain evidence of abnormal returns associated to corporate strategies.
Table 4, panel A through C, presents results when we distinguish by the type of announcement using the classification in Table 1: fiduciary duties, transparency, and governing bodies. As in Table 3, AR and CAR are shown for different days and periods and estimated through OLS and GARCH (1,1).
Event analysis by corporate governance dimension.
| Day | Panel A | Panel B | Panel C | |||||||||
|---|---|---|---|---|---|---|---|---|---|---|---|---|
| Fiduciary duty (N=29) | Transparency (N=69) | Governing bodies (N=126) | ||||||||||
| OLS | GARCH (1,1) | OLS | GARCH (1,1) | OLS | GARCH (1,1) | |||||||
| Art (%) | t | Art (%) | t | Art (%) | t | Art (%) | t | Art (%) | t | Art (%) | t | |
| −7 | −0.03 | −0.19 | −0.04 | −0.28 | −0.04 | −0.35 | −0.03 | −0.21 | 0.04 | 0.26 | 0.06 | 0.41 |
| −6 | 0.23 | 1.03 | 0.25 | 1.14 | −0.06 | −0.47 | −0.02 | −0.21 | −0.20 | −1.49 | −0.17 | −1.30 |
| −5 | −0.32*** | −2.09 | −0.33*** | −2.20 | 0.20 | 1.57 | 0.20 | 1.56 | −0.13 | −1.18 | −0.13 | −1.11 |
| −4 | −0.33 | −1.62 | −0.31 | −1.54 | −0.06 | −0.35 | −0.05 | −0.28 | 0.02* | 1.92 | 0.20*** | 2.00 |
| −3 | 0.32*** | 2.01 | 0.34*** | 2.08 | 0.16 | 1.32 | 0.18 | 1.42 | −0.14 | −1.14 | −0.13 | −1.09 |
| −2 | 0.38*** | 2.30 | 0.38*** | 2.27 | −0.13 | −1.15 | −0.13 | −1.13 | −0.03 | −0.25 | −0.02 | −0.13 |
| −1 | 0.26 | 1.11 | 0.31 | 1.20 | −0.06 | −0.35 | −0.04 | −0.28 | 0.02 | 0.23 | 0.04 | 0.43 |
| 0 | −0.62 | −1.46 | −0.62 | −1.48 | 0.03 | 0.27 | 0.04 | 0.31 | 0.11 | 0.99 | 0.12 | 1.09 |
| 1 | −0.09 | −0.59 | −0.09 | −0.56 | 0.14 | 1.07 | 0.16 | 1.24 | 0.19* | 1.70 | 0.21* | 1.84 |
| 2 | 0.09 | 0.38 | 0.10 | 0.41 | 0.05 | 0.40 | 0.05 | 0.39 | 0.05 | 0.27 | 0.07 | 0.34 |
| 3 | −0.07 | −0.38 | −0.08 | −0.38 | 0.03 | 0.27 | 0.05 | 0.39 | 0.20*** | 2.00 | 0.21*** | 2.04 |
| 4 | 0.00 | −0.01 | 0.03 | 0.21 | −0.08 | −0.94 | −0.07 | −0.84 | 0.20* | 1.68 | 0.22* | 1.79 |
| 5 | −0.06 | −0.24 | −0.04 | −0.18 | 0.15 | 1.22 | 0.16 | 1.39 | 0.00 | 0.01 | 0.01 | 0.13 |
| 6 | −0.23 | −1.54 | −0.22 | −1.51 | 0.29** | 1.99 | 0.29*** | 2.07 | 0.18 | 1.62 | 0.20 | 1.76 |
| 7 | 0.10 | 0.62 | 0.14 | 0.84 | −0.14 | −1.07 | −0.13 | −1.01 | 0.09 | 0.64 | 0.10 | 0.73 |
| (−7,7) | −0.35 | −0.39 | −0.19 | −0.22 | 0.49 | 0.98 | 0.66 | 1.36 | 0.77* | 1.68 | 0.97*** | 2.19 |
| (−5,0) | −0.28 | −0.41 | −0.23 | −0.34 | 0.15 | 0.48 | 0.19 | 0.60 | 0.01 | 0.04 | 0.08 | 0.31 |
| (−3,0) | 0.38 | 0.59 | 0.42 | 0.66 | 0.01 | 0.02 | 0.04 | 0.15 | −0.04 | −0.23 | 0.01 | 0.03 |
| (−1,0) | −0.33 | −0.62 | −0.31 | −0.59 | −0.02 | −0.12 | −0.01 | −0.03 | 0.13 | 1.02 | 0.16 | 1.25 |
| (−1,1) | −0.43 | −0.73 | −0.40 | −0.71 | 0.12 | 0.55 | 0.00 | 0.76 | 0.32* | 1.92 | 0.36*** | 2.18 |
| (0,1) | −0.71 | −1.48 | −0.71 | −1.51 | 0.17 | 0.96 | 0.20 | 1.11 | 0.30** | 1.96 | 0.33*** | 2.13 |
| (0,3) | −0.70 | −1.07 | −0.69 | −1.09 | 0.26 | 1.18 | 0.30 | 1.38 | 0.55*** | 2.19 | 0.60*** | 2.38 |
| (0,5) | −0.76 | −1.00 | −0.70 | −0.95 | 0.33 | 1.27 | 0.39 | 1.54 | 0.75*** | 2.57 | 0.83*** | 2.81 |
| (0,7) | −0.89 | −1.25 | −0.79 | −1.17 | 0.48 | 1.42 | 0.56* | 1.66 | 1.02*** | 3.18 | 1.12*** | 3.55 |
Table 4 panel A presents results for fiduciary duties. On the day of the announcement, there is a negative but not significant reaction (−0.61%). There is no significant reaction after the day of the event either. Therefore, results suggest that the Spanish market does not react to these kinds of announcements. One possible explanation is that fiduciary recommendations are considered trivial, easy to comply and not credible enough therefore, not affecting market price (Hypothesis 1b). Alternatively, it could be that companies were already complying with this kind of recommendations and therefore there is no reaction. Announcements related to transparency (see Table 4, panel B) present positive AR values on the day of the event and the day after (0.03 and 0.14 respectively). However, this price effect is not significant. The only day when this reaction is significant is on the sixth day after the event. If CAR values are considered, again there are not significant results. Compliance with transparency rules and CNMV disclosure requirements enhance information availability for investors and shareholders. But ACGC announcements in this respect do not seem to imply a market reaction, since they are not conveying new information to the market. It could suggest that market anticipated correctly or that the new provisions do not affect value. This idea is consistent with the notion that the firm can use similar, but unregulated provisions. The flexible structure adopted in ACGC could be an explanation since it would accept current arrangements. This problem was acknowledged in 2007 when a normalized structure of the annual corporate governance report was adopted to make information comparable between firms and facilitate investor analysis (CNMV, Circular 4/2007).
Finally, Table 4, panel C shows the results for governing bodies’ announcements. First of all, the market seems to react more significantly to this type of announcements than to the others just presented (panel A and B). In particular, there is a positive significant reaction four days before the day of the announcement (0.02), on the day after the announcement (0.19), as well as three and four days afterwards (0.20, 0.20 respectively). Considering different periods around the event day, again there are significant price reactions during several time intervals: (−7, 7), (−1, 1), (0, 1), (0, 3), (0, 5), and (0, 7). Therefore, news on governing bodies’ recommendations, the least trivial and most costly, are the most valued by markets (Hypothesis 1).
Further, we test whether announcement returns reported in panel C are statistically different from returns reported in panel A and B. Results are reported in Table 5. It can be seen that four and three days before the announcement as well as four days afterwards mean returns are significantly greater for announcement related to governing bodies. Accordingly, differences are also significant during time intervals: (0, 3), (0, 5), and (0, 7), showing that the reactions to governing bodies’ news are larger in magnitude and significance. Therefore, there is evidence supporting Hypothesis 1b; the market reacts differently to news on governing bodies’ recommendations that are the least trivial and most costly, of all three. Further, some of these recommendations are legally enforced by additional legislation different from the ACGC, increasing recommendations’ credibility. Therefore, markets react more significantly to recommendations that have more credibility and are easier to evaluate. These results show the importance of both distinguishing between different types of announcements and taking into account the timeliness of information, since it reveals which kind of news is indeed having a significant market reaction.
Comparison between news on governing bodies versus fiduciary and transparency.
| Day | Panel A: OLS | Panel B: GARCH | ||||
|---|---|---|---|---|---|---|
| Fidu/transp | Gov. bodies | t | Fidu/transp | Gov. bodies | t | |
| −7 | −0.4 | 0.04 | −0.42 | −0.03 | 0.06 | −0.48 |
| −6 | 0.02 | −0.20 | 1.23 | 0.05 | −0.17 | 1.27 |
| −5 | 0.04 | −0.13 | 1.15 | 0.04 | −0.13 | 1.08 |
| −4 | −0.13 | 0.02* | −1.97* | −0.12 | 0.20 | −1.93* |
| −3 | 0.21 | −0.14 | 2.13** | 0.22 | −0.13 | 2.17** |
| −2 | 0.01 | −0.03 | 0.27 | 0.01 | −0.02 | 0.19 |
| −1 | 0.04 | 0.02 | 0.12 | 0.05 | 0.04 | 0.11 |
| 0 | −0.15 | 0.11 | −1.42 | −0.14 | 0.12 | −1.46 |
| 1 | 0.07 | 0.19 | −0.75 | 0.08 | 0.21 | −0.75 |
| 2 | 0.06 | 0.05 | 0.04 | 0.06 | 0.07 | −0.006 |
| 3 | 0.001 | 0.20 | −1.37 | 0.01 | 0.21 | −1.34 |
| 4 | −0.05 | 0.20 | −1.72* | −0.04 | 0.22 | −1.71* |
| 5 | 0.09 | 0.00 | 0.61 | 0.10 | 0.01 | 0.63 |
| 6 | 0.13 | 0.18 | −0.25 | 0.14 | 0.20 | −0.29 |
| 7 | −0.07 | 0.09 | 0.87 | −0.05 | 0.10 | −0.85 |
| (−7,7) | 0.24 | 0.77 | −0.80 | 0.41 | 0.97 | −0.88 |
| (−5,0) | 0.02 | 0.01 | 0.042 | 0.07 | 0.08 | −0.01 |
| (−3,0) | 0.11 | −0.04 | 0.49 | 0.14 | 0.01 | 0.44 |
| (−1,0) | −0.11 | 0.13 | −1.04 | −0.01 | 0.16 | −1.11 |
| (−1,1) | −0.03 | 0.32 | −1.30 | −0.003 | 0.36 | −1.36 |
| (0,1) | −0.07 | 0.30 | −1.56 | −0.06 | 0.33 | −1.60 |
| (0,3) | −0.01 | 0.55 | −1.57 | 0.01 | 0.60 | −1.65* |
| (0,5) | 0.01 | 0.75 | −1.75* | 0.07 | 0.83 | −1.80* |
| (0,7) | 0.08 | 1.02 | −2.03** | 0.17 | 1.12 | −2.10** |
Tables 3–5 show that Spanish market reacts significantly to news associated to the adoption of ACGC recommendations. Furthermore, these results maintain qualitative invariant if we take into account the restriction of no event-induced variance and also when we use a nonparametric test, the Corrado test, instead of the t-test presented.1 It is also shown the relevance of analyzing different types of news on codes of best practice.
Association analysisFinancial statement information is expected to be positively related to prices and stock returns. In addition, we propose that information disclosed on ACGC can also help explaining market value.
In estimating the relationship between market value, accounting variables and corporate governance news, we use panel data estimation methodology to take advantage of the time structure of data. The estimation takes into account the possible existence of non-observable heterogeneity. Following the results from the Hausman test, the random effect estimation is used in all runs. All estimations include time dummies. Results are collected in Table 6.
Association analysis.
| Panel A: Price models | |||||
|---|---|---|---|---|---|
| (1) | (2) | (3) | (4) | (5) | |
| BV | 1.2115*** (0.2022) | 1.1364*** (0.2054) | 1.1242*** (0.2030) | 1.1273*** (0.2047) | 1.1046*** (0.2092) |
| EPS | 4.9111*** (0.9284) | 4.9524*** (0.9455) | 4.9140*** (0.9442) | 4.8802*** (0.9459) | 4.9152*** (0.9432) |
| CG | −1.0479 (1.9188) | ||||
| Fiduciary | −0.9630 (2.3454) | ||||
| Transparency | −0.9041 (3.4180) | ||||
| Governing Bodies | 0.7038 (2.3579) | ||||
| Constant | 4.4099 (5.3988) | 17.9238*** (5.9346) | 4.2548 (5.4069) | 18.1932*** (6.4302) | 16.6563*** (6.4364) |
| Observations | 104 | 104 | 104 | 104 | 104 |
| R squared | 0.63 | 0.64 | 0.64 | 0.63 | 0.63 |
| Hausman test | 3.89 | 6.56 | 9.47 | 8.17 | 8.07 |
| Panel B: Return models | |||||
|---|---|---|---|---|---|
| (1) | (2) | (3) | (4) | (5) | |
| EPS | 0.02412 (0.0257) | 0.2478 (0.0259) | 0.0201 (0.02524) | 0.0250 (0.0251) | 0.0242 (0.0258) |
| ΔEPS | 0.7868* (0.4095) | 0.8107* (0.4191) | 0.9555** (0.4083) | 0.8888** (0.4034) | 0.7781* (0.4151) |
| CG | −0.0171 (0.0584) | ||||
| Fiduciary | −0.1657** (0.0742) | ||||
| Transparency | −0.2393** (0.1054) | ||||
| Governing bodies | 0.0123 (0.0747) | ||||
| Constant | 0.1563 (0.1030) | 0.1253 (0.1062) | 0.2113** (0.1013) | 0.3013** (0.1279) | 0.1451 (0.1180) |
| Observations | 105 | 105 | 105 | 105 | 105 |
| R squared | 0.11 | 0.11 | 0.15 | 0.16 | 0.11 |
| Hausman test | 0.51 | 2.46 | 0.72 | 1.55 | 2.88 |
Standard errors in parentheses.
Panel A: The estimated model is Pit=α0+α1BVit+α2EPSit+α3CGit+uit. BV is book value of equity, EPS is the earnings per share ratio, CG is the degree of disclosure of the ACGC and Fiduciary, Transparency and Gov. bodies the degree of disclosure of different types of recommendations.
Panel B: The estimated model is Rit=α0+α1EPSit+α2ΔEPSit+α3CGit+uit. EPS is the earnings per share ratio, ΔEPS is the change in earnings per share, CG is the degree of disclosure of the ACGC and Fiduciary, Transparency and Governing bodies the degree of disclosure of different types of recommendations.
Table 6 panel A presents the results for the price equation. The first one includes the accounting variables only. Afterwards, we add the corporate governance news variables one at a time. When accounting variables are introduced alone (column 1), both the coefficient on book value of equity (BV) and the coefficient on earnings per share (EPS) are positive and significant. The significance of accounting variables maintains throughout the different specifications, suggesting the relevance of accounting information in market value (columns 2–5).
In column 2, we introduce the CG variable on ACGC announcements. The R2 shows a slight increase improving the estimation of stock prices. However, its coefficient is not significant; hence, those firms that disclose more news on ACGC compliance do not present higher or lower share prices. This result goes against Goncharov et al. (2006) that find a positive and significant effect for the German market. Distinguishing among corporate governance news does not alter this main result (columns 3–5). Therefore, according to our analysis news about corporate governance do not incorporate credible information to investors in the medium-long term and it would not be associated to higher prices.
Stock return modelsTable 6, panel B reports the results of the effect of corporate governance announcements on stock returns. The coefficient of earnings per share (EPS) is not significant, whereas changes in earnings (ΔEPS) present a positive and significant estimate (column 1). The sign and significance of these estimates are maintained through the different specifications. Therefore, financial information plays a prominent role in explaining price and return reactions. We then include the CG variable and, as in the case of the price models, the coefficient is not significant, suggesting that news on ACGC is not associated to higher stock returns either (column 2). This result is similar to Goncharov et al. (2006). Results differ when we distinguish between the types of announcement. If we look at fiduciary and transparency news, the coefficients are negative and significant. Therefore, announcements on fiduciary duties and transparency are not associated to higher but to lower returns (columns 3 and 4). This suggests that this kind of news may be acting as a negative signal to market participants as a result of the triviality of recommendations. A complementary explanation would be that firm decisions on fiduciary duties and transparency before the introduction of ACGC were already value maximizing. Therefore, code actions to regulate governance related to fiduciary duties that promote different agreements could result in less efficient contracts and be value destroying (Hermalin, 2010). The introduction of governing bodies news does not provide significant results (columns 5). The general message of price and stock return models is that news on ACGC compliance does not have market value relevance in the medium and long term.
The self selection issueAlthough interesting, the above results should be interpreted with caution. In value relevance models, financial variables are exogenous. On the contrary, variables accounting for news on corporate governance are potentially endogenous. Although the introduction of ACGC can be considered exogenous, firms can act strategically and may consider advantageous to disclose sooner (later) news on code recommendations than its competitors. In other words, the association between corporate governance news and market value may be driven by specific firm characteristics rather than by adopting new regulations per se. To overcome this weakness, we run a two-step procedure similar to Cazavan-Jeny and Jeanjean (2006) and Goncharov et al. (2006). In the first stage, we model the decision to disclose as a linear combination of firm features. In particular, we include variables related to (a) ownership structure (b) financial structure, (c) board structure features and (d) competitive situation (see Köke, 2002)2. In the second step, we include in our price and return regressions the predicted value of corporate governance announcements (PRED_CG) and its different components (PRED_fidu, PRED_transp, PRED_gov) from our step one model as additional variables. The inclusion of PRED_CG and its individual aspects helps us to control for the effect of variables associated with the decision to make more announcements on price levels and stock returns.
Results are collected in Table 7. Price and stock return models are presented in panel A and B respectively. Panel A confirms that financial information is relevant to explaining stock price, further news on ACGC is not value-relevant information for determining stock prices (column 1). Individual aspects offer the same results as the global CG variable (columns 2–4). Therefore, when controlling for potential endogeneity and distinguishing between different types announcements, disclosure on ACGC does not have value effects over the medium and long term.
Price and return equations with self-selection controls.
| Panel A. Price equation | ||||
|---|---|---|---|---|
| (1) | (2) | (3) | (4) | |
| BV | 1.2583*** (0.2134) | 1.2728*** (0.2081) | 0.1039*** (0.0345) | 1.1621*** (0.2209) |
| EPS | 4.6446*** (0.9550) | 4.6498*** (0.9577) | 5.4825*** (1.0530) | 4.7250*** (0.9485) |
| PRED_CG | −0.1630 (9.3283) | |||
| PRED_fidu | −2.7075 (7.6535) | |||
| PRED_transp | 2.6677 (11.66486) | |||
| PRED_gov | 8.7606 (7.5396) | |||
| Constant | 17.2748 (5.8511) | 17.2392*** (5.5408) | −0.9708 (9.2956) | 3.0898 (5.8988) |
| R squared | 0.66 | 0.67 | 0.54 | 0.67 |
| Observations | 101 | 101 | 101 | 101 |
| Hausman test | 7.53 | 9.91 | 7.91 | 8.31 |
| Panel B. Return equation | ||||
|---|---|---|---|---|
| (1) | (2) | (3) | (4) | |
| EPS | 0.0242 (0.0268) | 0.0196 (0.0265) | 0.0219 (0.0270) | 0.0231 (0.0267) |
| ΔEPS | 0.831* (0.4346) | 0.8107* (0.4189) | 0.7947* (0.4248) | 0.7941* (0.4233) |
| PRED_CG | −0.0577 (0.1828) | |||
| PRED_fidu | −0.2662 (0.2065) | |||
| PRED_transp | 0.1119 (0.2266) | |||
| PRED_gov | −0.0053 (0.1324) | |||
| Constant | 0.1711 (0.1111) | 0.2400 (0.1231) | 0.1140 (0.1427) | 0.1554 (0.1058) |
| R squared | 0.11 | 0.12 | 0.12 | 0.11 |
| Observations | 102 | 102 | 102 | 102 |
| Hausman test | 1.36 | 0.84 | 1.11 | 1.66 |
Standard errors in parentheses.
Panel A: The estimated model is Pit=α0+α1BVit+α2EPSit+α3PREDit+uit. BV is book value of equity, EPS is the earnings per share and PRED is the predicted degree of disclosure of different types of recommendations namely PRED_CG, PRED_fidu, PRED_transp and PRED_gov.
Panel B: The estimated model is Rit=α0+α1EPSit+α2ΔEPSit+α3PREDit+uit. EPS is the earnings per share ratio, ΔEPS is the change in earnings per share and PRED is the predicted degree of disclosure of different types of recommendations namely PRED_CG, PRED_fidu, PRED_transp and PRED_gov.
In the stock return regression (panel B), the predicted value of different types of corporate governance news as well as the predicted value for the aggregate measure are insignificant. Therefore, after controlling for endogeneity, news on corporate governance or its individual aspects are not relevant information in determining stock returns, suggesting that our previous result for fiduciary and transparency announcements was driven by self-selection. This general result for corporate governance is against evidence found by Goncharov et al. (2006) for the German market who find a positive and significant result. This is not the case in the Spanish market where investors do not seem to value corporate governance news in the medium-long term.
ConclusionsThis paper analyzes the information content of corporate governance announcements following the publication of the Aldama Code by Spanish quoted companies during the period 2003–2005. For that, we present two complementary analyses: an event study and an association analysis. In both cases, we distinguish between different types of announcements according to the ACGC classification and take into account the timeliness of information. This analysis allows providing deeper insights of the consequences of disclosure on corporate governance codes and helps disentangle previous contradictory evidence.
Results are interesting in two respects. First they show that Spanish market reacts to news on code compliance in the short run. Second, the possibility of distinguishing among different type of recommendations show that announcements which are more demanding in terms of company commitment with corporate governance present a positive and significant price reaction. This reaction turns out to be greater the higher the impact of the recommendation adopted on reducing agency problems (governing bodies news). However, this kind of information is not value-relevant for investor long-term decision making.
This study has demonstrated that Spanish markets react to news on ACGC code compliance in the short run. However, codes and legislation evolve together with markets and investors. Firm corporate governance will be evaluated against actual codes, probably more demanding. Market will probably react to adoptions that essentially reflect the ideal objective of good corporate governance, as was the case of the ACGC.
Natalia Utrero González acknowledges financial support from the Spanish Ministry of Education (SEJ 2010-16353/ECON) and (SEJ 2010-21393-C04-01/ECO). Francisco J. Callado Muñoz acknowledges financial support from the Spanish Ministry of Education (SEJ 2010-16353/ECON). We thank participants at 2007 SAE annual meeting, 2008 FMA European meeting, 2008 IEA World meeting and 2008 AEFIN Foro de Finanzas and especially M.A. García Cestona and C. López Gutiérrez for helpful comments on previous versions, the usual disclaimer applies.
articles