


This work aims to test whether social and environmental screening processes could determine the financial performance of ethical or Socially Responsible Investment (SRI) strategies in the European context. We compare the risk-adjusted returns and systematic risk levels obtained by the two mainstream SRI equity indexes in Europe with those achieved by their official benchmarks. We find that, although these SRI indexes do not underperform their benchmarks in terms of risk-adjusted returns, they experience higher levels of risk. Additionally, the results show that higher screening intensity results in higher risk for the SRI indexes. Furthermore, the underperformance in terms of risk associated with the SRI indexes is worse in periods when there is a market downturn. This may indicate that SRI indexes are more sensitive to changes in the market cycle, because SRI indexes include companies that are more affected by market fluctuations.
Socially responsible investment (SRI), also known as “ethical investment” (Renneboog et al., 2008a), considers factors such as respect for human rights, environmental preservation, and other social issues. This investment style, which mainly focuses on SRI funds; SRI equity indexes; and SRI stocks, allow investors to match their portfolio policy with their moral and ethical principles (Domini, 2001). The most significant increase in SRI has taken place during the last twenty years and, specifically, during the last decade. This increase has been highlighted by a recent European SRI market study1 carried out by EUROSIF (2010), reporting that the total SRI Assets under Management (AuM) in Europe reached €4986 billion in 2009, whereas they amounted to only €336 billion in 2002. This significant growth was mainly driven by the increasing demand from institutional and individual investors, by the mainstreaming of environmental, social, and governance principles into traditional financial services, and by external pressure from the biggest NGOs worldwide (EUROSIF, 2010).
This great expansion of SRI has awakened the interest of academics in carrying out researches to learn about the return and risk performance associated with this investment style (see Hamilton et al., 1993; White, 1995; Bauer et al., 2007; Benson and Humphrey, 2008; Nilsson, 2008; Lee et al., 2010; among others), but focused mainly on SRI funds (Fowler and Hope, 2007). This research aims to address if it is possible to do good while doing well when carrying out SRI strategies. To that end, this work analyzes the return and risk levels of the most relevant SRI equity index families in the European context: these are the Dow Jones Sustainability Stoxx Indexes and Dow Jones Sustainability EuroStoxx Indexes, which comprise the leading European listed companies in terms of sustainability. The analysis of these Dow Jones Sustainability Indexes (DJSI) is of special relevance because they have figured highly in the growth and consolidation of SRI markets in some regions, such as the US and Europe. This could be partially explained because of these indexes were the first tracking the financial performance of leading sustainability-driven companies worldwide. It is worth mentioning that although the European SRI market comprises other SRI equity indexes,2 the DJSI family applies a Best in Class screening approach, thus being more relevant for fostering ethical investments and environmental preservation (O’Rourke, 2003). This is crucial because the analysis of the performance of the DJSI family will allow managers to address the financial outcome of handling with reliable and objective ethical oriented portfolios (DJSI, 1999).
This paper is innovative in various aspects. First, it is focused on the European market, whereas most of the works analyzing the performance of SRI indexes are related to the US context (Kurtz and DiBartolomeo, 1996; Sauer, 1997; Statman, 2000, 2006). Second, we employ daily market data from a time-series of about nine years (2001–2010), instead of the monthly databases employed in most of the studies in the field, a decision that would make the estimations more reliable and robust. Further, the sample under analysis covers a period with a large increase in SRI at the global level, at the same time as investors have attained a significant level of knowledge about SRI equity indexes. This development has not been reflected in current literature which focuses on samples from earlier periods when there was less knowledge of SRI equity indexes by individual and institutional investors. This will bring new fresh insights about the risk/return performance of the SRI equity indexes analyzed. A third innovation is that we use two dynamic econometric models to estimate the risk levels of the SRI equity indexes, an aspect that has not been considered in the literature about SRI performance. This will give us more comprehensible and detailed results, which have not been shown by previous research in the field, which focused mainly on static econometric models and therefore could lead to obtain biased results. Specifically, we estimate the single and Fama and French (1993) three-factor market models modified in a state-space specification and estimated by the Kalman Filter algorithm. The literature shows that this approach (state-space specifications of the market model) provides a more precise measurement of the stocks and equity indexes’ systematic risk than that given by other models when daily market databases are employed (Wells, 1994; Brooks et al., 1998; Holmes and Faff, 2008). These econometric techniques will allow us to capture SRI equity indexes’ systematic risk evolution across the considered sample. This information could be relevant for investors because they could appreciate the behavior of the SRI equity indexes’ systematic risk both in bull and bear market periods. Fourth, the paper looks into a timeframe that covers the financial downturn, which occurred in the second half of 2008. This is of special interest because it could be tested if this event influences the return and risk levels of the SRI equity indexes considered.
The rest of the paper is organized as follows. The next section analyses the previous literature on this topic and introduces the research hypotheses. The third section focuses on the methods applied, sample selection, and data description. Section four shows the results and, finally, Section 5 contains the conclusions and implications of the work and proposes further research opportunities in this field.
2Previous findings and hypothesesUnder the Modern Portfolio Theory (MPT), SRI will systematically underperform conventional investment strategies mainly because SRI portfolios are subsets of the market portfolio (Renneboog et al., 2008a). This idea is also in line with the proposals established by the supporters of the efficient market hypothesis. In addition, MPT states that the SRI screening process reduces the investment universe, which leads to a reduction in the risk-adjusted return and diversification opportunities of this type of investment strategy. Under this scenario, many researchers have put much effort into testing these principles. Most of them focus on measuring the performance of SRI funds (Bauer et al., 2005; Barnett and Salomon, 2006; Benson et al., 2006; Bauer et al., 2007; Renneboog et al., 2008b; Derwall and Koedijk, 2009; Lee et al., 2010). A global analysis of these works indicates that SRI funds, in general, do not underperform the conventional ones.
Previous research about SRI performance also comprises some papers that analyze the financial outcomes of investing in SRI equity Indexes. Most of the research about SRI equity indexes performance has been focused on the Domini Social Index (DSI). Luck and Pilotte (1993) and Kurtz and DiBartolomeo (1996) conclude that the DSI outperformed the S&P500 during the 1990–1992 period. However, Sauer (1997) and DiBartolomeo and Kurtz (1999) which focus on larger samples (from 1986 to 1996) find no evidence of out or underperformance of the DSI compared with its benchmark (S&P500). Other research about the performance of the DSI (Luck, 1998; Statman, 2000) conclude that this SRI equity index did not show significant differences in the performance levels than the obtained by the S&P 500. Other works focus on different SRI equity indexes. Specifically, Jin et al. (2006) find that the Morningstar – SRI Japan and the FTSE4Good Japan indexes outperformed the TOPIX stock market index in terms of risk-adjusted returns. Furthermore, Statman (2006) analyzed the Calvert Social Index and the Citizens Index and concludes that these SRI indexes showed similar returns that of the obtained by the S&P 500. Moreover, Collison et al. (2008) analyzed the FTSE4Good index and find that this index outperformed the FTSE100 index during the 1996–2005 period. However, the risk assessment of SRI equity indexes seems to be scarcely analyzed. There are two exceptions: (a) Collison et al. (2008) who conclude that FTSE4Good indexes turned riskier than the FTSE indexes; and (b) Schröder (2007) who analyzes 29 SRI equity indexes around the world and concludes that these non-conventional indexes showed similar or higher risk levels than their benchmarks (except the Humanix 175 U.S. and the FTSE4Good UK).
Most of these works use static econometric techniques like computing Sharpe and Treynor ratios (Sauer, 1997; Statman, 2000, 2006; Schröder, 2007), or estimating the traditional/multifactor market model (DiBartolomeo and Kurtz, 1999; Garz et al., 2002). Consequently, they may present biased estimates of SRI equity indexes performance. This is mainly due to two issues: (1) Sharpe and Treynor ratios can be manipulated by strategies that can change the shape of the probability distribution of SRI indexes’ returns (Henriksson and Merton, 1981; Dybvig and Ingersoll, 1982); and (2) the single/multifactor traditional market model supposes that the beta parameter does not vary over time, an aspect that is not in line with many works in the financial-econometrics literature, which demonstrates that this parameter is time-varying (Bos and Newbold, 1984; Harvey, 1989b; Ferson and Harvey, 1991). The econometric models developed in this research overcome these limitations and will allow us to evaluate whether there are differences in the performance of SRI equity indexes under different market conditions (bull and bear periods).
We propose to test the following hypothesis:H1 SRI equity indexes underperform their official benchmarks in terms of risk-adjusted returns.
Failure to reject H1 will confirm the principles established by MPT, which indicates that expected risk-adjusted returns of SRI equity indexes might be lower than the market portfolio (or a conventional equity index taken as a benchmark). This could be due to the fact that SRI equity indexes do not consider some financially strong stocks because of ethical and moral restrictions.H2 SRI equity indexes are riskier than their official benchmarks.
Failure to reject H2 will also be in line with the proposals of the MPT, which proposes that there are lower diversification possibilities for the SRI equity indexes. This effect will cause the SRI equity indexes to exhibit higher risk levels than the market portfolio.H3 Greater screening intensity reduces risk-adjusted returns and increases risk of SRI equity indexes.
Failure to reject H3 will confirm the MPT proposals because the screening intensity restricts the number of companies that may be included in the different SRI equity indexes (subsets of the main SRI equity indexes), according to several ethical and moral principles (not considering companies that make profits from alcohol, gambling, tobacco, armaments, firearms, adult entertainment products, among others), thus reducing diversification possibilities (increasing the level of risk) and disregarding possible profitable companies (decreasing the risk-adjusted return level).
3Method and sample3.1Econometric modelsThis paper begins with the estimation of the conventional market model, which gives the relationship between the risk and return of an asset, and is expressed by the following equation:
where ri,t is the excess return of stock i in period t; rm,t is the excess return of the market portfolio (or benchmark) in period t; βi is the systematic risk of stock i; αi parameter, known in the literature as Jensen's Alpha (Jensen, 1968), will show the out- or underperformance (if it is positive or negative and statistically different from zero) of stock i compared to the market portfolio. Additionally, ¿i,t is the non-systematic risk of stock i and is modeled on a homoskedastic white noise process. Under this approach, βi is assumed to be constant over time and, using the Ordinary Least Squares (OLS) algorithm, it is obtained as βi=Cov(ri,t, rm,t)/Var(rm,t). This assumption (βi stability) seems to be incompatible with the abundant empirical literature arguing for the time-varying behavior of most stocks and equity indexes’ systematic risk at a global level (Blume, 1971; Bos and Newbold, 1984; Harvey, 1989b; Ferson and Harvey, 1991, 1993; Holmes and Faff, 2004; Benson et al., 2007); this behavior is mainly due to those stocks’ return time-series being non-stationary (Bos and Newbold, 1984; Brooks et al., 1992; Groenewold and Fraser, 1999). Among the econometrics models which have been developed in order to allow the beta parameter over time, it can be highlighted the following ones: (a) time varying beta models which consider a constant and a variable component, the latter being a function of the market status (Fabozzi and Francis, 1977); (b) dynamic beta models where the beta coefficient is a function of the market volatility (Schwert and Seguin, 1990); (c) stochastic volatility models (Yu, 2002); (d) generalized Autoregressive Conditional Heteroskedasticity (GARCH) models (Engle et al., 1988); (e) Markov switching regression models (Fridman, 1994); and (f) conditional market models where the beta coefficients are a function of several state variables (Jagannathan and Wang, 1996). However, previous research about time-varying betas indicates that, when using market daily data, the state-space market model provides the better performance (Black et al., 1992; Brooks et al., 1998; Faff et al., 2000). Specifically, Mergner and Bulla (2008) investigated the time-varying behavior of beta for eighteen pan-European sectors over the 1987–2005 period and using six different modeling techniques. They concluded that ex-ante forecast performances of the different models show that the state-space market model is the preferred model to describe and forecast the time-varying behavior of sector betas in a European context. Furthermore, Choudhry and Wu (2009) investigated the forecasting ability of three different GARCH models and the state-space market model. The main results overwhelmingly support the state-space market model to forecast the stock returns (based on time-varying beta) of twenty UK companies.
Thus, the present work proposes a modified market model in a state-space specification to estimate the dynamics of the beta coefficients recursively. This model is given by the following equations:
where 0≤|ϕi|≤1 represents the constant transition parameter, also known as the speed parameter; β¯i can be interpreted as the mean beta over the entire sample; and the error terms for the Eq. (2), ¿i,t, and Eq. (3), ηi,t, are assumed to be Gaussian, with E[εi,tεi,τ]=δt,τσε,i2 and E[ηi,tηi,τ]=δt,τση,i2, where δt,τ=1 if t=τ and 0 otherwise. Further, ¿i,t and ηi,t are mutually independent so that E[¿i,tηi,τ]=0 for all t and τ. Eq. (2) refers to the first observation equation proposed, where the βi,t coefficient is allowed to vary over time in terms of an AR(1) stationary process (given by the state Eq. (3)), including three of the most common stochastic specifications used in the literature (Moonis and Shah, 2003; Yao and Gao, 2004). If ϕi=1, the beta coefficient follows a Random Walk (RW) process given by βi,tRW=βi,t−1+ηi,t. If, on the other hand, ϕi=0, the beta coefficient follows a random coefficient (RC) process given by βi,tRC=β¯i+ηi,t. Finally, if 0<|ϕi|<1, the beta coefficient follows an AR(1) stationary process (also known as a mean-reverting (MR) process), which can be expressed as βi,tMR=β¯i+ϕi(βi,t−1−β¯i)+ηit.

However, previous findings indicate that the single factor market model (defined by Eq. (1) and in a state-space specification by Eqs. (2) and (3)) could lead to obtaining biased αi and βi coefficients. This is mainly because, as stated by Fama and French (1993), a stock's expected return depends not only on the sensitivity of its return to the market portfolio return, but also on the returns on two portfolios meant to mimic additional risk factors. In accordance with this idea, we modify the first observation equation given by (2) to account for these additional risk factors3 (see for instance, Miralles et al., 2012). Thus, the second observation equation can be expressed as:

Eqs. (4) and (3) represent a state-space specification of the Fama and French (1993) three-factor model where the βi coefficient is allowed to vary over time according to the estate equation given by (3).4 Under this approach, SMBt is the return on the mimicking portfolio for the size factor in period t (which is the difference between the returns on a portfolio of small stocks and a portfolio of big stocks: small minus big – SMB); and HMLt is the return on the mimicking portfolio for the book-to-market factor in period t (which is the difference between the returns on a portfolio of high book-to-market stocks and a portfolio of low book-to-market stocks: high-minus-low – HML). The size factor (SMBt) has been constructed by the difference between the return of the thirty percent of the companies with lower market capitalization and the return of the thirty percent of the companies with higher market capitalization. Furthermore, the HMLt factor has been obtained by the difference between the return of the thirty percent of the companies with a higher book-to-market ratio and the return of the thirty percent of companies with a lower book-to-market ratio.5 Finally, the unknown parameters are estimated by numerical optimization of the likelihood function proposed by Harvey (1989a).
3.2Sample delimitation and descriptive analysisThis paper considers two of the most relevant SRI equity indexes in the European context: the Dow Jones Sustainability Stoxx Index (DJSI-Stoxx) and the Dow Jones Sustainability EuroStoxx Index (DJSI-EuroStoxx). These indexes comprise firms ranked by market capitalization, selected from a panel of companies that have been screened in their environmental and social dimensions. Specifically, the DJSI-Stoxx focuses on the European corporations with the highest Corporate Social Responsibility (CSR) scores among those included in the Dow Jones Stoxx 600 Index (DJ-Stoxx 600). In addition, the DJSI-EuroStoxx comprises the leading companies in terms of CSR of the Dow Jones EuroStoxx 600 Index (DJ-EuroStoxx 600), which covers the main quoted companies in the Eurozone. Furthermore, two subsets of each one of these SRI equity indexes have also been analyzed. These are: (a) the DJSI-Stoxx ex AGTF/DJSI-EuroStoxx ex AGTF Indexes that are subsets of the DJSI-Stoxx/DJSI-EuroStoxx Indexes which excludes companies that generate revenue from alcohol, gambling, tobacco, armaments, and firearms, and (b) the DJSI-Stoxx ex AGTAFA/DJSI-EuroStoxx ex AGTAFA that are subset indexes from DJSI-Stoxx/DJSI-EuroStoxx Indexes which exclude companies that generate revenue from alcohol, gambling, tobacco, armaments, firearms, and adult entertainment. The official benchmark of the DJSI-Stoxx, DJSI-Stoxx ex AGTF and the DJSI-Stoxx ex AGTAFA is the DJ-Stoxx 600, and the official benchmark of the DJSI-EuroStoxx, DJSI-EuroStoxx ex AGTF and the DJSI-EuroStoxx ex AGTAFA is the DJ-EuroStoxx 600. The subsets of each main SRI equity Index have been selected in order to test H3 hypothesis, because these indexes show higher screening intensity. This is because these subsets do not comprise other “sin” companies involved in controversial businesses, such as previously introduced.
Historical data about the stock indexes’ closing prices are freely available at the STOXX Limited Webpage (http://www.stoxx.com/index.html). This work comprises data from October 15, 2001 to December 30, 2010, a total of 2396 closing prices (in US Dollars6). The return of the US Treasury Bill at one month has been taken as a proxy of the risk-free asset return.7 In this work, the return of the risk-free asset at one day was computed in order to obtain the continuous compounded daily excess returns for all the indexes (ri,t for the SRI equity indexes and rm,t for their benchmarks), according to the following expression:
where pi,t is the closing price of the stock index i adjusted by dividends and capital increases on day t; ln is the natural logarithm; and rtℓ is the return on the risk-free asset on day t. The dataset comprises two bull market periods (from January 2003 to March 2008 and from January 2009 to December 2011) and two bear market periods (from October 2001 to December 2002 and from April 2008 to December 2008). It is interesting to note that the first bear period and the last bear and bull periods coincide with the post Dot-com bubble effects and the emergence of a global financial crisis that led to the main developed countries entering into a period of economic recession. The data about the size and book-to-market factors (SMB and HML) have been computed as mentioned in the methodology section. These two factors (SMB and HML) have been computed for the DJ-Stoxx 600 and for the DJ-EuroStoxx 600 (SMBs and HMLs for the DJ-Stoxx 600 and the SMBe and HMLe for the DJ-EuroStoxx 600).
Table 1 shows the main descriptive statistics of excess returns for the SRI equity indexes and the Fama and French factors (Fama and French, 1993) and Table 2 shows the correlations between the Fama and French factors. Several features of these tables warrant comment. First, all of the SRI equity indexes display a negative average daily excess return. The lowest mean daily losses are shown by the DJ-EuroStoxx 600 index (−0.0036%), followed by the DJ-Stoxx 600 index (−0.0043%), while the DJSI-Stoxx ex AGTAF showed the greatest mean daily losses (−0.0097%). Second, the level of risk, measured by the standard deviation of excess daily returns, reaches its lowest value in the DJ-Stoxx index, followed by the DJSI-Stoxx index, whereas the highest risk levels are shown by the DJSI-EuroStoxx ex AGTAF index.
Basic descriptive statistics of the equity indexes’ daily excess returns and Fama and French factors.
| Mean | Std. dev | Skewness | Kurtosis | J-B | ARCH (8) | |
| SRI equity indexes | ||||||
| DJSI EuroStoxx | −0.0082% | 1.5995 | 0.0379 | 7.6112 | 1893.80*** | 72.06*** |
| DJSI EuroStoxx ex AGTAF | −0.0096% | 1.6331 | 0.0620 | 7.7392 | 2001.25*** | 68.00*** |
| DJSI EuroStoxx ex AGTAFA | −0.0071% | 1.6295 | 0.0566 | 7.7343 | 1996.86*** | 68.01*** |
| DJSI Stoxx | −0.0087% | 1.4281 | −0.0405 | 8.3930 | 2590.36*** | 85.93*** |
| DJSI Stoxx ex AGTAF | −0.0097% | 1.4527 | −0.0293 | 8.3446 | 2543.78*** | 83.80*** |
| DJSI Stoxx ex AGTAFA | −0.0091% | 1.4424 | −0.0391 | 8.4535 | 2648.67*** | 85.07*** |
| Benchmarks | ||||||
| DJ EuroStoxx 600 | −0.0036% | 1.4532 | −0.0286 | 8.0648 | 2284.40*** | 80.48*** |
| DJ Stoxx 600 | −0.0043% | 1.3661 | −0.0542 | 8.6975 | 2891.48*** | 95.74*** |
| Fama and French factors | ||||||
| SMBe | 0.0193% | 0.6866 | −0.4099 | 7.0623 | 1665.22*** | 67.88*** |
| SMBs | 0.0226% | 0.6241 | −0.5394 | 8.3963 | 2936.22*** | 62.33*** |
| HMLe | 0.0079% | 0.4452 | 0.0992 | 15.4425 | 15,014.43*** | 77.32*** |
| HMLs | 0.0006% | 0.3883 | 0.3666 | 8.1462 | 2619.92*** | 50.31*** |
This table shows the basic descriptive stats of the daily excess returns of the different SRI equity indexes and Fama and French factors (Fama and French, 1993) considered in this research. Six Fama and French factors are analyzed in this work. The first two relate to the market portfolios. In this research, two conventional stock indexes have been taken as the benchmark for each SRI equity indexes family (the DJ Euro Stoxx 600 for the DJSI EuroStoxx indexes and the DJ Stoxx 600 for the DJSI Stoxx indexes). The remaining factors refer to the return on the mimicking portfolio for the size (SMB) and book-to-market (HML) factor, respectively (SMBe and HMLe for the DJSI EuroStoxx indexes and SMBs and HMLs for the DJSI Stoxx indexes). J–B refers to the estimated values of the Jarque–Bera normality test. The ARCH test refers to the estimated values of the Engle (1982) heteroskedasticity test. The ARCH test is based on the analysis of the residuals of a random walk model adjusted to the continuous excess returns series. The number of lags is determined by the natural logarithm of the number of observations: Ln(2395)=7.78. According to Tsay (2005), simulation studies suggest that this lag selection process provides the best power performance of Box–Ljung type tests.
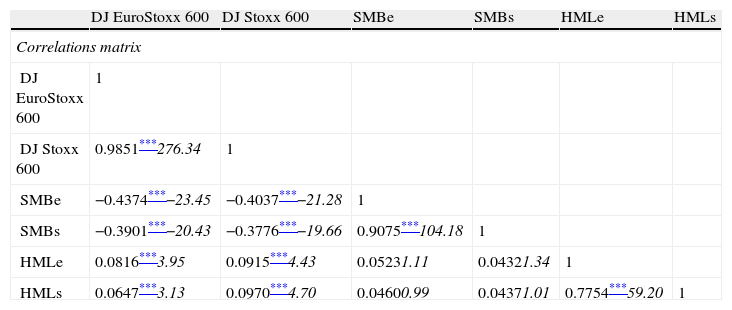
Correlations between the benchmarks and Fama and French factors and estimates of the single-factor market models.
| DJ EuroStoxx 600 | DJ Stoxx 600 | SMBe | SMBs | HMLe | HMLs | |
| Correlations matrix | ||||||
| DJ EuroStoxx 600 | 1 | |||||
| DJ Stoxx 600 | 0.9851***276.34 | 1 | ||||
| SMBe | −0.4374***−23.45 | −0.4037***−21.28 | 1 | |||
| SMBs | −0.3901***−20.43 | −0.3776***−19.66 | 0.9075***104.18 | 1 | ||
| HMLe | 0.0816***3.95 | 0.0915***4.43 | 0.05231.11 | 0.04321.34 | 1 | |
| HMLs | 0.0647***3.13 | 0.0970***4.70 | 0.04600.99 | 0.04371.01 | 0.7754***59.20 | 1 |
| DJSI-Stoxx | DJSI-Stoxx ex AGTF | DJSI-Stoxx ex AGTAFA | DJSI-EuroStoxx | DJSI-EuroStoxx ex AGTF | DJSI-EuroStoxx ex AGTAFA | |
| Single factor market models’ estimates | ||||||
| αi | −0.0002 (0.0031) | 0.0005 (0.0035) | 0.0019 (0.0037) | 0.0047 (0.0046) | 0.0053 (0.0052) | 0.0076 (0.0053) |
| βi | 1.0199*** (0.0023) | 1.0367*** (0.0026) | 1.0484*** (0.0027) | 1.0708*** (0.0032) | 1.0814*** (0.0036) | 1.0986*** (0.0036) |
| AIC | −1.0233 | −0.9901 | −0.7063 | −0.5098 | −0.2193 | −0.1564 |
| BIC | −1.0352 | −1.004 | −0.7102 | −0.5109 | −0.2199 | −0.1591 |
The first panel of this table shows the correlations between the SRI equity indexes’ benchmarks and the Fama and French factors (Fama and French, 1993). These are the return of the DJ Euro Stoxx 600 and the return of the DJ Stoxx 600, representing the market portfolio (in this case two equity indexes taken as the benchmarks) for the DJSI EuroStoxx and the DJSI Stoxx indexes families. The remaining factors refer to the return on the mimicking portfolio for the size (SMB) and book-to-market (HML) factor, respectively (SMBe and HMLe for the DJSI EuroStoxx indexes and SMBs and HMLs for the DJSI Stoxx indexes). The values in italics refer to the t-Student statistics for each correlation. The second panel of this table gives the estimates of the single-factor market models for each of the SRI analyzed. The values in parentheses refer to the standard errors.
Third, all the return series show high levels of leptokurtosis and asymmetry. This may indicate that all the analyzed series are non-normally distributed. This effect is confirmed after looking at the values of the Jarque–Bera (J-B) normality tests. The null hypothesis of the J-B test could not be accepted for every SRI equity index and Fama and French factor return series. All the series are highly heteroskedastic, a common characteristic in high-frequency financial data. Fourth, the average daily market risk premium is negative for the two stock indexes taken as the benchmarks for the two families of SRI equity indexes. These are −0.0036% and 0.0043% for the DJ EuroStoxx 600 and DJ Stoxx 600, respectively. Although this is not consistent with the assumption of risk aversion, it is crucial to state that the sign of these coefficients have been highly influenced by the losses experienced by the main stock exchange indexes during the financial crisis. As noted by Fama and French (1993), the mean daily returns for the derived size (SMBe and SMBs) and book-to-market factors (HMLe and HMLs) are positive, thus according with the size and value stock effects.
Table 2 shows that the two benchmarks are highly correlated (0.9851). Finally, and as can be expected, the correlation between the proxy SMB and HML factors of each market portfolio (in this case for the two equity indexes taken as the benchmarks, i.e., DJ EuroStoxx 600 and DJ Stoxx 600) is close to zero and statistically insignificant, thus being consistent with the mimicking portfolios of Fama and French (1993).
4Results and discussionTable 3 shows the parameters estimated by the single and three-factor state-space market models, described by Eqs. (2)–(3) and (4)–(3), respectively. These models have been estimated by applying the BHHH (Berndt et al., 1974) optimization algorithm. The models’ goodness of fit has been measured through the Akaike's Information Criterion (AIC) and the Bayesian Information Criterion (BIC), expressed by the following equations:
where logL refers to the natural logarithm of the likelihood function value in estimating the maximum likelihood estimation (MLE) of θi (θˆi); T is the number of observations; and k the number of parameters in the model. The BIC criterion has been computed in order to control the appearance of better levels of goodness of fit for the models with more degrees of freedom.

Estimates of the three factor state-space market models.
| SRI equity index | Spec. | σε,i2 | ση,i2 | αi | β¯i | si | hi | ϕi | LogL | AIC | BIC |
| DJSI-Stoxx | MR | 0.0106 | 0.0028 | −0.0028 (0.0024) | 1.0372††† (0.0026) | −0.1634*** (0.0032) | −0.0465*** (0.0045) | 0.1398*** (0.0445) | 1631.30 | −1.3960 | −1.3787 |
| RC | 0.0106 | 0.0029 | −0.0029 (0.0024) | 1.0378††† (0.0025) | −0.1641*** (0.0032) | −0.0482*** (0.0045) | n.a. | 1629.48 | −1.3953 | −1.3805 | |
| RW | 0.0144 | <0.0001 | −0.0028 (0.0026) | n.a. | −0.1646*** (0.0030) | −0.0492*** (0.0042) | n.a. | 1548.47 | −1.3266 | −1.3142 | |
| DJSI-Stoxx ex AGTF | MR | 0.0127 | 0.0042 | −0.0038 (0.0027) | 1.0532††† (0.0031) | −0.1648*** (0.0037) | −0.0512*** (0.0054) | 0.1911*** (0.0385) | 1364.80 | −1.1670 | −1.1497 |
| RC | 0.0127 | 0.0044 | −0.0038 (0.0027) | 1.0537††† (0.0029) | −0.1652*** (0.0037) | −0.0517*** (0.0052) | n.a. | 1361.18 | −1.1647 | −1.1499 | |
| RW | 0.0176 | <0.0001 | −0.0043 (0.0030) | n.a. | −0.1695*** (0.0034) | −0.0583*** (0.0048) | n.a. | 1280.45 | −1.0962 | −1.0839 | |
| DJSI-Stoxx ex AGTAFA | MR | 0.0165 | 0.0037 | −0.0030 (0.0030) | 1.0601††† (0.0031) | −0.1702*** (0.0041) | −0.0754*** (0.0059) | 0.1090** (0.0456) | 1160.71 | −0.9916 | −0.9742 |
| RC | 0.0165 | 0.0037 | −0.0030 (0.0030) | 1.0606††† (0.0030) | −0.1714*** (0.0041) | −0.0766*** (0.0057) | n.a. | 1160.05 | −0.9919 | −0.9770 | |
| RW | 0.0208 | <0.0001 | −0.0046 (0.0032) | n.a. | −0.1728*** (0.0039) | −0.0781*** (0.0054) | n.a. | 1105.47 | −0.9458 | −0.9335 | |
| DJSI-EuroStoxx | MR | 0.0209 | 0.0044 | −0.0007 (0.0034) | 1.0913††† (0.0034) | −0.2165*** (0.0055) | −0.0484*** (0.0071) | −0.0570 (0.0506) | 862.17 | −0.7350 | −0.7177 |
| RC | 0.0208 | 0.0045 | −0.0007 (0.0034) | 1.0914††† (0.0035) | −0.2179*** (0.0055) | −0.0489*** (0.0069) | n.a. | 861.89 | −0.7356 | −0.7208 | |
| RW | 0.0290 | <0.0001 | −0.0004 (0.0036) | n.a. | −0.2193*** (0.0053) | −0.0596*** (0.0051) | n.a. | 758.39 | −0.6475 | −0.6352 | |
| DJSI-EuroStoxx ex AGTF | MR | 0.0240 | 0.0078 | −0.0022 (0.0037) | 1.1089††† (0.0039) | −0.2196*** (0.0062) | −0.0597*** (0.0080) | −0.0731 (0.0728) | 587.02 | −0.4985 | −0.4812 |
| RC | 0.0239 | 0.0080 | −0.0022 (0.0037) | 1.1088††† (0.0040) | −0.2208*** (0.0062) | −0.0604*** (0.0079) | n.a. | 586.34 | −0.4988 | −0.4840 | |
| RW | 0.0379 | 0.0001 | −0.0020 (0.0044) | n.a. | −0.2219*** (0.0061) | −0.0625*** (0.0059) | n.a. | 397.80 | −0.3376 | −0.3252 | |
| DJSI-EuroStoxx ex AGTAFA | MR | 0.0284 | 0.0064 | 0.0011 (0.0039) | 1.1104††† (0.0038) | −0.2228*** (0.0067) | −0.0723*** (0.0083) | −0.0634 (0.0623) | 485.47 | −0.4090 | −0.3939 |
| RC | 0.0280 | 0.0070 | 0.0011 (0.0039) | 1.1107††† (0.0041) | −0.2239*** (0.0068) | −0.0735*** (0.0082) | n.a. | 481.83 | −0.4112 | −0.3941 | |
| RW | 0.0406 | 0.0001 | 0.0004 (0.0045) | n.a. | −0.2247*** (0.0065) | −0.0777*** (0.0062) | n.a. | 329.66 | −0.2790 | −0.2667 |
This table shows the parameters estimated by the three-factor state-space market models, described by Eqs. (2) and (3), (4) and (3), respectively. The second column of the table show the stochastic process followed by the time-varying betas which have been computed as mentioned in Section 3.1: these are (a) mean reverting (MR); (b) random coefficient (RC); and (c) random walk (RW). The model with the best level of goodness of fit measured by the AIC and BIC criteria is shown in bold. The values in parentheses refer to the standard errors.
Estimates show that the Fama and French (1993) three-factor market models better explain the expected returns of all the SRI equity indexes. This is because the AIC and BIC criteria show lower values than those observed for the single-factor market models (see for instance Table 2). Additionally, si and hi parameters are statistically different from zero for all the considered SRI equity indexes. For these reasons, the hypotheses testing will focus on the results obtained by these models (instead of those provided by the single-factor market models). As shown in Table 3, none of the values estimated for the αi parameters are significant, thus indicating that the risk-adjusted returns obtained by the SRI equity indexes did not statistically differ from those obtained by their official benchmarks. This is in line with recent studies focused on similar time-frames, but focused on SRI funds (Fernandez and Matallin, 2008; Climent and Soriano, 2011), which suggest that SRI funds achieved adjusted returns not significantly different from the conventional ones. Contrary to expectations by the MPT, the SRI equity indexes considered do not underperform their benchmarks during the analyzed period. These findings are not consistent with the fact that SRI underperforms their benchmarks because they decline to invest in some profitable firms that could be ethically problematic. In accordance with these considerations, H1, which indicates that the SRI equity indexes will show lower risk-adjusted returns, cannot be accepted.
After having discussed the differences in risk-adjusted returns between the SRI and conventional equity indexes, we continue to analyze their risk levels. The MPT indicates that the risk for SRI equity indexes should be higher due to the diversification restrictions. Our results presented in Table 3 are consistent with this consideration. As expected, all of these betas are statistically different from one (the value that indicates similar risk levels between SRI equity indexes and their benchmarks). Additionally, all the SRI equity indexes show betas higher than one, which indicate that SRI equity indexes are more risky than their benchmarks. Because of these results, H2, which states that SRI equity indexes will turn riskier than their benchmarks, cannot be rejected.
More interestingly, the econometric model proposed allows us to test H2 dynamically across the entire sample analyzed. Thus, we further investigate whether the difference in the risk levels of SRI equity indexes and their benchmarks depends on the market conditions. To do this, Fig. 1 shows the evolution of the point and interval estimation of the betas for the Fama and French (1993) three-factor market models.

Conditional betas of SRI equity indexes estimated by the three-factor state-space market model. This figure shows the point and interval estimation of the SRI equity indexes betas. Red dashed lines show the interval estimation of the beta of each index provided by the three factor state-space market models. Blue lines show the point estimation of each index beta. Black lines indicate a beta equal to one.
As shown by Fig. 1, the conditional beta series of all the SRI equity indexes analyzed are time-varying and are always higher than one across the sample. Due to that consideration, H2 cannot be rejected, thus validating the conclusions reached after looking at the parametric estimates contained in Table 3. However, the time-varying behavior of all the conditional betas shown in Fig. 1 gives us additional interesting information. The conditional beta series of all the SRI equity indexes seem to be influenced by the market conditions (growing in bear periods but decreasing during the bull periods). Higher variability of the SRI equity indexes betas is observed during the two bear periods (from October 2001 to December 2002 and from April 2008 to December 2008, which coincide with the post Dot-com bubble effects and the financial crisis, respectively), an aspect that is not very surprising because of the well-documented higher variability of equity indexes in downturns. However, it is interesting to note that higher levels of the SRI equity indexes betas are observed during these periods. This indicates that the SRI equity indexes are a riskier investment alternative than conventional ones when the market declines. Specifically, the increase of systematic risk of the SRI equity indexes during the two bear periods is on average from 8% to 20%. This effect may be due to the business cycle's low influence on the performance of the conventional equity indexes (in this case the two benchmarks). As an example, the SRI equity indexes analyzed do not consider companies producing weapons, tobacco, and other “non-ethical” activities. These excluded companies may be less sensitive to changes in overall economic conditions; thus including them in a portfolio provides greater protection levels against market downturns.
Fig. 2 shows a graphical comparison between the conditional time-varying point betas estimates of the SRI equity indexes considered. As expected by the MPT, the figure indicates that the main SRI equity indexes (DJSI-Stoxx and DJSI-EuroStoxx) are in general less risky than their subsets.

This seems to indicate that the DJSI screening intensity increases the SRI equity indexes’ systematic risk. This is confirmed if we look at the mean beta coefficients (β¯i) provided by Table 3 for each SRI equity index, which presents higher values as screening intensity increases. Because of these considerations, H3 cannot be rejected. These results are in accordance with the proposals of the MPT and are also in line with the conclusions reached by previous research in the field that focused on SRI funds (Barnett and Salomon, 2006; Renneboog et al., 2008b; Lee et al., 2010); these indicate that any moral and ethical benefits received from investing in SRI equity indexes are linked to reducing the diversification opportunities and increasing the SRI equity indexes’ systematic risk.
5ConclusionThis paper aims to test whether social and environmental screening processes influence the financial performance of SRI strategies in the European context. To do so, we compare the risk-adjusted returns and systematic risk levels obtained by the two main SRI equity indexes in Europe (Dow Jones Sustainability Stoxx and EuroStoxx indexes) with those achieved by their benchmarks (DJ-Stoxx 600 and DJ-EuroStoxx 600) from a time-series of about nine years (from 2001 to 2010), a period that covers the recent financial downturn and the effects of the Dot-com bubble. We propose a modified state-space specification of the single and Fama and French (1993) three-factor market models to estimate both the SRI risk-adjusted returns and their systematic risk.
Our investigation yielded new interesting insights to the existing body of literature on the topic. First, there were non-significant differences between the risk-adjusted returns obtained by the SRI equity indexes and their benchmarks. Due to that, investors are not subject to a higher risk premium for investing in SRI equity indexes than for investing in traditional ones. These effects are contrary to the principles established by the MPT and the efficient market hypothesis, which consider that SRI will systematically underperform the conventional investment approach, mainly because SRI are subsets of the market portfolio. These results may indicate that investors can choose SRI in accordance with their ethical values and beliefs without being forced to sacrifice return performance.
However, our research shows that the systematic risk associated with the SRI equity indexes is in general higher than that of their benchmarks. Additionally, the results indicate that higher screening intensity results in higher systematic risk for the SRI equity indexes. These considerations are in line with MPT proposals, which tell us that SRI is normally riskier than the conventional investment approach, mainly because the SRI screening process reduces the investment universe, lowering diversification opportunities. Additionally, the underperformance in terms of risk associated with the SRI equity indexes is worse in periods of downturns in the market. This may indicate that SRI equity indexes are more sensitive to changes in the market cycle. This could be because SRI equity indexes include companies that are affected to a larger extent by fluctuations in the market cycle, whereas their benchmarks comprise stocks in other sectors, such as the weapon; tobacco; alcohol; and adult entertainment sector, which are not affected to the same extent by market fluctuations.
Taking all of these ideas together, we can conclude that, although the SRI equity indexes do not underperform their benchmarks in terms of market return, investing in SRI alternatives will result in experiencing higher levels of risk. This may demystify the outperformance, measured in terms of return and risk, of investing in SRI equity indexes in a European context. Thus, investors do not have financial incentives to invest in these SRI equity indexes (leaving aside moral claims, personal convictions, and ethical principles).
This paper opens further interesting future research opportunities on the topic. Given the suitability of the econometric model applied, it would of use to implement the model in the analysis of several SRI equity indexes previously analyzed in the field. Further, this will allow understanding how the different screening methods influence the SRI equity indexes performance (such as the FTSE4Good family indexes). It would be of interest to test whether the SRI equity indexes, not only for the European context, are more or less sensitive than their official benchmarks to changes in short and long-term global economic conditions. To the best of our knowledge, the issue has not been analyzed until now, and a global analysis of return and volatility spillovers between SRI and conventional equity indexes will facilitate the giving of responses to that issue. Given that conventional diversification opportunities, such as country and sector-based strategies, decrease with integration of the global economies, it would be of interest to test whether SRI equity indexes could be a success portfolio diversification process to improve portfolios’ financial performance.
The authors are grateful to financial help from the Spanish Education Ministry (research projects SIRCARSO SEJ2006-08317, SEJ2006-0395, MTM 2008-00625 and ECO2011-26171) and from the Zaragoza University (research projects UZ2009-SOC-08 and UZ2010-SOC-04). The usual disclaimer applies.
This report was released on October 13, 2010, based on information as of December 31st, 2009. The next edition of the study will be available in the fall of 2012 and will be based on data as of December 31st, 2011.
Other relevant SRI indexes under the European scheme are the FTSE4Good family indexes.
It is worth mentioning that the empirical work has been replicated using the Carhart (1997) four-factor model. The momentum risk factor (MOM) of that model has been constructed according with Miralles et al. (2012). However, the MOM risk factor was non-significant leading the Carhart (1997) four-factor model with lower levels of goodness of fit. This data has not been included in this research for readability purposes, but being available upon request.
It is necessary to mention that the econometric model defined by Eqs. (4) and (3) has been estimated but supposing that the si and hi are time-varying and following the more wide stochastic process (this is the MR process). The results obtained clearly indicate that these coefficients are not time-varying, thus overwhelming the observation Eq. (4) proposed in this research. This data has not been shown but it is available upon request to the authors.
It is interesting to note that, alternatively than indicated in the methodology section, the HML and SMB factors have been also computed by the method proposed by Faff (2001). However, the results obtained and the estimates were similar than those obtained by the method introduced in this paper.
Although all of the indexes analyzed in this research are actually priced in Euros and USD Dollars, when collecting the data they were only available in US Dollars. However, this issue seems not to have any significant impact when testing the working hypotheses.
This choice has been made in order to avoid the possible appearance of a currency bias because all the SRI indexes considered are priced in USD.