


The main objective of this study is to investigate the intellectual structure and evolution of author collaborations from articles published in the Strategic Management Journal between 1980 and 2014. This assessment includes the general view of authorship, authorship patterns, author productivity, ranking of authors, visualization of the co-authorship network, comparison of strategic management co-authorship network attributes with those of other disciplines, the evolution of main components and core authors in the networks by period, discussions on whether the strategic management network fits with the small world network theory, individual network attributes such as degree centrality, Bonacich's power index, closeness centrality, and betweenness centrality. Finally, the authors provide an inclusive evaluation of the results, limitations, and suggestions for future research.
The main purpose of this study is to explore and visualize the evolution of collaboration among researchers in the academic discipline of strategic management (SM). The authors vet the dynamics of SM authorship networks from articles published in Strategic Management Journal (SMJ) via bibliometrics analysis – a co-authorship analysis.
Collaboration has increased among researchers in studies, herein scientific research, (Cronin et al., 2003, 2004); hence, collaboration is sought by researchers to explain its meaning, boundary, costs, benefits, and measurement attributes (Katz and Martin, 1997; Laudel, 2002; Sonnenwald, 2007). On the other hand, this collaboration in various disciplines established research communities that constitute social networks. Since social networks positively help researchers to create or share knowledge (Borgman and Furner, 2002; Lin, 2001), they are used to identify the knowledge domain of disciplines. To explore the collaboration roots of disciplines, social network analysis is examined by using co-occurrence analysis referred to as bibliometrics analysis, including author co-citation, co-authorship (employed herein), and co-word analysis (Leydesdorff and Vaughan, 2006; Otte and Rousseau, 2002; Owen-Smith et al., 2002). In recent years, a number of studies have been conducted to reveal the evolution of collaboration and networks and to identify key actors as either individuals or groups and to demonstrate the relationships among these actors, or relationships between indicators of these networks and actors’ outputs (see Fatt et al., 2010; Lu et al., 2010; Perianes-Rodríhuez et al., 2010; Said et al., 2008). Therefore, the interest in management and organization literature (Ferreira et al., 2014; Zupic and Čater, 2015) has increased.
The evolution based on epistemology and the knowledge domain or collaboration roots of SM as a young academic discipline has been assessed in a number of studies via qualitative (review, or content analysis) and quantitative (bibliometric) methods. Qualitative research methods have examined the evolution of SM focus on macro and micro foundations of the field (Guerras-Martín et al., 2014; Molina-Azorín, 2014), epistemology of SM (Antonio, 2013; Powell, 2001; Boyd et al., 2012), definitions of SM or strategy (Fréry, 2006; Nag et al., 2007) and methodologies and statistical techniques employed in SM research (Armstrong and Shimizu, 2007; Bergh and Fairbank, 2002; Boyd et al., 2005b, Boyd et al., 2005c; Brahma, 2009; Hahn and Doh, 2006; Hotker, 2006; Ketchen et al., 2008; Short et al., 2002).
Several quantitative studies have explored the intellectual and/or collaboration roots of SM by utilizing bibliometric methods. For example, co-citation analyses (see Nerur et al., 2015; Tan and Ding, 2015; Ramos-Rodriguez and Ruiz-Navarro, 2004; Nerur et al., 2008, Pilkington and Lawton, 2014; Di Stefano et al., 2010; Acedo et al., 2006b), bibliographic coupling analysis (Vogel and Güttel, 2013), multiple correspondence analysis (Furrer et al., 2008), co-authorship analysis (Ronda-Pupo and Guerras-Martín, 2010), and co-word analysis (Ronda-Pupo and Guerras-Martín, 2012) have been applied to identify changes in the intellectual structure of SM. Although there is an abundance of articles assessing the historical roots and evolution of SM (Kenworthy and Verbeke, 2015), the evolution of collaboration, particularly authorship and co-authorship, in the SM realm has not been previously addressed. Therefore, research focusing on the evolution of collaborations in the SM is needed. In this respect, for new and established researchers (Fernandez-Alles and Ramos-Rodríguez, 2009), the research objectives of this study are:
- •
to explore the evolution of authorship in the SM field by sub-periods.
- •
to visualize and identify the topologies of the overall co-authorship network of SM research to determine whether the networks in the SM field reflect the characteristics of a “small world” approach -reflecting the characteristics of social networks (Watts and Strogatz, 1998).
- •
to compare attributes of SM networks with those of other disciplines.
- •
to identify critical researchers in the co-authorship network of SM research.
The study is structured as follows. The first section is a review of the literature on bibliometrics and co-authorship, and an overview of bibliometric research in SM. The second section presents the methodology to explain how the database, document types, and journal were selected, and how the data were prepared and analyzed. In the third section, the authors present and discuss the results, focusing on the authorship patterns, author productivity, and ranking of authors, followed by a presentation of co-authorship by periods, a discussion of main component and core authors by periods, and an assessment of whether SM fits with a small-world network approach. Centrality metrics, including degree centrality, Bonacich's power index, closeness centrality, and betweenness centrality are evaluated. Finally, an inclusive evaluation of the results, limitations, and suggestions for future research is presented.
Literature reviewBibliometrics and co-authorshipBibliometrics is a set of statistical methods to investigate the evolution of the sciences and/or disciplines by assessing the publication performance of authors and institutions and by mapping the structure and dynamics of the fields via data (e.g. citations, author names, key words, employed methods, used statistical techniques, etc.) obtained from written publications including books, journals, proceedings, articles, etc. (Cobo et al., 2011; McBurney and Novak, 2002; Ye et al., 2012; Zupic and Čater, 2015). Hence, it helps researchers minimize potential subjective biases, validate expert inferences, highlight leading thoughts and the interrelated connections between them (Nerur et al., 2008), correct errors of perception on history of various sciences, and scrutinize traditional dogmas (Callon et al., 1993) when they analyze the evolution of sciences.
Bibliometrics methods are categorized into two groups (Benckendorff and Zehrer, 2013). One group is called evaluative techniques and includes productivity measures (e.g. number of papers per academic year, number of papers per author), impact metrics (e.g. the total number of citations, number of citations per given period, number of citations per author), and hybrid metrics that both productivity and impact measures (e.g. the impact of collaboration in citations) (Benckendorff and Zehrer, 2013; Benckendorff, 2009; Hall, 2011). In the current study, several evaluative techniques (productivity measures), including number of author appearances, authors, papers per author, articles per author, multi authored articles, authors of multi-authored articles, a collaboration index, authorship pattern, Lotka's Law to measure author productivity, and dominance factor to rank authors, were used by providing details about their meanings and representations in the methodology section.
The other category of bibliometric methods is called relational techniques (Benckendorff and Zehrer, 2013) including co-citation, co-authorship (employed herein), co-word, and bibliographical coupling analysis, which are used to answer the following questions: (i) what is the intellectual structure of a discipline and how does it evolve based on co-citations and bibliographical coupling? (ii) What is the social structure of the discipline and how is it based on co-authorship considering the authors affiliations? (iii) What are the conceptual structures of the discipline based on co-word analysis (Zupic and Čater, 2015)?
Co-authorship occurs when two authors co-publish a study (Lu and Wolfram, 2012). It is “…one of the most tangible and well documented forms of scientific collaboration. Almost every aspect of scientific collaboration networks can be reliably tracked by analyzing co-authorship networks by bibliometric methods” (Glanzel and Schubert, 2004: 257). These collaboration (co-authorship) networks illustrate research teams, factors influencing the co-authorship, impact or output of collaborations, and social structure of the field by conducting social network analysis (SNA) (Zupic and Čater, 2015).
SNA-incorporating methods utilized at a macro level (focusing on the typology features of the overall networks) or micro level (seeking the position and impact of individual researchers) (Ye et al., 2013) are not new for readers of business and management. Although there are a number of studies assessing intellectual structures of management and organization by conducting SNA for co-citation data, there is a paucity of research utilizing SNA via co-authorship data to elucidate social (collaboration) structures of management and organization (see Zupic and Čater, 2015). For example, Acedo et al. (2006a) visualized a network of co-authorship at the macro level for all management and organizational studies published in leading management journals, including the Academy of Management Journal, the Academy of Management Review, the Administrative Science Quarterly, the Journal of Management, Management Science, Organization Science, and the Strategic Management Journal. In addition, while Hu and Racherla (2008) studied the combination of co-authorship networks and research themes in the hospitality literature, Ye et al. (2013) analyzed co-authorship networks of the tourism and hospitality literature, including its leading tourism management journals and three leading hospitality management journals at both macro and micro levels. Therefore, more research addressing the structure of co-authorship networks at both the macro and micro levels and the sub-fields such as human resource management, strategic management, and organizational behavior is needed to gain deeper understanding for issues related to the co-authorship mentioned above.
Bibliometrics research in strategic managementSeveral extant papers investigated the evolution of the SM field by using bibliometric methods that can be categorized in the four groups. The first group used citation and/or co-citations analysis by focusing on the intellectual structure of strategic management. Ramos-Rodrigues and Ruiz-Navarro's (2004) identified changes in the intellectual structure of SM in the articles published in the SMJ between 1980 and 2000. To complement this study, Nerur et al. (2008) investigated the intellectual structure of the SM field by focusing on an author co-citation analysis based on the scientific output of the SMJ between 1980 and 2000. In addition to this research focusing on the knowledge domain of SM, scholars sought the intellectual structure of sub-fields of SM, such as resource-based theory (Acedo et al., 2006b) and dynamic capabilities (Di Stefano et al., 2010). Pilkington and Lawton (2014) presented transnational insights into epistemological and methodological approaches to SM research in English-speaking countries. Last, Nerur et al. (2015) illuminated the knowledge flows to and from the SMJ between 1980 and 2009. They found that the SMJ has a significant role in diffusing and storing knowledge, the practitioner orientation has been declining, and there are significant relationships between finance and sociology and between international business and entrepreneurship.
The second group of papers utilized co-word analysis to highlight the dynamics of the conceptual structure of SM. Furrer et al. (2008) outlined the evolution of SM by using keywords in articles related to SM published in the Academy of Management Journal, the Academy of Management Review, the Administrative Science Quarterly and the Strategic Management Journal between 1980 and 2005. Ronda-Pupo and Guerras-Martín (2012) investigated the evolution of strategy definitions obtained from journals and books published between 1962 and 2008. Tan and Ding (2015) demonstrated the frontier and evolution of the strategic management theory from articles published between 2001 and 2012 in SMJ by employing both co-word and co-citations analysis. They identified several key research streams, including the knowledge-based view, network organization research, and dynamic capabilities.
The third group of papers utilized bibliographic coupling analysis. This method has been employed once to demonstrate the intellectual structure of dynamic capabilities as sub-topic of SM from articles published in the extant literature between 1994 and 2011 by Vogel and Güttel (2013). They found that the core cluster of the current dynamic capability view focused on learning and change capabilities and related them to firm performance.
The last group of papers was conducted via co-authorship analysis. The evolution of authorship and co-authorship specifically in the SM field in the SMJ has not been studied. However, Furrer et al. (2008) identified authors contributing to SM field in leading management journals. Concerning co-author analysis, Ronda-Pupo and Guerras-Martín's (2010) used network analysis to describe the evolution of the participant countries’ position in the articles published in SMJ between 1980 and 2009. They found that the network structure of the SM scientific community inferred an evolution in three stages: formation/incorporation, consolidation/dissemination, and expansion/transformation.
Consequently, as they recommended as well, to understand the evolution of research community and knowledge domain of SM, more research focusing on co-authorship network both macro and micro levels is needed. Therefore, the main purpose of the current study is to elucidate the evolution of author collaboration and co-authorship network in the SM field by using evaluative and relational (co-authorship) bibliometrics methods, providing details on their meanings and representations in the methodology section.
MethodologyDatabase, document type and journal selectionThese researchers followed three steps in the creation of the sample: database selection, document type selection, and journal selection. Due to its reputation and significance in the academic world, the Social Science Citation Index (SSCI) database was selected to achieve the main goals of the study. Documents such as books, congress proceedings, theses, journals, articles, etc., are sources of bibliometric methods as a sample. To increase the validity and reliability of the bibliometric studies, the sample should include documents providing “certified knowledge” generated by scientific journals that apply a critical review process (Callon et al., 1993; Ramos-Rodriguez and Ruiz-Navarro, 2004). Therefore, scientific journals publishing articles related to SM were considered as the sample of the study.
There is an abundance of journals focusing on SM in the academic publishing industry. Some of these journals address only SM topics.1 Hence, there are several important reasons why the SMJ was selected for this study. First, SMJ is the top strategic management-focused journal indexed by the Social Science Citation Index (SSCI) database and is well known by scholars due to its reputation and significance around the academic world. Based on this index (Journal of Citation Reports), SMJ has been on a growth trajectory since its first issue was released in 1980. In addition, according to information given by the SMJ web page (http://smj.strategicmanagement.net/, 10.08.2015), SMJ is a highly cited journal. For example, in 2014, according to the ISI Journal Citation Reports (JCR), scholars in academic journals cited SMJ articles 18,882 times – #5/185 journals in the “Management” list and #3/115 in the “Business” list. It is also a high broad-based ranking journal. For example, in 2014, across six key JCR scales (total citations; 2-year impact factor; 5-year impact factor, immediacy index; Eigenfactor score; article influence score), SMJ had a median ranking of number 6 out of 185 in the “Management” list and number 5 out of 115 in the “Business” list. It was listed as a “4” journal (i.e., “world elite journal”) in 2015 by the Association of Business Schools (UK), and global reach. For example, during 2014, more than 3000 different scholars based in 67 countries submitted articles to the SMJ; in the prior five years, more than 6400 unique scholars submitted from 100 countries. Second, SMJ represents the Strategic Management Society that, “is unique in bringing together the worlds of reflective practice and thoughtful scholarship” and has “nearly 3000 members representing a kaleidoscope of backgrounds and perspectives from more than 80 different countries” (Strategic Management Society, 2.8.2015).
Finally, SM is an ambiguous and highly contestable field (Nag et al., 2007: 936). Therefore, all articles selected were published in only SMJ to avoid making subjective decisions whether or not an article published in other journals (e.g., Academy of Management Journal, Academy of Management Review, Administrative Science Quarterly, Journal of Management, Management Science, Organization Science, etc.) is related to strategy or SM (Nerur et al., 2015) and the arduous task of finding such articles from other journals (Ramos-Rodriguez and Ruiz-Navarro, 2004). This choice may be questionable from a generalizability perspective. However, since subjectivity came out in the related article selection process from other journals, the reliability and validity of the findings may decrease. Therefore, the sample including SMJ articles is “a representative sample of SM research” as emphasized by Nerur et al. (2015) and Ramos-Rodrigues and Ruiz-Navarro (2004: 983).
Consequently, the sample of this study consisted of all articles (articles and research notes/communications/commentaries) published in SMJ from volume 1, issue 1 in 1980 to volume 35, issue 13 in 2014. As a result, 2092 articles were selected from SMJ between those years.
Data collectionTo frame the sample of the study, all the articles (articles and research notes/communications/commentaries) published in SMJ between 1980 and 2014 were obtained. The names of authors from these articles were inserted into a spreadsheet manually to eliminate and/or minimize possible spelling errors in the SSCI databases, and papers were sorted by number of authors. Authors from each article were identified and cataloged. Additionally, to avoid author-name disambiguation, the data were checked and cleaned manually by considering combinations of authors’ names represented with initials or different name variations that identified two different authors with the same name using initials (Kumar and Jan, 2013).
AnalysisThe first step presented information on the descriptive analysis of the authorship in the SMJ by years. The second step demonstrated a co-authorship analysis. Authors who contributed to the articles were counted to produce the characteristics of co-authorship. The BibExcel program was used to gather data for the co-authorship analysis. The authorship and co-authorship analysis via network visualizations and analyses were performed using Pajek and Ucinet 6, network analyses software packages. Co-authorship was analyzed to show changes that have occurred in the literature from 1980 to 2014. This period was divided into five equal and consecutive 7-year subperiods (1980–1986, 1987–1993, 1994–2000, 2001–2007, and 2008–2014) to illustrate more fully significant changes and trends in authorship analysis.
Results and discussionGeneral view of authorship data in SMJTable 1 Authorship Data: General View, provides information on the frequency of issues and articles published in the SMJ, author appearances, authors, papers per author, articles per author, multi-authored articles, authors of multi-authored articles, and a collaboration index by sub-periods. A total of 2092 articles were obtained from the SMJ between 1980 and 2014, and the number of articles increased in each period. Comparing the number of the first (1980–1986) and second periods (1987–1993), the number of author appearances, authors, multi-authored articles, and authors of multi-authored articles more than doubled. In addition, the number of these indicators steadily increased in subsequent periods. While the number of authors per article increased, the number of articles per author decreased in given periods. These two indicators are generally similar with the indicators of organization behavior and human resource management (Talukdar, 2015); however, they are less than other disciplines such as computer science and biomedicine (Newman, 2001). This is a sign that SMJ is relatively young discipline, like organization behavior and human resource management (Talukdar, 2015). A collaboration index (CI) referred to as Total Authors of Multi-Authored Articles/Total Multi-Authored Articles (Elango and Rajendran, 2012) demonstrated a growth of collaboration among authors, although the index decreased from the first period to the second. The CI ranged from 1.65 to 1.91, suggesting that the research team was generally built by two authors in the field. Additionally, as seen Fig. 1 the collaboration rate among SM authors, by years, produced an upward trend over the past 35 years, plus, in recent years, single-authored papers significantly declined. This conclusion is consistent with those of other studies, including Fischbach et al. (2011), Elango and Rajendran (2012), Kumar and Jan (2013), Braun et al. (2001), Cronin et al. (2003), Ardanuy (2012), Kundra (1996), and Moody (2004).
Authorship data: general view.
| Period | 1980–1986 | 1987–1993 | 1994–2000 | 2001–2007 | 2008–2014 | 1980–2014 |
|---|---|---|---|---|---|---|
| # Issues | 30 | 57 | 78 | 90 | 91 | 346 |
| # Articles | 195 | 380 | 447 | 487 | 583 | 2092 |
| # Author appearances | 300 | 674 | 894 | 1026 | 1361 | 4255 |
| # Author | 231 | 465 | 651 | 740 | 997 | 2364 |
| Articles per author | 0.84 | 0.82 | 0.69 | 0.66 | 0.58 | 0.88 |
| Authors per article | 1.18 | 1.22 | 1.46 | 1.52 | 1.71 | 1.13 |
| #Multi authored articles | 90 | 225 | 318 | 367 | 494 | 1494 |
| #Authors of multi authored articles | 161 | 371 | 581 | 680 | 945 | 2145 |
| Collaboration index | 1.79 | 1.65 | 1.83 | 1.85 | 1.91 | 1.44 |

The SMJ authorship pattern between 1980 and 2014 is presented in Table 2. In the first period, the number of articles contributed by a single author was greater than the number of multi-authored articles. However, in the second period, there was a significant increase in multi-authored papers. After the first period, the highest number of multi-authored articles included two authors, followed by three, four, and five authors. Two articles, one in 2008–2014 and one in 1994–2000, were written by six authors and seven authors, respectively. As observed from other studies conducted in different disciplines (see Amsaveni et al., 2013; Arya, 2012; Elango and Rajendran, 2012; Zafrunnisha and Pullareddy, 2009; Maheswaran et al., 2008; Weeks et al., 2004; Bandyopadhyay, 2001; Kalyane and Sen, 1995; Rana Madan and Agarwal, 1994), multi-authored articled dominated single-authored articles, a phenomenon that increased each period. These results elucidate that team research is a significant aspect in scientific development. However, some questions should be addressed to understand the nature of these research teams. For example, why are these research teams created, how do research teams form (e.g., departmental, national, or international level), how do research teams influence scientific progress (i.e., theoretical or empirical), what is the relationship among research teams, and how does the relationship evolve?
Authorship pattern.
| Period | 1980–1986 | 1987–1993 | 1994–2000 | 2001–2007 | 2008–2014 | 1980–2014 |
|---|---|---|---|---|---|---|
| #Articles | 195 | 380 | 447 | 486 | 584 | 2092 |
| Single | 105 | 155 | 129 | 119 | 90 | 598 |
| Double | 75 | 167 | 213 | 231 | 260 | 946 |
| Triple | 15 | 49 | 86 | 102 | 190 | 442 |
| Quadruple | – | 8 | 16 | 31 | 39 | 94 |
| Quintuple | – | 1 | 2 | 3 | 4 | 10 |
| Sextuple | – | – | – | – | 1 | 1 |
| Septuble | – | – | 1 | – | – | 1 |
Lotka's Law provides insight into the SMJ author productivity. According to Lotka's Law, when “…a handful of researchers are responsible for most of the literature…the contribution of the large majority of researchers is very low in terms of number of publications” (Barrios et al., 2008, p. 458). Therefore, based on this law, only 6% of authors in a discipline will produce more than 10 journal articles (Potter, 1988). In this respect, Lotka software developed by Rousseau and Rousseau (2000) (see http://www.cindoc.csic.es/cybermetrics/articles/v4i1p4.html) was utilized. The calculated β value from the software must be between 1.27 and 3.29 to confirm Lotka's Law (Kumar and Jan, 2013). In Table 3, Author Productivity, typing the numbers from the Papers row as Production and from the Authors row as Sources, the estimated β values for each period, 2.93, 2.66, 2.77, 2.76, 2.81, respectively and for the overall period, 2.34, which confirmed a fit with Lotka's Law. These findings identify that a handful of scholars was responsible for most SMJ papers as seen in other disciplines (Wallace, 2012; Barrios et al., 2008; Elango and Rajendran, 2012; Nath and Jackson, 1991; Chung and Cox, 1990). The productivity of authors who have articles in the SMJ is generally similar to other leading business and management journals, including those in organization behavior and human resource management (Talukdar, 2015), business ethics (Talukdar, 2011), finance (Chung and Cox, 1990), accounting (Chung et al., 1992), and economics (Cox and Chung, 1991). The findings demonstrate that ‘success breeds success’ or the ‘cumulative advantage’ in publication process is relatively stronger in leading business and management journals as seen in Talukdar's (2015) study. Additionally, according to the results of the analysis one might discuss SMJ has “an implicit high ‘entry barrier’ to scholarly publications in the discipline that can stimulate legitimate discussion about its doctoral student trainings, journals’ editorial board compositions, and peer review processes” (Talukdar, 2015, pp. 480).
Author productivity.
| # Articles | 1980–1986 | 1987–1993 | 1994–2000 | 2001–2007 | 2008–2014 | 1980–2014 |
|---|---|---|---|---|---|---|
| 1 | 182 | 344 | 497 | 562 | 777 | 1603 |
| 2 | 36 | 76 | 100 | 117 | 135 | 359 |
| 3 | 8 | 23 | 34 | 37 | 48 | 171 |
| 4 | 3 | 9 | 12 | 13 | 22 | 83 |
| 5 | 2 | 8 | 6 | 4 | 10 | 47 |
| 6 | – | 2 | 1 | 2 | 4 | 32 |
| 7 | – | 3 | – | 5 | – | 22 |
| 8 | – | – | – | – | 1 | 15 |
| 9 | – | – | – | – | – | 11 |
| 10 | – | – | – | – | – | 3 |
| 11 | – | – | 1 | – | – | 3 |
| 12 | – | – | – | – | – | 3 |
| 13 | – | – | – | – | 3 | |
| 14 | – | – | – | – | – | 3 |
| 15 | – | – | – | – | – | 1 |
| 16 | – | – | – | – | – | 2 |
| 18 | – | – | – | – | – | 1 |
| 22 | – | – | – | – | – | 2 |
| Lotka's Law (β) | 2.93 | 2.66 | 2.77 | 2.76 | 2.81 | 2.34 |
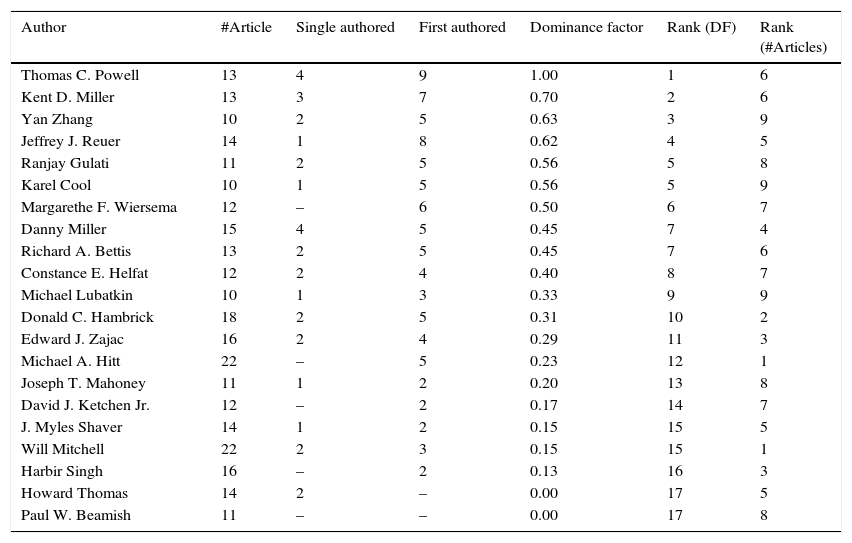
As outlined Table 4 authors were ranked via the Dominance Factor (DF); DF=[the number of multi-authored articles of an author as first author (Nmf)/total number of multi-authored articles (Nmt)] formulated by Kumar and Kumar (2008). The value of dominance factor gives signals for collaboration in the field. A value less than 0.5, reflects a good sign for collaboration (Kumar and Kumar, 2008). Authors having 10 or more articles between 1980 and 2014 were filtered from the database by author and their DFs were estimated based on the formula (see Table 4). Thomas C. Powell topped the rank with 1.00 DF, followed by Kent D. Miller (0.70), Yan Zhang (0.63), Jeffrey J. Reuer (0.62), Ranjay Gulati (0.56), Karel Cool (0.56), and Margarethe F. Wiersema (0.5). Two out of 21 authors had a zero DF and the remaining authors had a DF value less than 0.5. Although Michael A. Hitt and Will Mitchell were top authors with 22 articles, they ranked the twelfth and fifteenth respectively based on DF. There is a good sign for collaboration in the SM field since the value of DF of the most prolific authors was found less than 0.5.
Ranking of authors (1980–2014).
| Author | #Article | Single authored | First authored | Dominance factor | Rank (DF) | Rank (#Articles) |
|---|---|---|---|---|---|---|
| Thomas C. Powell | 13 | 4 | 9 | 1.00 | 1 | 6 |
| Kent D. Miller | 13 | 3 | 7 | 0.70 | 2 | 6 |
| Yan Zhang | 10 | 2 | 5 | 0.63 | 3 | 9 |
| Jeffrey J. Reuer | 14 | 1 | 8 | 0.62 | 4 | 5 |
| Ranjay Gulati | 11 | 2 | 5 | 0.56 | 5 | 8 |
| Karel Cool | 10 | 1 | 5 | 0.56 | 5 | 9 |
| Margarethe F. Wiersema | 12 | – | 6 | 0.50 | 6 | 7 |
| Danny Miller | 15 | 4 | 5 | 0.45 | 7 | 4 |
| Richard A. Bettis | 13 | 2 | 5 | 0.45 | 7 | 6 |
| Constance E. Helfat | 12 | 2 | 4 | 0.40 | 8 | 7 |
| Michael Lubatkin | 10 | 1 | 3 | 0.33 | 9 | 9 |
| Donald C. Hambrick | 18 | 2 | 5 | 0.31 | 10 | 2 |
| Edward J. Zajac | 16 | 2 | 4 | 0.29 | 11 | 3 |
| Michael A. Hitt | 22 | – | 5 | 0.23 | 12 | 1 |
| Joseph T. Mahoney | 11 | 1 | 2 | 0.20 | 13 | 8 |
| David J. Ketchen Jr. | 12 | – | 2 | 0.17 | 14 | 7 |
| J. Myles Shaver | 14 | 1 | 2 | 0.15 | 15 | 5 |
| Will Mitchell | 22 | 2 | 3 | 0.15 | 15 | 1 |
| Harbir Singh | 16 | – | 2 | 0.13 | 16 | 3 |
| Howard Thomas | 14 | 2 | – | 0.00 | 17 | 5 |
| Paul W. Beamish | 11 | – | – | 0.00 | 17 | 8 |
Table 5 demonstrates the most important indicators of networks of five periods, paving the way for comparison among periods. Collaboration rates referring to cooperation among authors consistently increased over the 35-year period. The density rate, delineating the relationship between the number of real links against all the possible linkages in the network and showing connection level among authors (Acedo et al., 2006a), was 0.004 in 1980–1986, followed by 0.003, 0.002, 0.003, and 0.003 in subsequent periods, respectively. There was a significant decrease from the first period through the last period, indicating that the co-authorship network was steadily losing strength. In other words, this evolution of density rate shows that the disconnection level of networks in each period was high and these disconnections were increasing based on a clustering co-efficient value. Circular visualizations of networks are provided for each period in Fig. 2 and attest to this trend by showing the increase with the nodes representing the authors and the edges representing a co-authorship. While the size of nodes presents their relative frequency in a network structure, the width of links illustrates the strength of the relationship between each pair. Hence, the density values of networks were changing significantly over periods, demonstrating that the authors in the five periods were not well connected in the each period. Additionally, the co-authorship network of all periods (1980–2014), accounting for 0.003 density, did not have strength connection as observed in the density of whole network of management and organization network in Acedo el al.’s (2006a) study.
Summary of topology feature of co-authorship network by periods.
| 1980–1986 | 1987–1993 | 1994–2000 | 2001–2007 | 2008–2014 | 1980–2014 | |
|---|---|---|---|---|---|---|
| Collaboration rate | 0.46 | 0.59 | 0.71 | 0.75 | 0.84 | 0.65 |
| Density | 0.004 | 0.003 | 0.002 | 0.002 | 0.003 | 0.002 |
| Clustering coefficient | 0.32 | 0.29 | 0.28 | 0.26 | 0.25 | 013 |
| Mean distance | 1.13 | 1.62 | 1.33 | 1.41 | 1.85 | 5.05 |
| Main component Size | 4 | 42 | 20 | 17 | 81 | 296 |
| Main component % | 2.5 | 11.3 | 5.0 | 4.2 | 20.5 | 69.0 |

The mean distance illuminates the collaboration maturity level in the network by distance among authors. A shorter distance means there is a higher level of maturity in the collaboration networks (Ye et al., 2013). The main component size and main component percentages show an extensive and intimate collaboration network in the field (Ye et al., 2013: 63) and usually includes the most productive authors (Kretschmer, 2004). As seen in Table 5, mean distance, main component size, and main component percentages reflected the same trend, indicating that the values increased significantly. The mean distance was 1.13 in the first period, reflecting that the information flow between any pair of authors needed to pass through an average of only 1.13 individuals.
Clustering coefficients, depicting the closeness of community members and indicating networks’ trend toward small groups or clusters (Acedo et al., 2006a), fluctuated between 0.32 and 0.27. This closeness decreased from the first to the fifth period. These indicate that SM was a very close scientific community in first two periods.
As a result, mean distance, main component size, and main component percentages have increased markedly and clustering coefficient has decreased since 1994, except for the clustering coefficient value in fourth period. This illustrates that the community expanded significantly, although most of the new members remained as peripheral authors, mirroring similar findings reported in Ye, Li and Law's study (2013) conducted in tourism and hospitality field.
Evolution of main component network and core authors in the networkFig. 3 presents the evolution of main component networks. In the first period, there were five members; in the second, 43; in the third, 20; in the fourth, 32; and in the last, 108, for a total of 321. These numbers for each period accounted for 3.1%, 11.5%, 3.4%, 7.9%, 14.7, and 71.7% of the total, respectively. The member sizes surged significantly among periods and, in the last period, a remarkable increase occurred. Collaboration has increased and plays a crucial role in being productive.

In addition to main component network, social network analysis programs generate core and periphery authors in networks to gain a deeper understanding of the evolution and development of network and topics studied by core authors. Table 6 shows core authors from each period. There were 3 authors in first period (1980–1986) with 2 articles, followed by 22 authors with 38 articles in second period, 4 authors with 13 articles in third period, 20 authors with 30 articles in fourth period, and 6 authors with 8 articles in last period. When the entire period (1980–2014) was assessed, 167 articles authored by 21 authors were found. Michael A. Hitt appeared in three periods and all period (1980–2014). On the other hand, although a number of authors appeared in multiple periods, many of them did not appear in all periods (1980–2014), or vice versa. This is a sign indicating a low level of the maturity of the discipline.
Core authors by periods.
| 1980–1986 | 1987–1993 | 1994–2000 | 2001–2007 | 2008–2014 | 1980–2014 |
|---|---|---|---|---|---|
| Shawki Al-Bazzaz Masoud Yasai-Ardekani Peter H. Grinyer | Robert E. Hoskisson, Michael A. Hitt Charles W. L. Hill W. Chan Kim Willem P. Burgers Peter Hwang Richard A. Johnson John A. Pearce II Richard B. Robinson Jr. Birger Wernerfelt Peter S. Davis Seung Ho Park Michael Lubatkin Sayan Chatterjee Michael N. O’malley Mary Ann Glynn Thomas F. Reed Douglas D. Moesel Steven Grover D. Keith Robbins Gary S. Hansen Joel Brockner | J. Myles Shaver Bernard Yeung Will Mitchell Kulwant Singh | David J. Ketchen Jr. G. Tomas M. Hult Brian K. Boyd Steve Gove Shige Makino Takehiko Isobe Stanley F. Slater Eric M. Olson Christopher L. Shook Michael A. Hitt R. Duane Ireland Donald L. Sexton Michael Camp Paul W. Beamish S. Trevis Certo Catherine M. Daily Dan R. Dalton Jeffrey G. Covin Christine Oliver Mathias Arrfelt | David G. Sirmon Michael A. Hitt Leonard Bierman Christopher S. Tuggle Jean-Luc Arregle Joanna Tochman Campbell | Catherine M. Daily Dan R. Dalton Will Mitchell J. Myles Shaver S. Trevis Certo Michael A. Hitt R. Duane Ireland Robert E. Hoskisson Richard A. Johnson Harbir Singh Paul W. Beamish Albert A. Cannella Jr. Richard A. Bettis Jeffrey J. Reuer Beverly B. Tyler Jeffrey G. Covin Tony W. Tong Donald C. Hambrick Constance E. Helfat Alan E. Ellstrand Jonathan L. Johnson |
Watts and Strogatz (1998) presented the small world theory that stems from formal social networks and reflects the characteristics of them, having both a short path length between any two vertices (authors) and a large clustering coefficient. These properties have since been verified in many networks, including experimental and social science disciplines (see Björneborn, 2004). Several studies (Ye et al., 2013; Kumar and Jan, 2013; Kronegger et al., 2012; Yan et al., 2010; Yin et al., 2006; Newman, 2000, 2001, 2001a, 2004a, 2004b; Moody, 2004; Perc, 2010; Wagner and Leydesdorff, 2005) demonstrated the small world network structure in disciplines. Consequently, the small world network structure for co-authorship networks means… …network forms where the level of local clustering (one's collaborators are also collaborators with each other) is high and the average number of steps between clusters is small. In these small world networks, internal ties of clusters tend to form and make the clusters of scientists more cohesive clusters. In contrast, ties between clusters are fewer and the network is less cohesive overall. However, paths between actors in different clusters tend to be short (Kronegger et al., 2012, p. 633).
Additionally, according to Barabási and Albert (1999) and Barabási (2009), small world networks have the characteristics of scale free networks following, at least asymptotically, a power law. A power law distribution “(p(x)=cx−α) is characterized by the majority of the network consisting of relatively low degree nodes, with very few high degree nodes” (Ye et al., 2013, 58). In other words it indicates a small number of authors in a field who demonstrate high performance, a broad number of author who demonstrate good performance, and a smaller number of authors who demonstrate low performance. In power law, the power exponent (α) is generally negative and, in collaborative networks, the range of the value of exponent based on degree distribution is between 2 and 3 (Ye et al., 2013; Dorogovtsev et al., 2002).
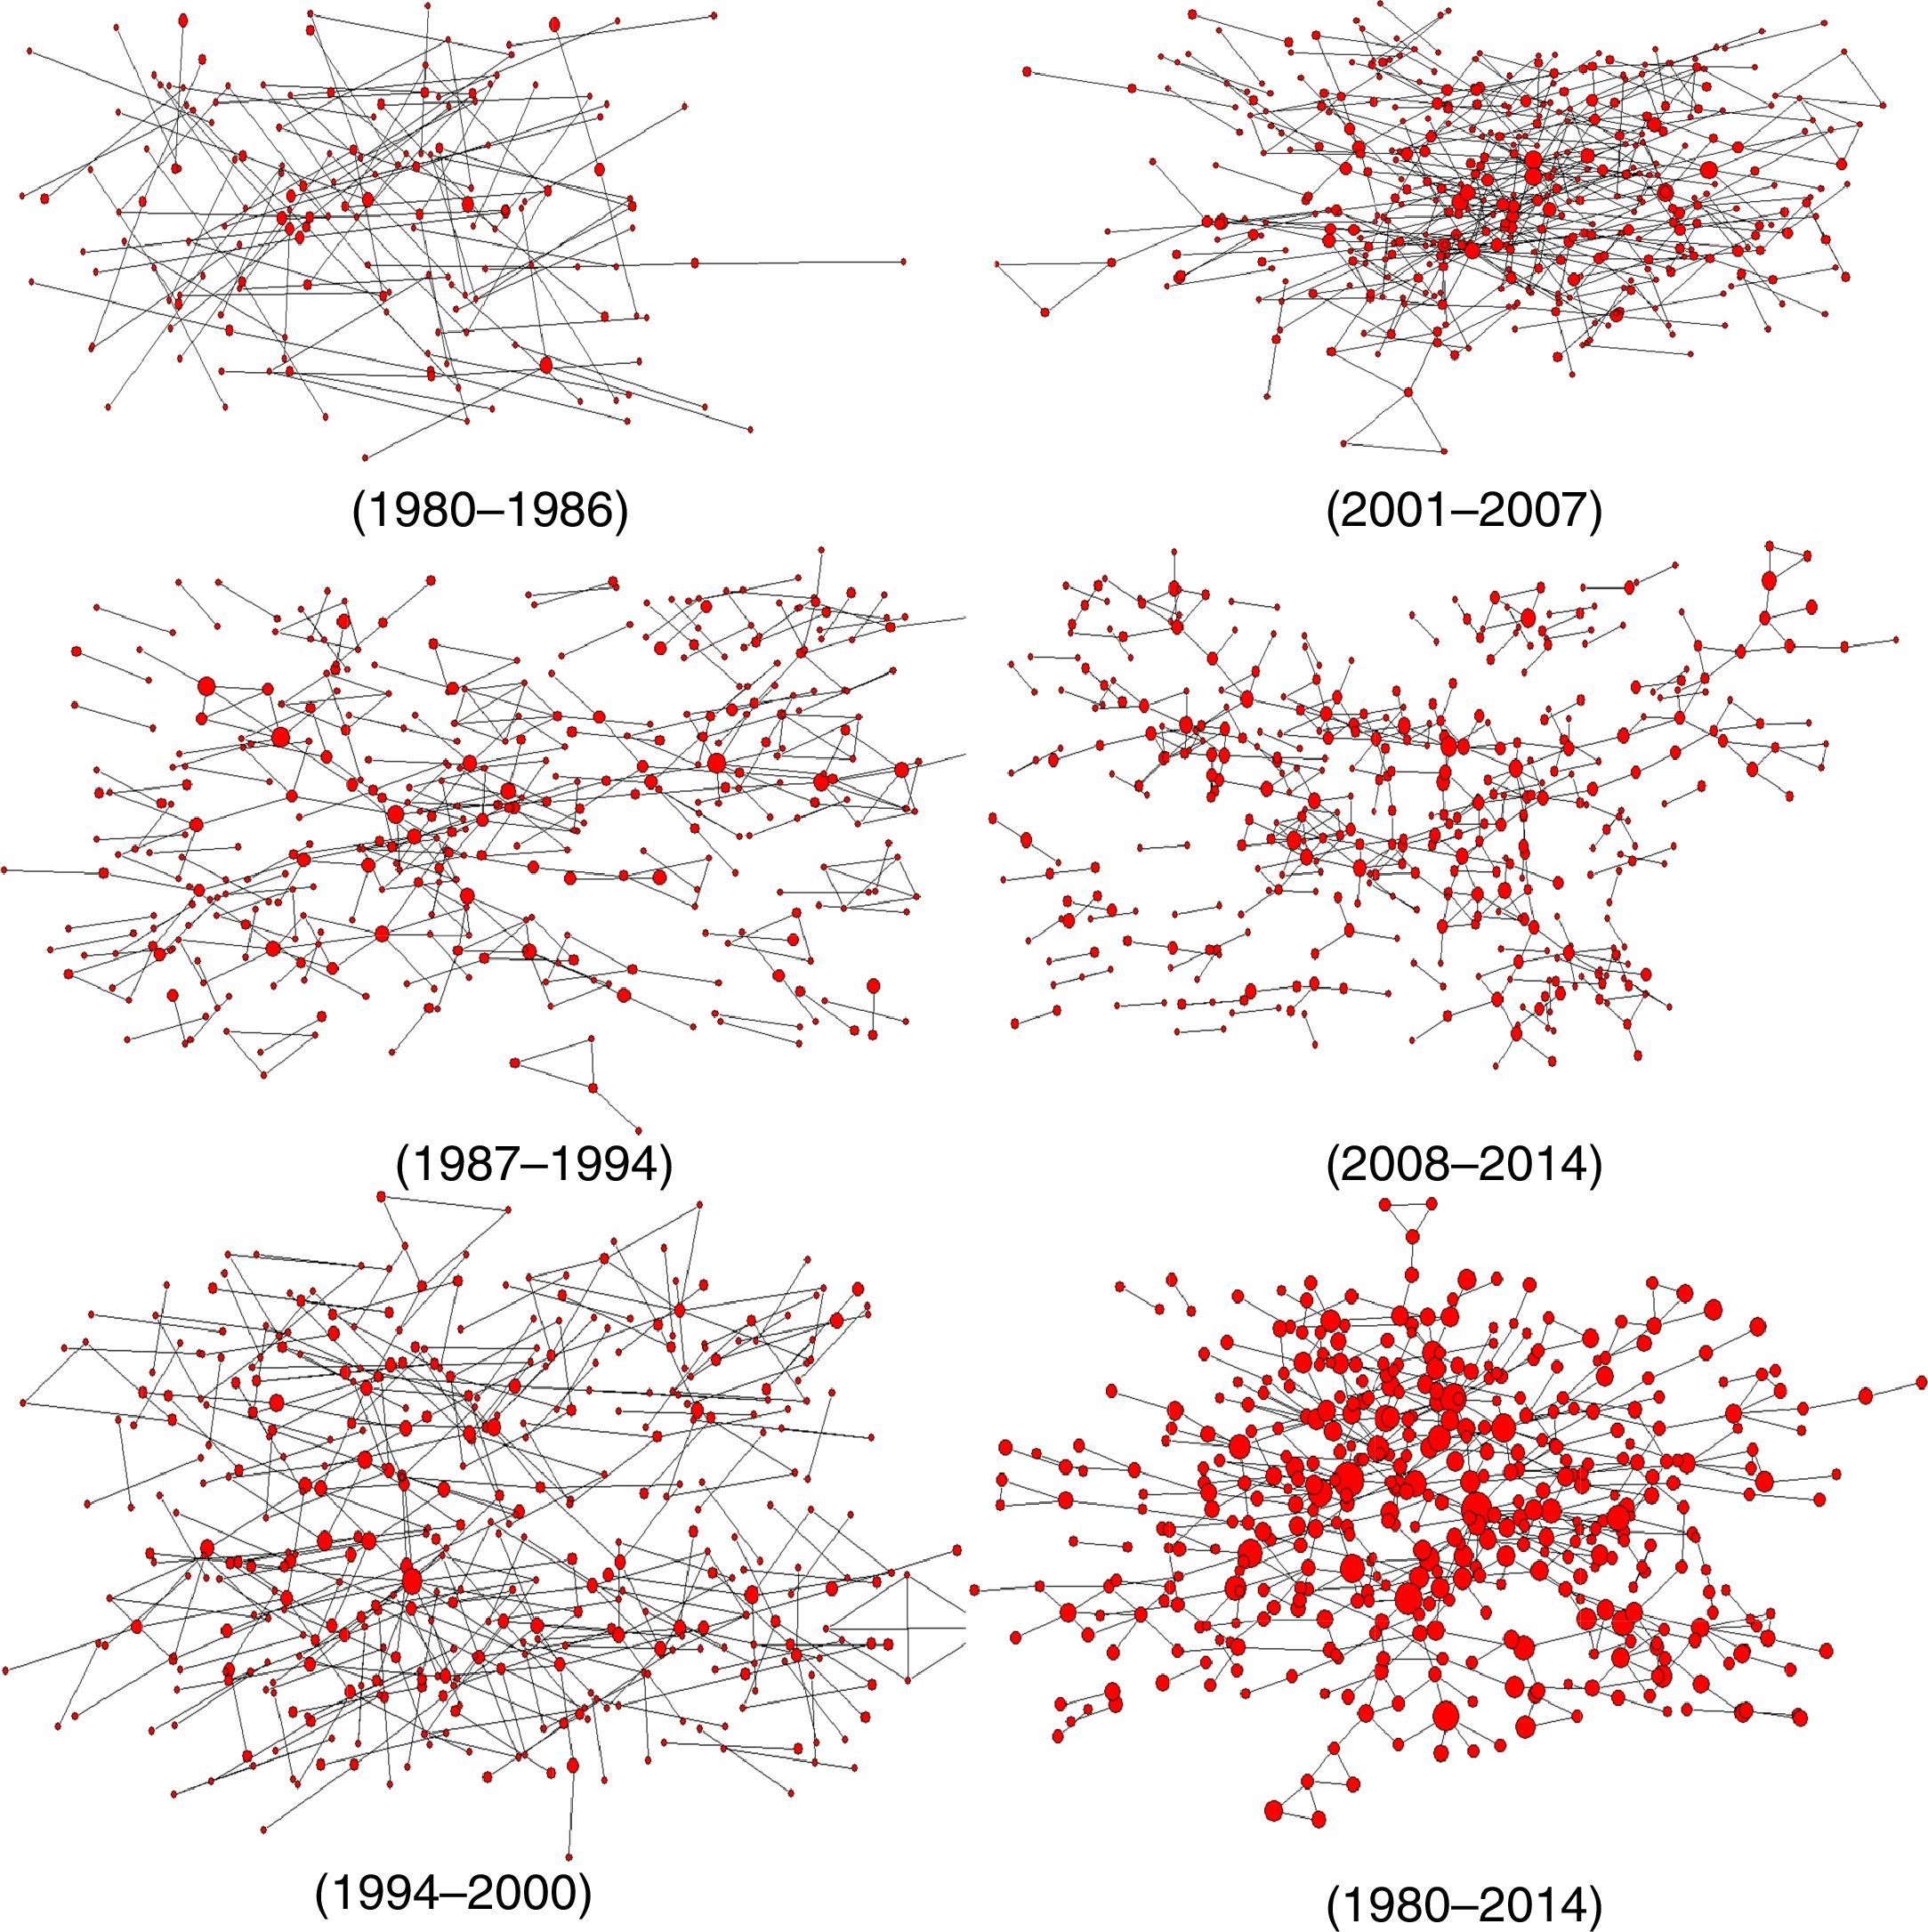
Fig. 4 presents the evolution of scale free networks for each period. These networks were fragmented, scattered, and less connected; hence, they are not small world networks. However, the all period network (1980–2014) had a mean distance of 5.05, indicating that information needs to flows an average distance of six to transfer from one author to another, the path length was not short, and the cluster coefficient was 0.13, reflecting a weakly clustered network and a relationship between SM authors that was not close. This did not exactly reflect the characteristics of a small world network.

On the other side, Fig. 5 shows the degree distribution of the SM network. This distribution followed the power law with a power exponent of 1.38, which is outside of the range, and the constant (c) of 493.33, indicating a good fit (R2=0.8465). These findings show that the SM network does not fit the properties of the small world theory; however, it comes closer to the properties of a small world network.

The interpretation of this finding highlights a few significant points for SM based on the articles published in SMJ between 1980 and 2014. First, small world networks influence the diffusion speed of properties, such as data, energy, signals, contacts, and ideas across the networks (Björneborn, 2004). Hence, the diffusion speed of these properties may be low in SM. This can retard the progress of SM as a scientific field due to its interdisciplinary characteristics and borrowed theories from other disciplines (see Kenworthy and Verbeke, 2015).
Second, small world networks demonstrate boundary-breaking characteristics for the fields (Björneborn, 2004). With this in mind, SM has boundary-delimiting characteristics for its scientific progress. Hence, one might argue that theoretical and/or empirical progress on SM demonstrates exploitation innovation – refinement or extension of existing theories or hypothesis rather than exploration innovation – experimentation with new theories (see Quintana-Garcia and Benavides-Velasco, 2008; Fleming, 2004; Sorenson and Fleming, 2004; Sorenson et al., 2006), as exemplified by Uzzi, Amaral, and Reed-Tsochas (2007: 88): …Transaction cost theory addresses a range of organizational boundary issues but does not attempt to explain organizational or individual creativity, prices, patent rates, scientific impact, Internet robustness, diffusion, learning, job search, or knowledge transfer. In this way, small-world mechanisms stand out as providing an unusually parsimonious set of explanations for many different systems as well as the behavior of the actors embedded within them.
Last, Uzzi et al. (2007) emphasized, that “…small worlds appear to be a universal organizing mechanism for social systems” (p. 88). This demonstrates that SM has not yet attained this level. Consequently, one might argue that, in light of these inferences, the maturity of SM field is not high.
Comparison with other collaboration network attributesTable 7 presents a comparison of the attribute of the current study's network with those of other disciplines, such as management and organization, biomedical, tourism and hospitality, and computer science, to elucidate the structure of SM's collaboration network. Because SM is sub-field of management and organization, a direct comparison is not possible. However, because no published work evaluates the attributes of social network of sub-fields, such as human research management, organizational behavior, organization theory, leadership, business ethics, and family business, this comparison gains at least an insight on the maturity of the discipline.
Comparison of co-authorship data: general view.
| Strategic management (Our study) | Management and organization (Acedo et al., 2006a) | Biomedical (Newman, 2001) | Tourism and hospitality (Ye et al., 2013) | Computer science (Newman, 2001) | |
|---|---|---|---|---|---|
| Papers per author | 0.88 | 2.04 | 6.40 | 1.10 | 2.60 |
| Authors per paper | 1.13 | 1.88 | 3.75 | 1.87 | 2.22 |
| Clustering coefficient | 0.13 | 0.68 | 0.066 | 0.748 | 0.496 |
| Main component size | 296 | 4625 | 1,395,693 | 1376 | 6396 |
| Main component % | 69.0 | 45.40 | 92.6 | 59.30 | 57.2 |
| Mean distance | 5.05 | – | 4.6 | 7.20 | 9.7 |
As seen in Table 7, while attributes, including papers per author, authors per paper, and main component size of the current study, were the lowest among all disciplines, the main component percentage of SM was slightly less than that of biomedicine, and mean distance and clustering coefficient were greater than the attribute of the biomedical network. Based on these findings, SM has an intense interdisciplinary nature in that scholars from other fields often collaborate with SM experts to publish their work in SMJ. Moreover, the level of consolidation reflecting the maturity of disciplines was lower, as depicted in comparisons like tourism and hospitality and computer science against biomedicine. As a result, the structure of the SM network shows that SM is undergoing in a process of maturation and consolidation as Ye et al. (2013) noted for tourism and hospitality management.
Individual network attributesThis section provides information on author rankings based on centrality metrics, including degree centrality, Bonacich's power index, closeness centrality, and betweenness centrality. Table 8 demonstrates the ranking of authors who have a degree centrality of six or more between 1980 and 2014. These were filtered from the database by degree centrality, Bonacich's power index, closeness centrality, and betweenness centrality. In this table, authors appearing in the four metrics are marked in bold; authors appearing in three metrics are marked in italics.
Top authors by degree, Bonacich's power index, closeness centrality, and betweenness.
| Rank | Degree centrality | Bonacich's power index | Closeness centrality | Betweenness centrality | ||||
|---|---|---|---|---|---|---|---|---|
| 1 | Will Mitchell | 17 | Catherine M. Daily | 1060.778 | Michael A. Hitt | 0.1585 | Michael A. Hitt | 0.0121 |
| 2 | Michael A. Hitt | 16 | S. Trevis Certo | 849.039 | Will Mitchell | 0.1543 | Donald C. Hambrick | 0.0083 |
| 3 | Harbir Singh | 13 | Dan R. Dalton | 848.937 | Richard A. Bettis | 0.1537 | Albert A. Cannella Jr. | 0.0061 |
| 4 | Jeffrey J. Reuer | 10 | Jeffrey G. Covin | 647.160 | Constance E. Helfat | 0.1480 | Richard A. Bettis | 0.0053 |
| 5 | Donald C. Hambrick | 10 | Alan E. Ellstrand | 422.804 | Beverly B. Tyler | 0.1435 | Sydney Finkelstein | 0.0049 |
| 6 | Dan R. Dalton | 9 | Jonathan L. Johnson | 422.804 | Peter J. Lane | 0.1425 | Richard A. Johnson | 0.0040 |
| 7 | J. Myles Shaver | 9 | Matthew Semadeni | 290.773 | Jeffrey J. Reuer | 0.1413 | Matthew Semadeni | 0.0038 |
| 8 | Jeffrey G. Covin | 9 | Thomas Keil | 265.508 | J. Myles Shaver | 0.1409 | Michael Lubatkin | 0.0037 |
| 9 | Catherine M. Daily | 8 | Markku Maula | 242.666 | Matthew Semadeni | 0.1409 | Donald D. Bergh | 0.0036 |
| 10 | Michael Lubatkin | 8 | Henri Schildt | 242.666 | Harbir Singh | 0.1396 | Steve Gove | 0.0032 |
| 11 | Albert A. Cannella Jr. | 8 | Patricia Mcdougall | 228.396 | Robert E. Hoskisson | 0.1394 | Peter J. Lane | 0.0029 |
| 12 | Richard A. Bettis | 8 | Gregory G. Dess | 228.396 | R. Duane Ireland | 0.1383 | Nandini Rajagopalan | 0.0029 |
| 13 | David J. Ketchen Jr. | 7 | Shaker A. Zahra | 216.137 | Brian K. Boyd | 0.1378 | S. Trevis Certo | 0.0028 |
| 14 | Richard B. Robinson Jr. | 7 | Michael A. Hitt | 210.890 | Janet Bercovitz | 0.1377 | James W. Fredrickson | 0.0024 |
| 15 | Paul W. Beamish | 7 | Robert E. Hoskisson | 124.784 | Bernard Yeung | 0.1372 | Jeffrey G. Covin | 0.0024 |
| 16 | Ranjay Gulati | 7 | Richard A. Johnson | 113.071 | Steve Gove | 0.1361 | Jeffrey S. Harrison | 0.0023 |
| 17 | Birger Wernerfelt | 7 | Brian K. Boyd | 109.999 | Michael Lubatkin | 0.1358 | WM. Gerard Sanders | 0.0022 |
| 18 | Shaker A. Zahra | 7 | Ryan Krause | 106.050 | Albert A. Cannella Jr. | 0.1356 | Steven Boivie | 0.0021 |
| 19 | Thomas Keil | 7 | John A. Pearce II | 104.420 | Xavier Martin | 0.1342 | Yan Zhang | 0.0020 |
| 20 | Jaideep Anand | 7 | R. Duane Ireland | 101.616 | Edward H. Bowman | 0.1341 | Mason A. Carpenter | 0.0019 |
| 21 | Jeffrey S. Harrison | 7 | Richard A. Bettis | 90.168 | Paul W. Beamish | 0.1338 | Richard B. Robinson Jr. | 0.0019 |
| 22 | Rajshree Agarwal | 7 | Tomi Laamanen | 88.853 | Jaideep Anand | 0.1336 | Sayan Chatterjee | 0.0018 |
| 23 | Tony W. Tong | 7 | Pankaj C. Patel | 76.573 | Richard A. Johnson | 0.1335 | Robert E. Hoskisson | 0.0018 |
| 24 | Constance E. Helfat | 7 | Rahul Kochhar | 72.993 | Rahul Kochhar | 0.1318 | Constance E. Helfat | 0.0018 |
| 25 | G. Tomas M. Hult | 6 | Nicolai J. Foss | 72.517 | Tony W. Tong | 0.1310 | C. K. Prahalad | 0.0016 |
| 26 | Charles W. L. Hill | 6 | David G. Sirmon | 71.781 | Anand Swaminathan | 0.1307 | Danny Miller | 0.0016 |
| 27 | W. Chan Kim | 6 | Frank T. Rothaermel | 71.781 | Kent D. Miller | 0.1307 | Will Mitchell | 0.0016 |
| 28 | Shige Makino | 6 | Steve Gove | 70.781 | Anne Parmigiani | 0.1301 | Brian K. Boyd | 0.0015 |
| 29 | Takehiko Isobe | 6 | Marta A. Geletkanycz | 53.752 | Africa Arino | 0.1296 | Marta A. Geletkanycz | 0.0014 |
| 30 | John A. Pearce II | 6 | Donald C. Hambrick | 49.195 | David G. Sirmon | 0.1293 | Beverly B. Tyler | 0.0014 |
| 31 | Margarethe F. Wiersema | 6 | D. Keith Robbins | 48.809 | Donald C. Hambrick | 0.1293 | Brian R. Golden | 0.0014 |
| 32 | Gordon Walker | 6 | Sydney Finkelstein | 41.699 | Frank T. Rothaermel | 0.1292 | Jeffrey J. Reuer | 0.0013 |
| 33 | Sayan Chatterjee | 6 | Donald D. Bergh | 39.745 | Gautam Ahuja | 0.1291 | Edward J. Zajac | 0.0012 |
| 34 | Kent D. Miller | 6 | Richard B. Robinson Jr. | 37.046 | Jerker Denrell | 0.1278 | Kent D. Miller | 0.0011 |
| 35 | Sydney Finkelstein | 6 | C. K. Prahalad | 36.121 | Francisco Polidoro Jr. | 0.1272 | Margarethe F. Wiersema | 0.0010 |
| 36 | N. Venkatraman | 6 | Jerker Denrell | 33.497 | Samina Karim | 0.1272 | Jaideep Anand | 0.0010 |
| 37 | Danny Miller | 6 | Sayan Chatterjee | 30.437 | C. K. Prahalad | 0.1271 | John A. Pearce II | 0.0010 |
| 38 | Pamela S. Barr | 6 | Richard J. Arend | 26.337 | Laurence Capron | 0.1269 | Timothy B. Folta | 0.0010 |
| 39 | Irene M. Duhaime | 6 | Andrew D. Hendserson | 25.564 | Avi Fiegenbaum | 0.1267 | Africa Arino | 0.0009 |
| 40 | Edward J. Zajac | 6 | Albert A. Cannella Jr. | 23.684 | Zur Shapira | 0.1267 | Harbir Singh | 0.0009 |
| 41 | Dan Schendel | 6 | Danny Miller | 22.020 | Pierre Dussauge | 0.1265 | Kathleen M. Eisenhardt | 0.0008 |
Degree centrality demonstrates how many collaborators a researcher engages. For a scientific community, more collaborators indicate higher degrees of intra-community influence, information flow, information exchange, and propagation (Yan and Ding, 2009). In addition, degree centrality highlights the actors who have high communication activity and popularity (Abbasi et al., 2011).
On the other hand, according to Bonacich (1972, 1987), degree centrality of an author is not sufficient to understand his or her centrality if this author has at least one co-author who has a link to a very central author. In this respect, the Bonacich Powers Index illustrates that authors who have ties with central authors have higher centrality degree than authors who do not (Yan and Ding, 2009). In other words, this index shows that researchers who co-authored with others have also co-authored with many other researchers (Fischbach et al. (2011: 24).
Closeness centrality is developed to measure the extent of influence for an author over the entire network. It explains how long information flow takes from a given vertex to others (Yan and Ding, 2009). “Closeness is a surrogate measure for the independence and efficiency for communicating with other nods in the network” (Abbasi et al., 2011: 597).
Betweenness centrality shows an author's capacity to connect other authors within the network (Acedo et al., 2006a). Hence, if an author has a high betweenness rate, he or she plays a crucial role to connect different groups as a broker, connector (Yin et al., 2006), or gatekeeper who frequently control information flows in the network (Abbasi et al., 2011).
Based on the results for all metrics in Table 8, Michael A. Hitt has the highest position in all rankings. There are also significant changes among collaborative groups. For instance, Michael A. Hitt, Donald C. Hambrick, and Richard A. Bettis were ranked 2nd, 5th, and 12th, respectively, in the degree centrality ranking; however they dropped to 14th, 30th, and 21th, respectively, in Bonacich's power index considering the influence of neighboring nodes (authors). Will Mitchell, Harbir Sing, Jeffrey J. Reuer, and J. Myles Shaver appeared 1st, 3rd, 5th, and 7th, respectively, in the degree centrality analysis, but they do not appear in the Bonacich's power index including top authors listed in the table. The meaning of these significant changes is that some of these authors’ collaborators have relatively lower degrees, and Will Mitchell, Harbir Sing, Jeffrey J. Reuer and J. Myles Shaver are extroversive collaborating critical authors. Among their collaborators, many are peripheral authors with less influence in the SM field, as noted and explained by Ye et al. (2013) for the tourism and hospitality field.
On the other hand, Catherine M. Daily, Dan R. Dalton, and Jeffrey G. Covin's rankings increased from 9th, 6th, and 8th, respectively, in the degree centrality rank to 1st, 3rd, and 4th, respectively, in the Bonacich's power index. Additionally, S. Trevis Certo, Matthew Semadeni, Robert E. Hoskissin, Richard A. Johnson, Patricia Mcdougall, and Gredory G. Dess, who did not appear in the degree centrality as top-ranked authors, were top-ranked authors in the Bonacich's power index ranking. These findings, according to Ye et al. (2013) depict the following: …some of those researchers who appear to have a relatively lower degree centrality ranking may in fact be closer to the top of the Bonacich centrality rankings. Although these researchers do not have prominent degree centrality themselves, many of their collaborators are critical researchers with considerable influence. Although they do not currently have a high number of collaborators and outputs, their connection to the influential research community is a good evidence of their future potential (p. 68).
The main purpose of this study was to investigate the intellectual structure and evolution of collaboration among authors in the strategic management discipline. Data were gathered from articles published in Strategic Management Journal, a leading journal in the strategic management field between 1980 and 2014. These data were used to gain insights on authorship, including authorship, authorship pattern, author productivity, ranking of authors, and co-authorship networks. Co-authorship networks included assessment and visualization of co-authorship network, comparison of the attributes of the SM co-authorship network with those of other disciplines, the evolution of the main component and core authors in the network, discussion on whether the SM network fits with the small world network theory, and individual network attributes. As Abbasi et al. (2011) indicated, the dataset of this study extracted from one journal, SMJ, does not represent all research outputs across the world on SM due to the possibility of significant biases, an evolving list of relevant journals, publications in other journals and languages, and other factors. Nevertheless, the study presents a fairly accurate network of collaborations in the field of SM and employs network theory indicators to analyze the field.
In the light of the results of analysis, there was a significant increase in the number of author appearances, number of authors, ratio of articles per author, ratio of authors per article, number of multi authored articles, number of authors of multi-authored articles, and the index of collaboration by sub-periods. However, the number of articles per author decreased in some periods. In addition, the collaboration rate among SM authors by years increased over the past 35 years and, in recent years, single-authored papers have declined significantly. This is an important signal with regard to the incorporation, dissemination, and transformation of the knowledge in the field as observed from other disciplines (see Fischbach et al., 2011; Elango and Rajendran, 2012; Kumar and Jan, 2013; Braun et al., 2001; Cronin et al., 2003; Ardanuy, 2012; Kundra, 1996; Moody, 2004).
The findings of this study provide significant contributions to SM, general management, and organization literature in several ways and represent the first published attempt to explore the intellectual structure and evolution of collaboration among authors in SM field via authorship and co-authorship analysis from both the macro and micro levels. The theoretical implications of the study are provided below:
First, the authorship pattern of the SMJ shows multi-authored articles dominated solo work, and this domination increased over the past periods; however, the growth of multi-authored articles is limited to papers with two or three authors. This conclusion is consistent with that of other studies from related disciplines (Amsaveni et al., 2013; Arya, 2012; Elango and Rajendran, 2012; Zafrunnisha and Pullareddy, 2009; Maheswaran et al., 2008; Weeks et al., 2004; Bandyopadhyay, 2001; Kalyane and Sen, 1995; Rana Madan and Agarwal, 1994).
Author productivity in the SMJ in each and all periods (1980–2014) is consistent with Lotka's Law (Barrios et al., 2008), as seen in other disciplines (Wallace, 2012; Barrios et al., 2008; Elango and Rajendran, 2012; Nath and Jackson, 1991; Chung and Cox, 1990). In light of these findings, the author productivity is not high in the SMJ. Mainly, there are two approaches to explain these findings.
The first consists of the intra-disciplinary, inter-disciplinary, and trans-disciplinary characteristics of SM. Therefore, SM remains a fragmented, scattered, undisciplined, and immature discipline because of the competitiveness of conflicting theories (Hamel and Heene, 1994), its pre-paradigm foundation (Rumelt et al., 1994), its temporal or non-updated theories (Prahalad and Hamel, 1994; Antonio, 2013; Warnier et al., 2013; Doordarshi et al., 2013), unobservable problems in theories (Godfrey and Hill, 1995), intellectual and practice fundamental flaws (Powell, 2001), procedure, principle and construct validity problems in its research studies (Ketchen et al., 2013; Boyd et al., 2005b; Brahma, 2009) and competing contingency hypotheses (Boyd et al., 2012). These issues may retard author productivity in the SM field.
The second consists of the characteristics of SMJ as a top-tier journal in the business and management realms. Getting published in the SMJ is a significant accomplishment for authors from many disciplines related to SM. The advantages of such an accomplishment is that it helps researchers gain a reputation, elicit more citations, get hired by high-ranked universities, realize academic promotions and other rewards, and secure funds from institutions or government agencies. Authors assume that they should publish at least once in the SMJ during their academic careers. On the other hand, many authors who are published in the SMJ are from non-English-speaking countries, so they have greater difficulties getting published in international journals indexed by WoS/SSCI/SCI (Gibbs, 1995). They may collaborate with researchers from English-speaking countries to achieve institutional or governmental requirements, and then they may not able to continue these collaborations. In addition, according to Lotka's Law, the SM field, as reflected in the SMJ, has a handful of researchers who are responsible for most of the literature. This may create a challenge for SM scholars to develop the maturity level of SM themes and collaborate with their counterparts in related fields. Most prolific researchers are accepted as authorities in the field and their dominance might generate parochialism (Boyacigiller and Adler, 1991).
Second, since “…a longitudinal comparison of such maps across a significant slice of the history of the field also informs us about the changes occurring in the social construction of the field and the evolving consensus, or lack thereof, about the domain of the field” (Nerur et al., 2008, p. 333), SNA is utilized to explore the evolution of co-authorship in the SMJ between 1980 and 2014 period divided into five equal and consecutive 7-year sub-periods. This comparison illustrates that the extent and closeness of collaborations among authors has decreased during the last 35 years; however, the size of the networks has increased significantly since 2008 because of new researchers who have joined the field. Additionally, the indicators of all periods (1980–2014) compared with those of other disciplines demonstrate the interdisciplinary nature of the SM field with a large set of participants and a wide range of collaboration. It also depicts the relatively low maturity of the SM research community, which has a loose structure and fewer close relationships, as seen in Boyd, Finkelstein, and Gove's study (2005) conducted in management and other business disciplines, and Ye et al.’s study (2013) conducted in the tourism and hospitality discipline. This inference, also, is confirmed in the discussion on whether SM fits with the small-world network theory. The SM collaboration network is not small world because (i) the cluster coefficient (0.13) indicates that the network was weakly clustered and the relationship between SM authors was not close, (ii) the exponent of power law was outside of the expected range, and (iii) networks were fragmented, scattered, and less connected in each period, although the mean distance was short (5.05). Therefore, SM is undergoing a process of maturation and consolidation. Hence, “…to optimize the collaboration network it is important to strengthen the connections between peripheral authors and mainstream authors, and to strengthen and tighten the existing collaborations” (Ye et al., 2013, p. 72).
Third, the evolution of main components of each period is assessed and core authors are identified. The sizes of main components surged significantly from each period to the next and, in the last period (2008–2014), a remarkable increase occurred. Hence, collaboration has increased and played a crucial role in the productivity of the last period. Core authors changed in every period with the exception of Michael A. Hitt, who appeared in three periods and all period networks. This shows that the network of SM demonstrates the low level of the maturity of the discipline.
Fourth, when the studies of core authors are investigated, there is evidence for metaphors professed as swings of a pendulum (Hoskisson et al., 1999), and the dual pendulum-macro-micro and internal-external- (Guerras-Martín et al., 2014). Scholars depict the tendency of SM research toward micro-macro research in the resource-based theory (Molina-Azorín, 2014) and illustrate the evolution of the topics and relationships between the keywords in the articles published in leading management journals between 1980 and 2005 (Furrer et al., 2008). However, more research on the studies of core authors is needed in order to gain a deeper understanding thereof and to capture new perspectives on the relationships among these studies and their citation counts, topics discussed, and methods used.
Finally, authors are ranked by centrality metrics, including degree centrality, Bonacich's power index, closeness centrality, and betweenness centrality. This ranking shows that many authors who were highly ranked are among the most productive scholars; this suggests the possibility of a stronger network in the future.
Theoretical developmentThe findings of this study contribute to the theoretical development in the SM field. For instance, graduate students and junior scholars often have difficulty identifying main research topics and the senior researchers who drive those research topics. Senior researchers from the SM field or other disciplines can benefit from understanding the evolution of the discipline. Editors should always encourage collaboration in the field and strengthen the network of the research community to consolidate the disciplines, disseminate knowledge, and shift expansion and transformation in the discipline. Last, many researchers in the SM field and the management and organization field are familiar with social network analysis, but studies conducted via this methodology are not common. Consequently, this paper offers benefits to all stakeholders.
Practical implicationsSM is a practice-centered field (Bromiley and Rau, 2014) helping managers formulate and implement strategies and scholars explore performance differences among firms. Hence, the findings of the current study provide helpful information to managers who “…do not typically search the scientific literature, sometimes work closely with academics” (Fischbach et al., 2011: p. 37) and/or are looking for new scholars or advisors. For example, managers work with core authors in the SM field who were identified in this study; they should read their studies to find out ways to improve their existing strategies or formulate new ones. Additionally, this study identified authors who played critical roles in the academic community of SM and have the potential to play such roles in the future. Therefore, managers benefit from these authors and their outputs. Last, this study might inspire some managers who are interested in conducting research and publishing their work. On the other hand, these benefits are useful for policy makers who are working universities and government agencies.
Limitations and future researchThe findings of this study will be helpful for researchers, academicians, graduate students, practitioners, and scientific journal editors within the SM field, but several limitations should be acknowledged. First, methodological limitations existed, including the subjective nature of visualization interpretation (Ramos-Rodriguez and Ruiz-Navarro, 2004), the seven-year time frame used in analysis and interpretations related to this time frame, and spelling errors and/or disambiguation in the authors’ names. Second, researchers might assess the authorship and co-authorship from related books, as well as conference papers focusing on strategy and SM practices since the sample of this study does not include them. Last, although this study focused on only co-authorship networks generated via articles published in the SMJ between 1908 and 2014, research groups and topics appeared in the network that were not assessed. As these last three limitations create opportunities, there are new avenues for future research.
First, this study is the first that evaluates the evolution of authorship and co-authorship in the SM field as a sub-discipline of management and organization. Further research can be conducted in the other sub-disciplines of management and organization, including human resource management, organization behavior, organization theory, leadership, business ethics, and entrepreneurship by following the methodology employed in this study. Second, to gain a deeper understanding in the co-authorship structure of the SM or other disciplines, research, including a single sample or multiple samples, may be conducted by focusing on dimensions, such as a number of leading international business and management journals (Academy of Management Journal, Academy of Management Review, Administrative Science Quarterly, Journal of Management, Management Science, Organization Science, and Strategic Organization) focus on strategy and SM themes or publish strategy and SM research, and/or regional differences based on continent, country, institution, and industry. Additionally, this study can be repeated in other disciplines within the management and organization realm, such as health care management and hospitality management.
Third, while a few studies illustrate the structure of collaborations based on gender (Abramo et al., 2013; Ozel et al., 2014), future authorship or co-authorship research in the SM field may be designed considering authors’ affiliations, as well as gender.
Fourth, there are ongoing discussions on how collaboration influences the performance indicators, including the number of articles, citations count, h-index, etc. (Cimenler et al., 2014; Abbasi et al., 2011; Corley and Sabharwal, 2010; Bidault and Hildebrand, 2014; Abbasi et al., 2012). In the future, these discussions may be embedded in the SM field.
Fifth, because in the networks, individual-level analysis, including structure holes (Burt, 1995) and group level- clique(s) (Hu and Racherla, 2008) were not considered in this study, new studies may be constructed using these indicators to gain comprehensive insights and ideas.
Last, only a few studies have utilized co-citation analysis (Ramos-Rodriguez and Ruiz-Navarro, 2004; Nerur et al., 2008), the evolution of the participant countries’ position (Ronda-Pupo and Guerras-Martín, 2010), and co-authorship, by using the SMJ as a sample. Moreover, research is needed that focuses on cross-institutional collaboration in articles published in the SMJ to delineate the intellectual structure of the SM field.
The author would like to thank John A. Parnell, Gary Ross, and Fevzi Okumus for their many helpful comments and suggestions. The author, also, gratefully acknowledges the helpful comments and suggestions received from the referees and the Associate Editor, Jaime Gómez.
These journals are Academy of Strategic Management Journal, Business Management and Strategy, International Journal of Applied Strategic Management, International Journal of Strategic Management, International Journal of Strategic Management and Decision Support Systems in Strategic Management, International Journal of Sustainable Strategic Management, International Strategic Management Review, Journal of Economics & Management Strategy, Journal of Global Strategic Management, Journal of Management and Strategy, Journal of Strategy and Management, Journal of Strategic Management Education, Strategic Management Journal, Strategic Management Quarterly, and Technology Analysis & Strategic Management.