


The aim of this paper is to analyse the influence of financial system liquidity and corporate leverage on a firm’s overinvestment. We posit that when external funds are easily available, as in expansionary monetary periods, debt loses its traditional role as a managerial control mechanism. Instead, the supply of systemic liquidity results in corporate leverage exacerbating the problem of overinvestment. Using a sample of over 12,400 companies from 25 OECD countries between 2003 and 2014, our results show a significant and positive relationship between corporate leverage and overinvestment when the liquidity of the financial system is high, confirming the shift in the role played by leverage. At the macroeconomic level, our research raises certain caveats concerning worldwide liquidity injections. At the microeconomic level, our study shows that the disciplinary role of debt might become a false friend when money abounds.
Over the last two decades, corporate financial decisions have been made in an environment characterized by financial deregulation and policies of monetary expansion. The risk of economic recession, particularly after 2000 when the dot-com bubble burst, led the central banks of the most developed countries to implement policies of low interest rates in order to revitalize corporate investment. Pre-economic crisis years may thus be described as characterized by a monetary policy of abundant capital supply (Diamond and Rajan, 2009; Hoffmann and Schnabl, 2011). In the United States, the interest rate fell from 6.5% to 1.8% between November 2000 and December 2001, a trend that continued until mid-2004. In Europe, the interest rate fell from 4.75% to 2% between May 2001 and June 2003. At the same time, both the Fed and the European Central Bank provided additional liquidity by purchasing asset-backed securities, commercial paper, and a wide range of other securities, such as those taken as collateral against loans under the new lending programmes.
Since money is not neutral (Mises, 1990), this abundant liquidity affected the financial behaviour of economic agents. In the case of households, the easily available credits resulting from low real interest rates led to an expansion of lending that sparked a real estate boom (Justiniano et al., 2015). Likewise, the supply of capital played an important role in increasing corporate financial leverage. As Leary (2009) pointed out, leverage ratios and debt placement structures are not determined solely by changes in firms’ demand for capital but also by supply frictions in the credit markets. In turn, an expansion (contraction) in the credit market leads to higher (lower) US firm leverage ratios. This direct effect of abundant liquidity on corporate leverage has been empirically supported by other authors worldwide (Faulkender and Petersen, 2005; Liu et al., 2018; Shen et al., 2016; Zeitun et al., 2017).
Credit availability also influences firms’ capital investments. Prior literature shows that corporate investment increases (decreases) when there is a positive (negative) shock on the external supply of capital (Almeida et al., 2012; Azofra Palenzuela and Rodríguez Sanz, 2012; Chen et al., 2013; Duchin et al., 2010; Lemmon and Roberts, 2010). Furthermore, high monetary liquidity not only increases investment but can also trigger a problem of overinvestment. The overinvestment problem in firms arises as a result of differing shareholder and manager incentives (Iskandar-Datta and Jia, 2014; López-Gutiérrez et al., 2015; Officer, 2011). According to the free cash flow hypothesis, too great a cash flow may be an incentive for managers to overinvest, i.e. to invest in negative NPV projects in order to increase the resources under their control. This free cash flow hypothesis has been tested by empirical research on numerous occasions (Bates, 2005; Blanchard et al., 1994; Jensen, 1986; Pindado and de la Torre, 2009; Richardson, 2006; Tribó, 2007). Liu et al. (2018) show that when capital is easily available and discount rates are low financial resources are considered as ‘free’ resources, which exacerbates the problem of corporate overinvestment.
This might have been the case of many large companies such as Abengoa, S.A. In five years, Abengoa grew from an electrical and industrial firm to the standard bearer of renewable energy facilities worldwide. In 2011, Abengoa’s debt was 1.1 billion euros (3.9 times the EBIDTA). Maintaining the same level of company profits, a year later the debt had soared to six billion euros, and continued to grow until it reached 25 billion in 2015. Despite the company being in an unfavourable scenario, given that oil prices fell sharply, Abengoa built the world's largest solar energy plant, making an oversized commitment to biofuels, particularly bioethanol. During this growth period, Abengoa opened 13 production plants worldwide. Such was the expansion euphoria that the company was even duped into acquiring one in Brazil, as acknowledged by the Court of International Arbitration in New York. However, after the party came the hangover, which forced Abengoa to negotiate a 97% takedown of loans with creditors, leaving the company to face a particularly uncertain future. Abengoa was not the only case of investment euphoria. The same period witnessed many major company bankruptcies, such as GM or Chrysler, caused by similar reasons.
What failed in these cases? Empirical research has tested the role of governance mechanisms such as executive remuneration (Agha, 2016; Eisdorfer et al., 2013; Lei et al., 2014), ownership structure (Andres, 2011; Goergen and Renneboog, 2001; Goh et al., 2016; Pindado and de la Torre, 2009; Wei and Zhang, 2008), or the level of shareholder rights (Kyröläinen et al., 2013) to alleviate corporate overinvestment. In addition, the literature has supported the role of leverage as a mechanism which reduces this overinvestment problem by decreasing the free cash flow under managerial discretionary control (Ahn et al., 2006; Aivazian et al., 2005b; D’Mello and Miranda, 2010; Fernandez, 2011; Firth et al., 2008; Harvey et al., 2004; Lang et al., 1995).
The basis of our counterintuitive paper is that when external funds are easily available, leverage fails as an effective mechanism for reducing overinvestment. Banking deregulation and copious money issuance on the part of monetary authorities has allowed corporate managers to issue low cost debt to finance negative NPV investments. In this context, the role of banks has not differed substantially from that played other debtholders. Although classical literature has traditionally allocated them a role as active agents who reduce ex-ante and ex-post information asymmetries (Akerloff, 1970; Diamond, 1984; Leland and Pyle, 1977), credit expansion, banking deregulation and financial innovation has distorted their traditional function as screeners of credit quality and has driven them towards engaging in riskier investments (Focarelli et al., 2011). In this setting of overflowing liquidity, banks have sought fresh investment opportunities by acquiring corporate bonds away from their traditional business core. In this line, Focarelli et al. (2011) have shown that debt security underwritten by commercial banks had a higher probability of default than that underwritten by investment houses. Thus, the result is the failure of leverage’s traditional role to monitor managerial investment decisions.
Taking account of all these arguments, we thus posit that corporate debt no longer alleviates the problem of overinvestment in this scenario of high global liquidity. To test this hypothesis, we use a sample of over 12,446 firms from 25 OECD countries for the period 2003 to 2014. We first estimate corporate overinvestment using Richardson (2006). We then introduce the output from this initial stage in an overinvestment model that includes financial system issues. Our results show the existence of a significant relationship between leverage and overinvestment, such that corporate debt increases the overinvestment problem when the liquidity of the financial system is high. We thus contribute to the literature by providing support to the counterintuitive idea that, during the recent period of easily available external funds, corporate leverage ceased to function as an effective mechanism for curbing managerial incentives for empire building and indeed only served to exacerbate firms’ overinvestment problems.
The paper is organized as follows. In section two, we explain the empirical research design, with the description of the sample, the model and the method used. Our main results are shown in the third section. The paper ends with some concluding remarks and suggests some directions for future research.
Sample, model and methodSample and methodOur sample comprises firms from the top 25 OECD countries by per capita GDP in 2003. The reason for such a selection is our wish to analyse the overinvestment problem of listed firms worldwide during the financial crisis. Thus, we study OECD countries in whose firms the overinvestment problem is most likely to have arisen. Our final sample consists of over 12,446 firms (75,078 observations) for the period 2003–2014 as shown in Table 1. Data concerning financial statements (balance sheet and profit and loss statements) and the market price of the firms comes from the Thomson One Banker database. Data on financial system liquidity is extracted from the Global Financial Development database (a World Bank database) updated to June 2017.
Composition of the sample by countries.
| # Firms | #Observations | |
|---|---|---|
| Australia | 1229 | 6590 |
| Austria | 52 | 324 |
| Belgium | 50 | 309 |
| Canada | 842 | 3727 |
| Denmark | 74 | 539 |
| Finland | 96 | 725 |
| France | 384 | 2329 |
| Germany | 276 | 1537 |
| Greece | 134 | 617 |
| Iceland | 2 | 20 |
| Ireland | 38 | 223 |
| Italy | 32 | 240 |
| Japan | 2856 | 21,809 |
| South Korea | 1304 | 6263 |
| Luxembourg | 28 | 115 |
| Holland | 43 | 278 |
| New Zealand | 68 | 380 |
| Norway | 91 | 494 |
| Portugal | 18 | 98 |
| Slovakia | 11 | 36 |
| Spain | 37 | 246 |
| Sweden | 24 | 162 |
| Switzerland | 121 | 627 |
| UK | 733 | 4581 |
| USA | 3903 | 22,809 |
| Total | 12,446 | 75,078 |
Given the counterintuitive aim of our paper, we must ensure that our data are consistent with previous research. Thus, our empirical study includes a descriptive analysis designed to check that our data are consistent with prior literature. We therefore test the relationship between overinvestment, financial system liquidity and corporate leverage through an explanatory analysis. This explanatory analysis follows a two-step method, since we first estimate the level of corporate overinvestment using the Richardson’s model before running a second model to test our hypothesis using the output on corporate overinvestment from the previous model.
Our database combines time series with cross-sectional data allowing for the creation of an unbalanced panel data.1 We estimate the second model through the panel data method (Arellano, 2003).
Model and variablesBased on Richardson (2006), and following subsequent studies such as Goh et al. (2016), Lei et al. (2014), Liu and Bredin (2010), Huang et al. (2015), and Zhang and Su (2015), we propose to use model (1) as a means to estimate firms’ level of overinvestment:
where INEWi,t is new investment form firm i in year t, scaled by total assets. This variable depends on the lagged new investment (INEWt−1); the firm’s growth opportunities (BM) measured as the book value of equity and liabilities divided by the sum of equity market value and book value of liabilities2; the firm’s leverage (LEVt−1) measured as the book value of total debt deflated by the sum of book value of total debt and the book value of equity; the firm’s cash balance (CASHt−1); the log of the number of years the firm has been listed (AGEt−1); the log of a firm’s total assets (SIZEt−1); and the firm’s stock returns (STOCKRETURNt−1). All of these variables are lagged one year. Since the Richardson model applies to the US setting and we have an international sample, we also control for year, industry and country-level issues through a set of dummy variables. The appendix provides a more in-depth description of the variables.
Following Lei et al. (2014), we consider the positive residual (εi,t > 0) of the model (1) as a proxy of the firm’s overinvestment (OVERI). The higher the positive residual, the higher the overinvestment. This residual is the dependent variable of model (2), with which we test our hypothesis concerning the changing role of leverage and financial system liquidity on overinvestment:

We estimate model (2) through the panel data methodology with fixed effects. We calculate DLIQ as a dummy variable measuring the financial system liquidity provided by banks and other creditors in each country and year. It takes the value one when system liquidity (in each year and country) is above the mean (in each country), and zero otherwise. We use the LEV variable measured in t and its interaction with financial system liquidity (LEV*DLIQ) to test the effect on overinvestment of debt as well as debt affected by financial system liquidity.3 As a robustness check we also estimate the model by substituting the LEV variable with the variation of leverage relative to that of the previous year (VARLEV). We also use as control variables the free cash flow (FCF) of the firm, that is the cash flow above what is needed to maintain assets in place and to finance anticipated new investments; the fraction of shares owned by the five major shareholders (OWN15) in order to control by ownership concentration (Goergen and Renneboog, 2001; Tribó et al., 2007); a dummy variable (FAM) that equals 1 if the major shareholder is a family and zero otherwise to test the role of the nature of major shareholder (Connelly, 2016); and a measure of creditors’ rights (CR) in each economy proposed by La Porta et al. (1998) and updated by Djankov et al. (2007) in order to test the effect of the creditor protection. Although González (2016) showed a negative relationship between the protection of creditor rights and corporate investment during the crisis, the relationship with the corporate overinvestment is still unclear.
ResultsDescriptive analysis and estimation of the overinvestment modelIn Table 2, we report the mean value, standard deviation and quartiles of the main variables. In panel A, we show the descriptive statistics for the variables of model (1). We can see that the mean value for new investments (0.058) is not far from that obtained in the Richardson study (0.075). This may be due to the fact that the variables in our sample include data from 25 countries, while the Richardson study focuses only on the United States.
Descriptive statistics.
| Mean | Std. Dev. | Q25 | Q50 | Q75 | |
|---|---|---|---|---|---|
| Panel A (75,078 obs) | |||||
| INEW | 0.058 | 0.086 | 0.004 | 0.029 | 0.078 |
| BM | 0.879 | 0.636 | 0.357 | 0.713 | 1.315 |
| LEV | 0.291 | 1.257 | 0.016 | 0.163 | 0.324 |
| CASH | 0.183 | 0.190 | 0.050 | 0.120 | 0.246 |
| SIZE | 8.349 | 1.039 | 7.719 | 8.350 | 9.010 |
| STOCKRETURN | 0.096 | 0.435 | −0.223 | 0.027 | 0.343 |
| AGE | 1.370 | 0.397 | 1.079 | 1.397 | 1.716 |
| Panel B (32,472 obs) | |||||
| OVERI | 0.039 | 0.049 | 0.009 | 0.022 | 0.050 |
| VARLEV | 0.044 | 1.143 | −0.019 | 0.000 | 0.028 |
| DLIQ | 0.529 | 0.500 | 0.000 | 1.000 | 1.000 |
| FCF | 0.008 | 0.178 | −0.004 | 0.057 | 0.107 |
| OWN15 | 0.398 | 0.254 | 0.191 | 0.371 | 0.524 |
| FAM | 0.293 | 0.455 | 0.000 | 0.000 | 1.000 |
| CR | 2.000 | 0.957 | 1.000 | 2.000 | 3.000 |
Mean, median, standard deviation and quartiles of the variables. INEW is the new investment of the firm calculated as total investment minus maintenance investment, scaled by total assets. BM is the growth opportunities of the firm measured as the book value of equity and liabilities divided by the sum of equity market value and book value of liabilities; LEV is leverage of the firm calculated as the book value of total debt deflated by the sum of book value of total debt and the book value of equity; CASH is the balance of cash and short term investment divided by total assets; SIZE is the log of total assets. STOCKRETURN is the stock returns of the firm; OVERI is the firm’ overinvestment measured as the positive residuals of the Richardson model; VARLEV is the variation of LEV variable in each company to the previous year; DLIQ is a dummy variable that takes the value of one when the financial system liquidity (in each year and country) is above the mean (in each country during the period analysed); and zero otherwise; the values shown for this variable have been weighted by the number of countries. FCF is the firm’s free cash flow; OWN15 is the fraction of shares owned by the first to five major shareholders; FAM is a dummy variable that takes the value of one if the major shareholder is a family, and zero otherwise; CR is the index of creditors’ rights in each economy proposed by La Porta et al. (1998) and the update by Djankov et al. (2007); the values shown for this variable have been weighted by the number of countries.
In panel B of Table 2, we report the descriptive statistics of the variables of model (2) in cases of overinvestment, that is, when model (1) residuals are above zero. This occurs in 43% of the sample (32,472 out of 75,078 observations).
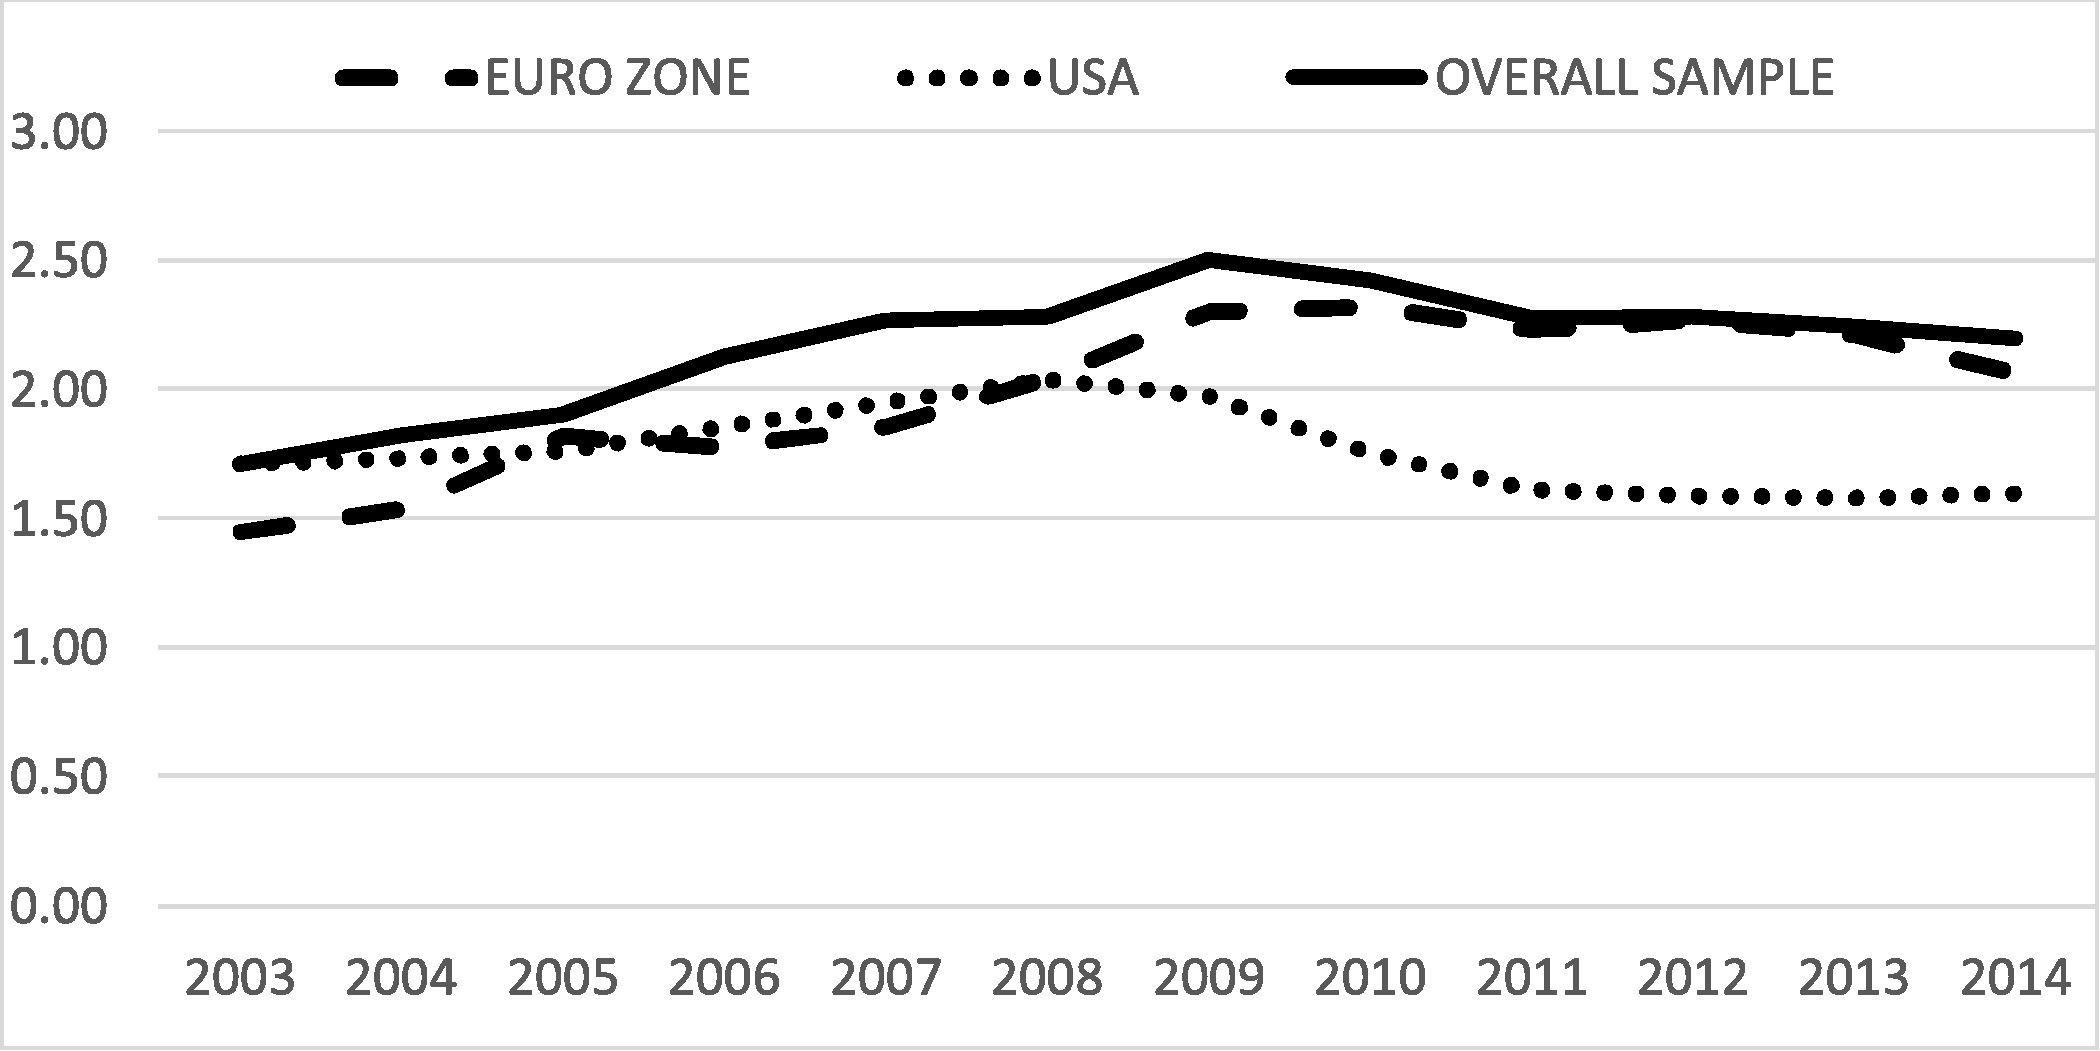
Fig. 1 shows the evolution of financial system liquidity for the whole period (2003–2014). This financial system liquidity has been calculated as the sum of the credit provided to the private sector by banks and debt securities (domestic and international) issued by the private sector as a share of GDP. This data has provided the basis for calculating the DLIQ dummy variable. We report the value for the whole sample, for the Eurozone, and for the United States. As can be seen, global financial liquidity gradually increases until 2008 or 2009. After that, around one year after the onset of the financial crisis,4 financial liquidity decreases, more sharply in the United States (Laeven and Valencia, 2012). Data from the Eurozone countries show a smaller reduction as a result of the high debt level in countries such as Spain (308% of GDP), Ireland (479% of GDP) or Portugal (293% of GDP). Broadly speaking, levels of global liquidity do not fall too much. Maximum liquidity value is reached in 2009 (2.5 times GDP), while in 2014 it only decreased by 0.3 (standing at 2.2 times GDP).
.")
In Table 3, we present the results of the estimations of model (1). Results suggest a significant positive relation between new investment expenditures and prior new investments, which could be understood in the light of continued firm investment behaviour and the adjustment costs of new investments (Aivazian et al., 2005a; Liu and Bredin, 2010). The coefficients of the prior investment, growth opportunities (measured with BM), corporate cash balance (CASH), and stock return (STOCKRETURN) are consistent with Richardson (2006). The coefficient of SIZE is negative and significant, unlike Richardson (2006). This might suggest that, in the period of study, the highest investments are made by companies in the fastest growing sectors that are not so intensive in fixed assets. Results from column (1) of Table 3 show a positive and significant coefficient of LEV. This result is contrary to Richardson (2006) but in line with our own expectations: greater leverage should lead to more overinvestment in a context of high financial system liquidity.
Results of the Richardson model estimation.
| Variables | (1) | (2) | (3) |
|---|---|---|---|
| Total firms | Firms with INEW ≤0 | Firms with INEW >0 | |
| INEWt−1 | 6.7E−01*** | 1.1E−02*** | 6.3E−01*** |
| (0.002) | (0.002) | (0.003) | |
| BMt−1 | −5.5E−03*** | 1.9E−03*** | −8.3E−03*** |
| (0.001) | (0.001) | (0.001) | |
| LEVt−1 | 4.0E−04** | −7.1E−04*** | 3.9E−03** |
| (0.001) | (0.001) | (0.001) | |
| CASHt−1 | 5.4E−02*** | 1.3E−02*** | 4.7E−02*** |
| (0.001) | (0.001) | (0.001) | |
| AGEt−1 | 9.0E−05 | 3.5E−03*** | −4.0E−03*** |
| (0.001) | (0.001) | (0.001) | |
| SIZEt−1 | −1.8E−03*** | 3.1E−03*** | −6.3E−03*** |
| (0.001) | (0.001) | (0.001) | |
| STOCKRETURNt−1 | 7.4E−03*** | 2.5E−03*** | 4.0E−03*** |
| (0.001) | (0.001) | (0.001) | |
| Intercept | 3.4E−02*** | −5.2E−02*** | 9.2E−02*** |
| (0.002) | (0.001) | (0.002) | |
| Year dummies | Yes | Yes | Yes |
| Country dummies | Yes | Yes | Yes |
| Observations | 75,078 | 14,060 | 61,018 |
| F-test | 4666.51*** | 72.57*** | 3983.30*** |
| Adjusted R-squared | 0.598 | 0.109 | 0.611 |
Estimated coefficients (standard errors) from the estimation of equation (1). INEW is the new investment of the firm calculated as total investment minus maintenance investment, scaled by total assets. BM is the growth opportunities of the firm measured the book value of equity and liabilities divided by the sum of equity market value and book value of liabilities; LEV is leverage of the firm calculated as the book value of total debt deflated by the sum of book value of total debt and the book value of equity; CASH is the balance of cash and short term investment divided by total assets; SIZE is the log of total assets. STOCKRETURN is the stock returns of the firm.
*Significance at the 90% confidence level.
We then perform two additional estimates for two groups of firms depending on whether they increase or reduce their fixed assets, i.e., whether the new investment is positive or negative (columns 2 and 3 of Table 3). The new results provide interesting insights into the dual role of leverage. On the one hand, for firms that have disinvested (column 2), there is a negative relationship between (dis)investment and leverage, which implies that the higher the leverage the higher the disinvestment. This relation might be due to corporate debt being a proxy of financial constraints or to the traditional role of debt as a deterrent of unnecessary investment. For firms with positive new investments (column 3), we obtain a positive relation between leverage and investment.
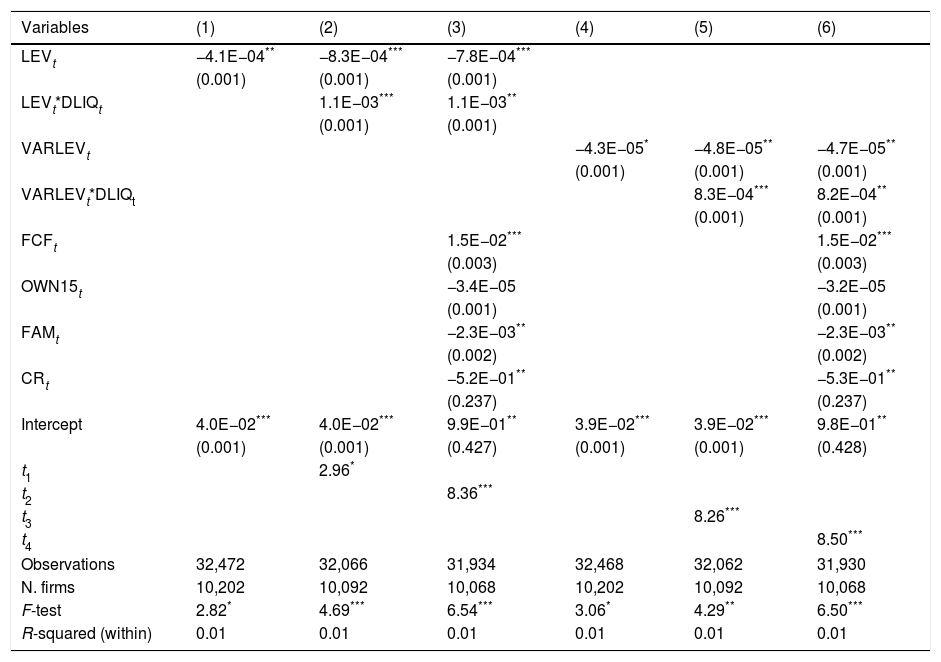
Analysis of the effect of financial system liquidity and leverageWe take the positive residuals of the model (1) as a proxy of corporate overinvestment (OVERI), which is regressed against the set of explanatory variables in model (2). Results are reported in Table 4.
Results of model (2).
| Variables | (1) | (2) | (3) | (4) | (5) | (6) |
|---|---|---|---|---|---|---|
| LEVt | −4.1E−04** | −8.3E−04*** | −7.8E−04*** | |||
| (0.001) | (0.001) | (0.001) | ||||
| LEVt*DLIQt | 1.1E−03*** | 1.1E−03** | ||||
| (0.001) | (0.001) | |||||
| VARLEVt | −4.3E−05* | −4.8E−05** | −4.7E−05** | |||
| (0.001) | (0.001) | (0.001) | ||||
| VARLEVt*DLIQt | 8.3E−04*** | 8.2E−04** | ||||
| (0.001) | (0.001) | |||||
| FCFt | 1.5E−02*** | 1.5E−02*** | ||||
| (0.003) | (0.003) | |||||
| OWN15t | −3.4E−05 | −3.2E−05 | ||||
| (0.001) | (0.001) | |||||
| FAMt | −2.3E−03** | −2.3E−03** | ||||
| (0.002) | (0.002) | |||||
| CRt | −5.2E−01** | −5.3E−01** | ||||
| (0.237) | (0.237) | |||||
| Intercept | 4.0E−02*** | 4.0E−02*** | 9.9E−01** | 3.9E−02*** | 3.9E−02*** | 9.8E−01** |
| (0.001) | (0.001) | (0.427) | (0.001) | (0.001) | (0.428) | |
| t1 | 2.96* | |||||
| t2 | 8.36*** | |||||
| t3 | 8.26*** | |||||
| t4 | 8.50*** | |||||
| Observations | 32,472 | 32,066 | 31,934 | 32,468 | 32,062 | 31,930 |
| N. firms | 10,202 | 10,092 | 10,068 | 10,202 | 10,092 | 10,068 |
| F-test | 2.82* | 4.69*** | 6.54*** | 3.06* | 4.29** | 6.50*** |
| R-squared (within) | 0.01 | 0.01 | 0.01 | 0.01 | 0.01 | 0.01 |
Estimated coefficients (standard errors) from the fixed effect estimation of equation (2). Standard errors are robust to heteroskedasticity of equation (2). The dependent variable is the measure of overinvestment (OVERI) when the value is above zero; LEV is leverage of the firm calculated as the book value of total debt deflated by the sum of book value of total debt and the book value of equity; VARLEV is the variation of LEV variable in each company to the previous year; DLIQ is a dummy variable that takes the value of one when the financial system liquidity (in each year and country) is above the mean (in each country during the period analysed); and zero otherwise; FCF is the firm’s free cash flow; OWN15 is the fraction of shares owned by the first to five major shareholders; FAM is a dummy variable that takes the value of one if the major shareholder is a family, and zero otherwise; CR is the index of creditors’ rights in each economy proposed by La Porta et al. (1998) and the update by Djankov et al. (2007). ti is the t statistic for the linear constraint test under the following null hypothesis: H0: βi + βj = 0 where βi and βj are the coefficients of the variable LEV and the variable LEV*DLIQ, in columns 2 and 3, and the coefficients of the variable VARLEV and VARLEV*DLIQ in columns 5 and 6 respectively.
As pointed out in the section ``Model and variables’’, model (2) might suffer from a problem of orthogonality between the overinvestment variable (OVERIt), built from the residuals of the Richardson model, and the debt variable (LEVt), already used in model (1). Although it is low, the correlation between the LEVt variable and the model (1) residuals is not zero (0.034). In contrast, the correlation between the LEVt−1 and the residuals is 0.000, evidencing that the orthogonality problem only occurs with the lagged LEV variable. Furthermore, the estimation of model (2) through the panel data with fixed effects (within estimator) instead of a pool regression by OLS,5 as well as the statistical significance of the negative coefficient of the variable LEVt (column 1 of Table 4), confirm the non-existence of orthogonality between the two variables.
In column 2, the coefficient of the LEV variable remains negative, although the interaction variable (LEV*DLIQ) is positive and statistically significant. When the dummy variable of the liquidity level of the economy (DLIQ) equals zero, the influence of financial leverage on overinvestment is therefore negative. Yet when the dummy variable of the liquidity level (DLIQ) equals one, the influence of LEV on overinvestment derives from the sum of the LEV coefficients (β1= −7.8E−04) and their interaction (β2 = 1.1E−03). The joint effect is positive and statistically significant (t2 = 8.36). In line with our basic argument, these results show that, in a context of high liquidity, corporate debt stimulates overinvestment.
Institutional and ownership control variables have been included in column 3 (Di Meo, 2014; Lei et al., 2014; Leland and Pyle, 1977; Lin, 2017; Ling et al., 2016; Shen et al., 2015). The positive coefficient of the free cash flow (FCF) confirms that overinvesting firms are those with the highest available free cash flow. We also include ownership measures: ownership concentration and the family nature of the largest shareholder. The results in column 3 of Table 4 suggest that a family as a first shareholder (FAM) attenuates the overinvestment problem. In this line, the literature shows that greater family firm aversion to risk leads to lower investment (Anderson et al., 2012). Moreover, the literature shows that family firms are more prone to underinvestment rather than to overinvestment problems (Nianhang et al., 2013). The relationship is also affected by the effective control of family shareholder factors such as the degree to which family control may be challenged or contested, sometimes referred to as its “contestability” (Andres, 2011; Connelly, 2016; Pindado et al., 2011). Ownership concentration (OWN15) also has a negative coefficient although it is not significant as in Richardson (2006). In addition, the higher creditors’ rights measure (CR), the lower corporate overinvestment.
Additionally, columns 4, 5 and 6 presents the estimation of the model using the variation of debt (VARLEV) and its interaction with liquidity as a robustness check. The results are similar to those of the model with the LEV variable, such that the coefficient of the variable VARLEV is negative while the coefficient of the variable interacted with liquidity (VARLEV*DLIQ) is positive and significant (t4 = 8.50).6 In this case, when the financial system liquidity is high, the influence of VARLEV on overinvestment is positive and statistically significant (β1 + β2 = 7.7E−04). These results evidence that the increase in debt in periods of high liquidity leads to greater overinvestment.
DiscussionMany studies into corporate finance have found empirical support for the free cash flow hypothesis, according to which cash flow might prove to be an incentive for managers to overinvest (i.e., to invest in projects with negative NPV). According to the traditional view, corporate leverage would be a mechanism of managerial discipline and a deterrent of overinvestment.
Challenging this traditional point of view, we posit that recent episodes of expansionary monetary policies have dramatically changed the role of corporate debt. Abundant financial and monetary liquidity at low interest rates has paved the way for managers to raise cheap funds in order to overinvest. In addition, this high liquidity has led creditors to relax lending conditions, both in terms of ex-ante selection and ex-post supervision, in search of new investment opportunities and paying less attention to risk.
In this context, our counterintuitive approach is that debt has lost its disciplinary role. Our results, based on a sample of over 12,400 firms from 25 OECD countries between 2003 and 2014, support this view. We find that global financial system liquidity has enhanced corporate overinvestment. Furthermore, we find that firms’ financial leverage is positively related to overinvestment in these contexts of abundant liquidity. Thus, overinvestment is not only exacerbated by internal funds or equity – as traditionally known – but also by external debt due to global liquidity flows.
We are aware that there may be a number of other factors influencing corporate overinvestment such as ownership structure, managerial compensation schemes or the legal and institutional environment. Our results allow us to add a new piece to this puzzle. These results have implications at the macroeconomic level as they suggest the existence of a dark side to worldwide liquidity injections. At the microeconomic level, our study calls for further research into the changing role of other firm-level issues such as cash balances. Whether recent monetary policies have had an impact on the way corporate liquidity affects overinvestment problems might be a direction for future research.
| Variable | Definition |
|---|---|
| INEW | New investment of the firm, defined as total investment (Itotalt) minus maintenance investment (Imaintenancet), scaled by total assets. The firm’s total investment is calculated as the sum of (1) capital expenditures; (2) R&D expenditures; minus (3) sales of property, facilities and equipment. Maintenance investment is the investment expenditure required to keep assets in place, and is calculated as the sum of amortization and depreciation. Source: Thomson One Banker. |
| BM | An (inverted) metric of the firm’s growth opportunities, measured as the book value of equity and liabilities divided by the sum of equity market value and book value of liabilities Source: Thomson One Banker. |
| LEV | The firm’s leverage measured as the book value of total debt deflated by the sum of book value of total debt and the book value of equity. Source: Thomson One Banker. |
| CASH | Cash and short term investments divided by total assets. Source: Thomson One Banker. |
| AGE | Log of the number of years the firm has been listed. Source: Thomson One Banker. |
| SIZE | Log of firm’s total assets. Source: Thomson One Banker. |
| STOCKRETURN | Annual market return of a firm’s stock. Source: Thomson One Banker. |
| OVERI | The firm’ overinvestment measured as the positive residual of the Richardson model. |
| VARLEV | The variation of LEV variable in each company to the previous year. |
| DLIQ | A dummy variable that takes the value of one when financial system liquidity (in each year and country) is above the country mean, and zero otherwise. Financial system liquidity is calculated as the sum of variables extracted from the Global Financial Development database that include credit provided to the private sector by banks (GFDD.DI.01) and debt securities (domestic and international) issued by private sector (GFDD.DM.03 + GFDD.DM.05) as a share of GDP. Source: World Bank database. |
| FCF | Free cash flow of the firm, measured as follows: FCF = CFA/P − Inew* where CFA/P are cash flow operations, including R&D expenditure minus maintenance expenditure. Inew* is the expected new investments calculated in model (1). It is scaled by total assets (Richardson, 2006). Source: Thomson One Banker. |
| OWN15 | Fraction of shares owned by the first to five major shareholders. Source: Thomson One Banker. |
| FAM | A dummy variable that equals 1 if the major shareholder is a family, and zero otherwise. Source: Thomson One Banker. |
| CR | The index of creditors’ rights in each economy. Source: La Porta et al. (1998) and the update by Djankov et al. (2007). |
The authors are grateful to Nuria Suárez, Xosé Vázquez, Philip Jaggs, Gabriel de la Fuente, and participants at the 27th ACEDE conference held in Aranjuez. All the remaining errors are the authors’ sole responsibility. We acknowledge the Spanish Ministry of Economy and Competitiveness for financial support (Project ECO2017-84864-P and ECO2014-56102-P).
For the sake of consistency, we estimate the Richardson model with pooled ordinary least squares with country, year, and industry-level control variables.
Although different to that of Richardson (2006), this measure has been used in a number of recent studies (Di Meo, 2014; Lei et al., 2014; Lin, 2017; Ling et al., 2016; Shen et al., 2015) that also follow Richardson’s model. Note that same as in Richardson (2006) the relation between the BM variable and a firm’s growth opportunities is negative. The reason to use this ratio instead of its reciprocal is based on its statistical properties (the distribution of BM is less skewed than its reciprocal).
Since the dependent variable in model (2) (OVERI) is built from the residuals of model (1) (Richardson's model), a problem of orthogonality might arise because the debt variable (LEV) is also an independent variable in the first model. However, our model avoids the orthogonality problem by using the variable LEV in t in model (2) and in t−1 in model 1. In any case, we test the absence of orthogonality by checking the non-zero correlation between the variable LEVt and the residuals from model (1) as well as by verifying the existence of a statistically significant relationship between the variable LEVt and the variable OVERt when model (2) is estimated through the panel data with fixed effects (within estimator) and with LEVt as the only independent variable. In the section ``Analysis of the effect of financial system liquidity and leverage’’ we show the results of these tests. We thank the associate editor for raising this issue.
Probably due to an inertia effect, it took banks and debt markets one year to start withdrawing liquidity in response to the financial crisis.
Hausman test results (available on request) suggest to apply fixed effects (FE) instead of random effects (RE).
ti is the t statistic for the linear constraint test under the following null hypothesis: H0: βi + βj = 0 (Lozano et al., 2002).