


In order to turn a fluid challenge into a significant increase in stroke volume and cardiac output, 2 conditions must be met: 1) fluid infusion has to significantly increase cardiac preload and 2) the increase in cardiac preload has to induce a significant increase in stroke volume. In other words, a patient can be nonresponder to a fluid challenge because preload does not increase during fluid infusion or/and because the heart (more precisely, at least 1 of the ventricles) is operating on the flat portion of the Frank-Starling curve. Volumetric markers of cardiac preload are therefore useful for checking whether cardiac preload effectively increases during fluid infusion. If this is not the case, giving more fluid, using a venoconstricting agent (to avoid venous pooling), or reducing the intrathoracic pressure (to facilitate the increase in intrathoracic blood volume) may be useful for achieving increased cardiac preload. Arterial pulse pressure variation is useful for determining whether stroke volume can/will increase when preload does increase. If this is not the case, only an inotropic drug can improve cardiac output. Therefore, the best option for determining the usefulness of, and monitoring fluid therapy in critically ill patients is the combination of information provided by the static indicators of cardiac preload and arterial pulse pressure variation.
Para ser efetivo em aumentar significativamente o volume sistólico um volume de fluido precisa preencher duas condições :
1- A infusão deste fluido tem que aumentar a pré-carga
2- O aumento da pré-carga tem que promover uma elevação proporcional do volume sistólico
Em outras palavras o paciente pode ser não responsivo à infusão de volume em termos de volume sistólico, devido a quantidade de fluidos ainda não ser a necessária ou o coração já estar operando na faixa superior da curva de Frank-Starling. Os indicadores volumétricos da pré-carga cardíaca são úteis para verificar se esta pré-carga aumenta efetivamente durante a infusão de fluido. Em caso negativo, ou seja a pré-carga não aumenta, medidas adicionais como mais fluidos, venoconstrictores para aumentar o quantidade de sangue, ou aumento do retorno venoso por redução da pressão intratorácica podem ser efetivas para atingir a primeira condição: aumento da pré-carga. Delta PP pode ser útil para verificar se o volume sistólico aumenta com a infusão de fluidos. Isto não acontecendo somente drogas inotrópicas podem aumentar o débito cardíaco. Portanto, combinando os indicadores estáticos da pré-carga (PVC, pressão capilar pulmonar) com Delta PP, consegue-se a melhor opção para monitorar a resposta aos fluidos em pacientes críticos.
The decision-making process concerning volume expansion is frequently based on the clinical examination and the assessment of cardiac preload indicators, mainly cardiac filling pressures.1 There is no doubt that in some cases (eg, hemorrhage or severe diarrhea) we can reasonably rely on clinical examination to identify patients who will benefit from fluid loading. However, in more complex—but not uncommon—situations (eg, septic shock) both clinical examination and indicators of cardiac preload have been shown to be of minimal value in answering the question: “can we improve cardiac output and hence hemodynamics by giving fluid?”2
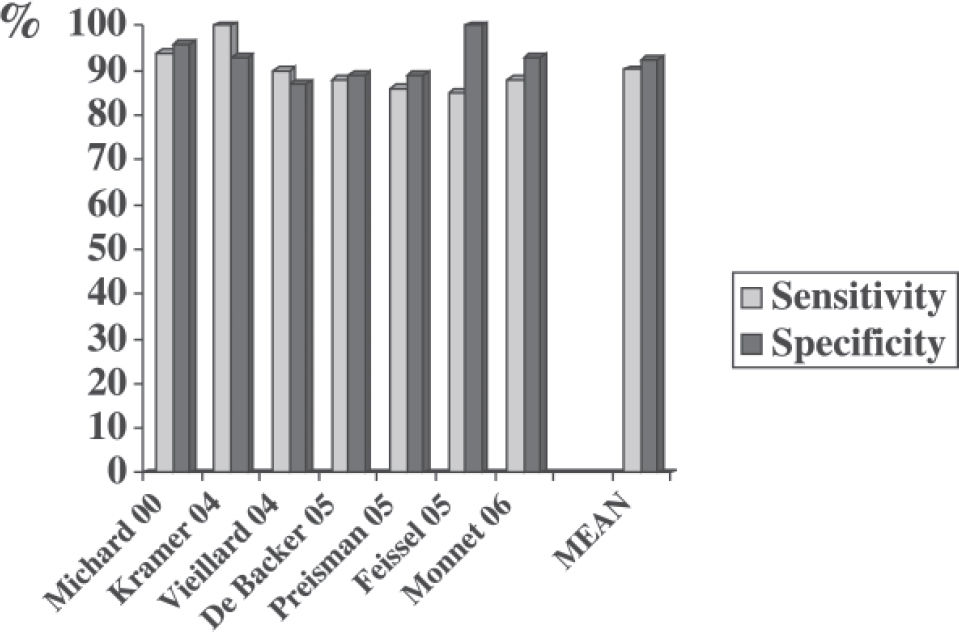
Over the past 6 years, many clinical studies have demonstrated the value of arterial pulse pressure variation (ΔΡΡ) to predict fluid responsiveness (ie, an increase in cardiac output as a result of fluid infusion) in sedated patients whose lungs are being mechanically ventilated3–10 (Figure 1).
 for discriminating between responders and nonresponders to fluid administration.")
The reliability and availability of ΔΡΡ—now automatically calculated and displayed on bedside monitors—and the minimal value of classical markers of preload in predicting fluid responsiveness necessarily raise the following question: “Should we continue to assess cardiac preload to determine fluid therapy?”
Therefore, we will first review the reasons why cardiac preload indicators are poor predictors of fluid responsiveness, and secondly we will describe the circumstances in which they may still be useful for the clinician.
Static indicators of cardiac preload and fluid responsivenessThe little value of cardiac filling pressures in assessing cardiac preload. In many clinical situations, cardiac filling pressures do not accurately reflect cardiac preload for at least 3 reasons. First, measuring cardiac filling pressures is not always easy. Indeed, several studies have demonstrated that observer variability in wedge pressure measurements is of potential clinical importance.11–13 Second, the pressures that are carefully measured at end-expiration are frequently higher than transmural pressures.14 This is the case in patients with airflow limitation (autoPEEP), in patients ventilated with an external PEEP, and in patients with intra-abdominal (and hence intrathoracic) hypertension (Figure 2). Third, the relationship between ventricular end-diastolic pressure and end-diastolic volume is not linear, but rather it is curvilinear and unpredictable since it depends on ventricular compliance and thus varies from one patient to another.15,16 In summary, because in practice we usually measure with poor reproducibility the nontransmural pressures that are not correlated with ventricular dimensions, we cannot rely on these measurements to accurately assess cardiac preload (Figure 2). This is why several volumetric parameters have been proposed to improve the accuracy of cardiac preload assessment at the bedside.
 is not useful for assessing cardiac preload, nor for tracking changes in preload: CVP is high while global end-diastolic volume index (GEDVI) is low, and CVP decreases while GEDI and stroke volume are going up.")
In this patient with ascites and abdominal hypertension, the central venous pressure (CVP) is not useful for assessing cardiac preload, nor for tracking changes in preload: CVP is high while global end-diastolic volume index (GEDVI) is low, and CVP decreases while GEDI and stroke volume are going up.
The limited value of volumetric markers of preload for predicting fluid responsiveness. The volumetric indicators of cardiac preload are mainly the right ventricular end-diastolic volume (RVEDV), which is evaluated by specific pulmonary artery catheters;17–19 the left ventricular end-diastolic area (LVEDA), which is measured by transthoracic or transesophageal echocardiography;20 and the global end-diastolic volume (GEDV) and intrathoracic blood volume (ITBV), which are evaluated by transpulmonary thermodilution.21–24 Several studies have demonstrated that these volumetric parameters can be useful for predicting fluid responsiveness—but only when they are very low or very high.17,18,24 For example, it has been shown that the rate of positive response to a fluid challenge is high when the RVEDV index is below 90 mL/m2, but low when the RVEDV index is greater than 140 mL/m2.17,18 Similar findings have been recently reported with the GEDV index, which reflects the volume of blood contained in the 4 heart chambers during diastole. When the GEDV index is below 600 mL/m2, a positive response to a fluid challenge is very likely; in contrast, when the GEDV index is greater than 800 mL/m2, a positive response is very unlikely.24 However, in all these studies, intermediate values are not more predictive than a random guess.
These findings are quite consistent with cardiac physiology, since the slope of the relationship between preload and stroke volume depends on contractility. Therefore, the pre-infusion cardiac preload is not the only factor influencing the response to a volume load. As illustrated in Figure 3, the increase in stroke volume, which occurs as a result of a rise in preload, depends more on the slope of the Frank-Starling curve than on cardiac preload.25 In summary, from a physiological point of view, assessing cardiac preload—even with volumetric parameters—cannot be really useful for predicting fluid responsiveness.
 as a result of cardiac preload increase (ΔP) depends on ventricular function shown by the slope of the curve (dotted line); assessing baseline preload is not useful in predicting ΔSV.")
Schematic representation of the ventricular preload/stroke volume relationship of a normal and a failing ventricle. The increase in stroke volume (ΔSV) as a result of cardiac preload increase (ΔP) depends on ventricular function shown by the slope of the curve (dotted line); assessing baseline preload is not useful in predicting ΔSV.
Why assess volumetric indicators of cardiac preload? Arterial pulse pressure variation (ΔPP) has been shown to be very useful in predicting fluid responsiveness because it provides the clinician with valuable information concerning the position on the Frank-Starling relationship.26 If the pulse pressure, which is directly proportional to stroke volume, varies during a mechanical breath, it means that the patient’s heart is sensitive to changes in preload induced by mechanical insufflation, ie, that both the right and the left ventricles are operating on the steep portion of the Frank-Starling curve.26 However, ΔPP works only if we assume that 1) respiratory changes in pleural pressure are sufficient to induce significant changes in preload and 2) fluid infusion significantly increases cardiac preload. These two conditions are not always met, and hence the static indicators of cardiac preload remain appropriate in the decision-making process concerning volume expansion.
Limitations of arterial pulse pressure variation (DPP). In a patient sensitive to changes in preload (i.e., one whose heart is operating on the steep portion of the Frank-Starling relationship), the arterial pulse pressure will vary over a single mechanical breath only if preload varies. Since respiratory changes in preload are induced by changes in pleural pressure, in patients ventilated with a low tidal volume (6 mL/kg for example), the respiratory changes in pleural pressure may not be sufficient to induce significant changes in preload.7,26 Therefore, in this context, the absence of respiratory variations in arterial pulse pressure does not mean that the patient is insensitive to changes in preload (and hence would be nonresponder to a fluid challenge) but simply that preload does not vary during the respiratory cycle. In this regard, ΔPP has been validated as an accurate predictor of fluid responsiveness mainly in deeply sedated mechanically ventilated patients having a tidal volume ≥ 8 mL/kg; therefore, it cannot currently be recommended as a clinical tool in other situations.26 Moreover, ΔPP cannot be used in patients with cardiac arrhythmias.27 Therefore, when ΔPP cannot be used, the assessment of cardiac preload may be useful for predicting fluid responsiveness if very low or very high values of RVEDV (< 90 or > 140 mL/m2), LVEDA (< 5 or > 20 cm/m2), ITBV (< 7 50 or > 1000 mL/m2) or GEDV (< 600 or > 800 mL/m2) are observed. But it must be emphasized once again that intermediate values of preload are not useful for predicting fluid responsiveness.
Fluid therapy does not always increase cardiac preload. One might assume that a fluid challenge systematically and necessarily induces a significant increase in cardiac preload and that it is only necessary to assess the position on the Frank-Starling curve (using ΔPP) to accurately identify patients who will benefit from a fluid challenge—but this is not the case. Fluid infusion increases intravascular blood volume (at least transiently) but not necessarily cardiac preload. Axler et al28 studied the hemodynamic effects of 159 “typical rapid volume infusions” in critically ill patients and did not observe any significant increase in left ventricular preload as assessed by the measurement of LVEDA using echocardiography. The increase in ventricular end-diastolic volumes as a result of fluid infusion depends on the partitioning of the fluid into the different cardiovascular compartments organized in series. When the heart is poorly compliant, giving fluid may not increase cardiac preload. Ventricular compliance can be decreased because of ischemic cardiopathy or simply because the ventricles are already dilated. These physiological or rather mechanical considerations are supported by several clinical studies. In critically ill patients receiving fluid, when the right ventricle is already dilated (RVEDV index greater than 140 mL/m2), fluid infusion does not increase right ventricular dimensions. In contrast, when the RVEDV index is below 140 mL/m2, the same fluid regimen leads to a significant increase in RVEDV.17 Similar findings have been reported with the GEDV.24 In patients with septic shock receiving the same amount of fluid (500 mL of colloid) over a short period of time (20-30 minutes), we observed various responses in terms of GEDV increase.24 These findings support the notion that a standardized fluid challenge does not induce the same increase in preload in all patients. In addition to ventricular compliance and dimensions, factors like mean intrathoracic pressure (by acting on the intra/extrathoracic repartition of the total blood volume) or venous capacitance/pooling (usually increased in sepsis) may also play a role in the partitioning of the fluid infused. Therefore, during a fluid challenge, assessing preload is definitely useful for checking whether preload effectively increases. If preload does not increase (for any reason), an increase in cardiac output cannot be expected even if the heart is operating on the steep portion of the Frank-Starling curve.