

The term “wavelets” covers a set of resources from the mathematical analysis that has proven their efficiency in system identification on areas such as hydrology, geology, glaciology, climatology and energy resources optimization. The methodology undergone on systems engineering could be extrapolated to everything conceptualized as “complex system” whatever its nature be. The wavelet techniques provide the description of non-stationary components and the evolution of macroeconomic variables in the frequency domain. The identification of predominant frequential scales and transient effects in time series highlights the multiresolutional analysis that would be more difficult to treat with traditional methods of econometrics. A review of the literature will show the potential problems that can be solved with these techniques, including prediction of benefits calculated on the evolution of the risk premium of a country, the extraction of symmetric macroeconomic shocks in country clusters, or detection of transient effects on the mutual influence of sovereign bonds between pairs of countries, among others. The dissertation will culminate in specific applications that show the power of wavelet techniques in identifying possible determinants and correlation of the evolution of sovereign bond yields in the euro area countries.
El término “ondículas” cubre un conjunto de recursos del análisis matemático que ha demostrado su eficacia en la identificación de sistemas en áreas tales como la hidrología, geología, glaciología, climatología y optimización de los recursos energéticos. La metodología utilizada en la ingeniería de sistemas podría extrapolarse a todo lo conceptualizado como “sistema complejo”, fuere cual fuere su naturaleza. Las técnicas de “ondículas” aportan la descripción de los componentes no estacionarios y la evolución de las variables macroeconómicas en el campo de la frecuencia. La identificación d e las escalas frecuenciales predominantes y los efectos transitorios en las series temporales enfatiza el análisis multi -resolución, que podría ser más difícil de tratar con el uso de métodos econométricos tradicionales. Una revisión de la literatura refle jará los problemas potenciales que pueden solucionarse utilizando estas técnicas, tales como la predicción de los beneficios calculados sobre la evolución de la prima de riesgo en un país, la extracción de los shocks macroeconómicos simétricos en los clusters del país, o la detección de los efectos transitorios sobre la influencia mutua de los bonos soberanos entre los pares de países, entre otros. La disertación desembocará en aplicaciones específicas que reflejarán el poder de las técnicas de ondículas en la identificación de posibles determinantes, y la correlación de la evolución de los réditos de los bonos soberanos en los países de la zona Euro.
Classically, the debt issued by a national government was transformed into bonds in the currency of a country with a more stable economy. It could be used as a source of income for pension funds, university donations, charities and other institutions. Recent developments in the euro-zone and the incursion of other developed and emerging markets have contributed to a shift in thinking about the materiality of responsible investment in this type of credit investing, which casts doubt on the existence of risk-free sovereign bonds. The Principles for Responsible Investment (PRI) given by Kohut et al. (2013) explores the ways of applying to fixed income environmental, social and governance (ESG) factors in deciding where investors could put their money in. The environmental factors generally considered are climate change, biodiversity, energy resources, biocapacity and ecosystem quality and natural disasters. Social factors include: human rights, education, health levels, demographic change employment levels, social exclusion and poverty, trust in institutions, crime and safety, and food security. Governance factors are institutional strength, corruption, regime stability, political rights, regulatory effectiveness and accounting standards, among others.
In time series analysis, there are several objectives which can be classified into the categories of description, explanation, forecasting, control and monitoring. A simple objective of any time series analysis is to provide a concise description of the past values of a series which involves the underlying generating process of the time series. Data plot complements the formal and quantitative analysis to show important features of the series such as trend, seasonality, outliers and discontinuities. Time series observations taken on two or more variables can be used to explain that the variation in one time series produces correspondent changes in the other time series.
System engineering is defined broadly as the art and science of creating whole solutions to complex problems. It provides methods to find the right model adapted to the peculiarities of the system in study. Identification techniques, developed to represent typical engineering artificial systems through linear and nonlinear models, can be applied in the study of economy systems. The technique also called data-driven modeling is based on analysis of data from one system, seeking in particular connections between the system state variables (input and output variables).
Mathematical models are formal statements or equations to express the relationship between system inputs, outputs and operations, to perform simulations or forecast the future economy state. Mathematical model structures and computability power that ever have helped to financial analysts are strongly required now in order to shed light on a complex problem where a lot of these factors are immeasurable as some of ESG. The immediate impact is the rise of yields for the sovereign bonds of the issuing country and also, likely an international propagation of this impact. The hypothesis is that from a comovement study on time series evolution of sovereign bonds in several European countries, and applying well-known system engineering methods, we can assess, or at least put in evidence, the periocity and intensivity of these impacts propagation. In this regard, special tools, as those based on wavelet transform, are being considered in preparing time series such as smoothing of signals, spectral analysis, coherence levels and outliers detection, among others.
The literature rapidly spread out and wavelet analysis is now used extensively in physics, geophysics (Grinsted et al., 2004), epidemiology (Cazelles et al., 2007), neuroscience, signal processing (Ricker, 2003), hydroclimatology (Rivera et al., 2007), oceanography (Meyers et al., 1992), hydrogeology (Labat et al., 1999; Chinarro et al., 2012), electricity demand (Hernndez et al., 2013), remote sensing data (Ebadi et al., 2013), computing complex problem as Maxwell's curl equations (Amat and Muoz, 2008), among other fields.
In the economic and financial literature, comovement is assessed in the time domain through the well-known correlation coefficient. The work of Kydland and Prescott (1982) and Long and Plosser (1983), and many authors have investigated the properties of business cycles.
The comovement and dependencies between the economic time series analyzed in the frequency domain can be found in the pioneering paper of Croux et al. (2001) who propose the cohesion, as a measure in the frequency domain of dynamic comovement between several time series. They dynamic correlations to estimate determinants of output comovement between OECD countries are studied by Fidrmuc et al. (2012), where trade intensity, financial integration, and specialization patterns have significantly different effects on comovements at different frequencies.
Genay et al. (2001) supplied a unified view of filtering techniques with a special focus on wavelet analysis in finance and economics offering testing issues with descriptive focus on access to a wide spectrum of parametric and nonparametric filtering methods. Cariani (2012) compares wavelets based method to analyze the business cycles in Romania between 1991 and 2011, with the standard approaches in literature. Sangbae Kima (2007) established a relationship between changes in stock prices and bond yields in the G7 countries through Wavelet analysis. Business cycles in a transition economy are revealed by Cariani (2012). On a wavelet-based approach, they show an evidence of business cycles properties varying in time, frequency and intensity.
The wavelet analysis is proposed to assess simultaneously the comovement at the frequency scales and along the time line. So, it is possible to capture the time and frequency varying features of comovement within a unified framework which constitutes a refinement to previous approaches.
After collecting time series of sovereign bond from eleven countries (Fig. 1), this paper emphasizes the methods and explanations on wavelets techniques, with special focus on exactly what wavelet analysis can reveal about economics time series. It offers testing issues which can be performed with wavelets in conjunction with the multi-resolution analysis to coevaluate two or more time series of sovereign bonds. The paper is organized as follows. In Section 2, the methodology of the proposed method is described. In Section 3 the usability of the method is demonstrated in the application of sovereign bond coevolution in several European countries. The paper is concluded in Section 4.
2Method description2.1Dynamical breakdown of the time
The expression L(ℝ)2 is a Hilbert space, with inner product ∫ℝf(t)g*(t) dt (g* is g complex conjugated), for all f and g functions defined in this space. Moreover, f and g should be square integrable functions, so ∫ℝf(t)g*(t) dt<∞. Since this integral is usually referred to as the energy of the function f, this space is also known as the space of functions with finite energy. Therefore, with inner product in L(ℝ)2 can be defined as an associated norm ||f||=〈f,f〉2.
The Plancherel relation is 〈f(t),g(t)〉=〈fˆ(t),gˆ(t)〉 where f(t),g(t)∈L2(ℝ) and fˆ denotes de Fourier transform of f(t): fˆ(t)=∫−∞∞f(t)e−i2πωt dt. The Plancherel identity says that an energy of a function is preserved by the Fourier transform: ||f(t)||2=||fˆ(t)||2 (Korner, 1988).
To discover properties at different frequencies, it is common to utilize Fourier analysis. However, under the Fourier transform, the time information of a time-series is completely lost. Because of this loss of information it is hard to distinguish transient relations or to identify when structural changes do occur. Moreover, these techniques are definitively not appropriate to deal with non-stationary time-series. To overcome the problems of analyzing non-stationary data, Gabor (1946) introduced the Short Time Fourier Transform. The basic idea is to break a time series into smaller samples and apply the Fourier transform to each sample. However, this approach is inefficient because the frequency resolution is the same across all different frequencies (Raihan et al., 2001).
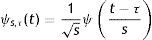
2.2Wavelet analysisWavelets are well appropriated for analyzing signals that hold local nonlinearities and singularities. Applying wavelets, important information appears through a simultaneous analysis of the signal time and frequency properties (Mallat, 1998). The continuous wavelet transform (CWT) f˜(t)s,τ of a function f(t), on the base of the wavelet mother ψs,τ is defined as the inner product 〈f(t),ψs,τ〉 in the measurable and square integral spaces L(ℝ)2 (Daubechies, 1990; Mallat, 1989), as is set out in Eq. (1):
where ψ* is the complex conjugate. The mother wavelet ψ(t) is normalized ||ψ||2=∫−∞∞|ψ(t)|2 dt=1. All wavelet functions used in the transformation are derived from the mother wavelet through translation (shifting) and scaling (dilation or compression), modifying s and τ in ψs,τ.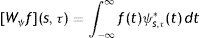
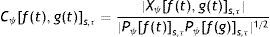
The cross wavelet spectrum (XWS) between f(t) and g(t) signals around time t and scale s is defined by (3) as the convolution of the CWT of both signals (Mallat, 1989).

The wavelet power spectrum (WPS) or autocorrelation function of the wavelet transformation of a signal is defined as

The representation of the continuous wavelet transform (Eq. (4)) produces unnecessary redundant information. Therefore, for practical purposes the discrete wavelet transform to a set of selected according to the power series is used bands. This discretization produces an array of powers:
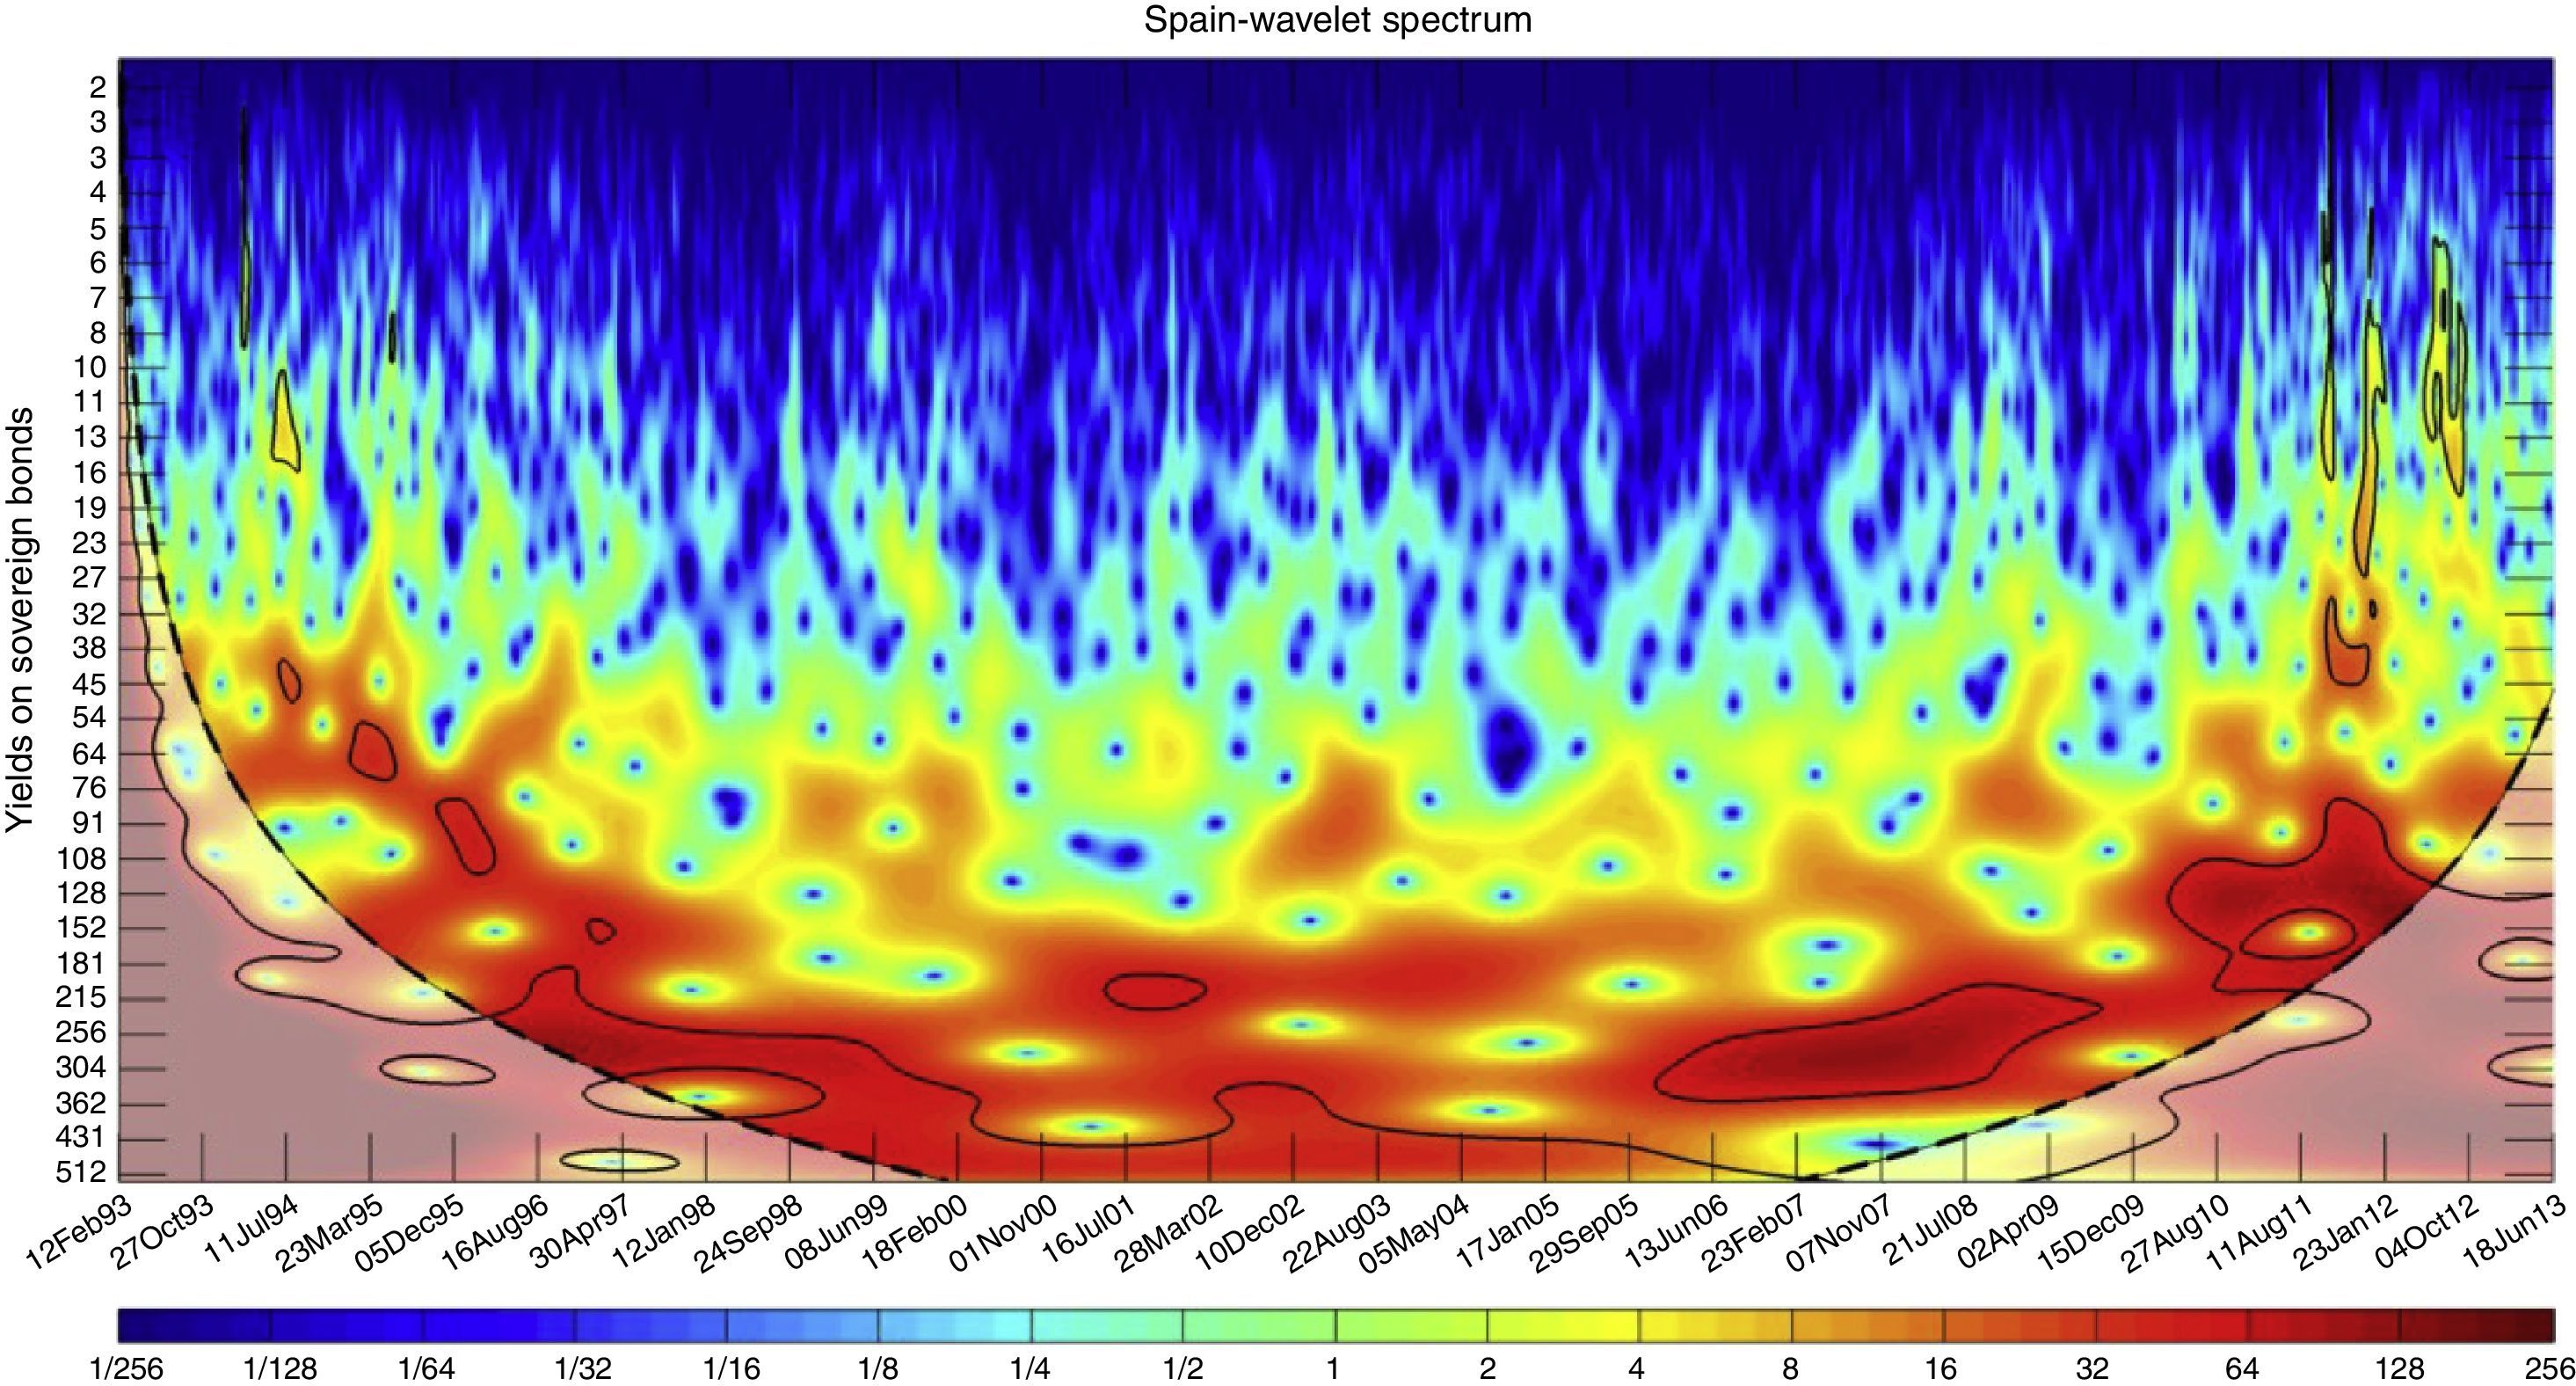
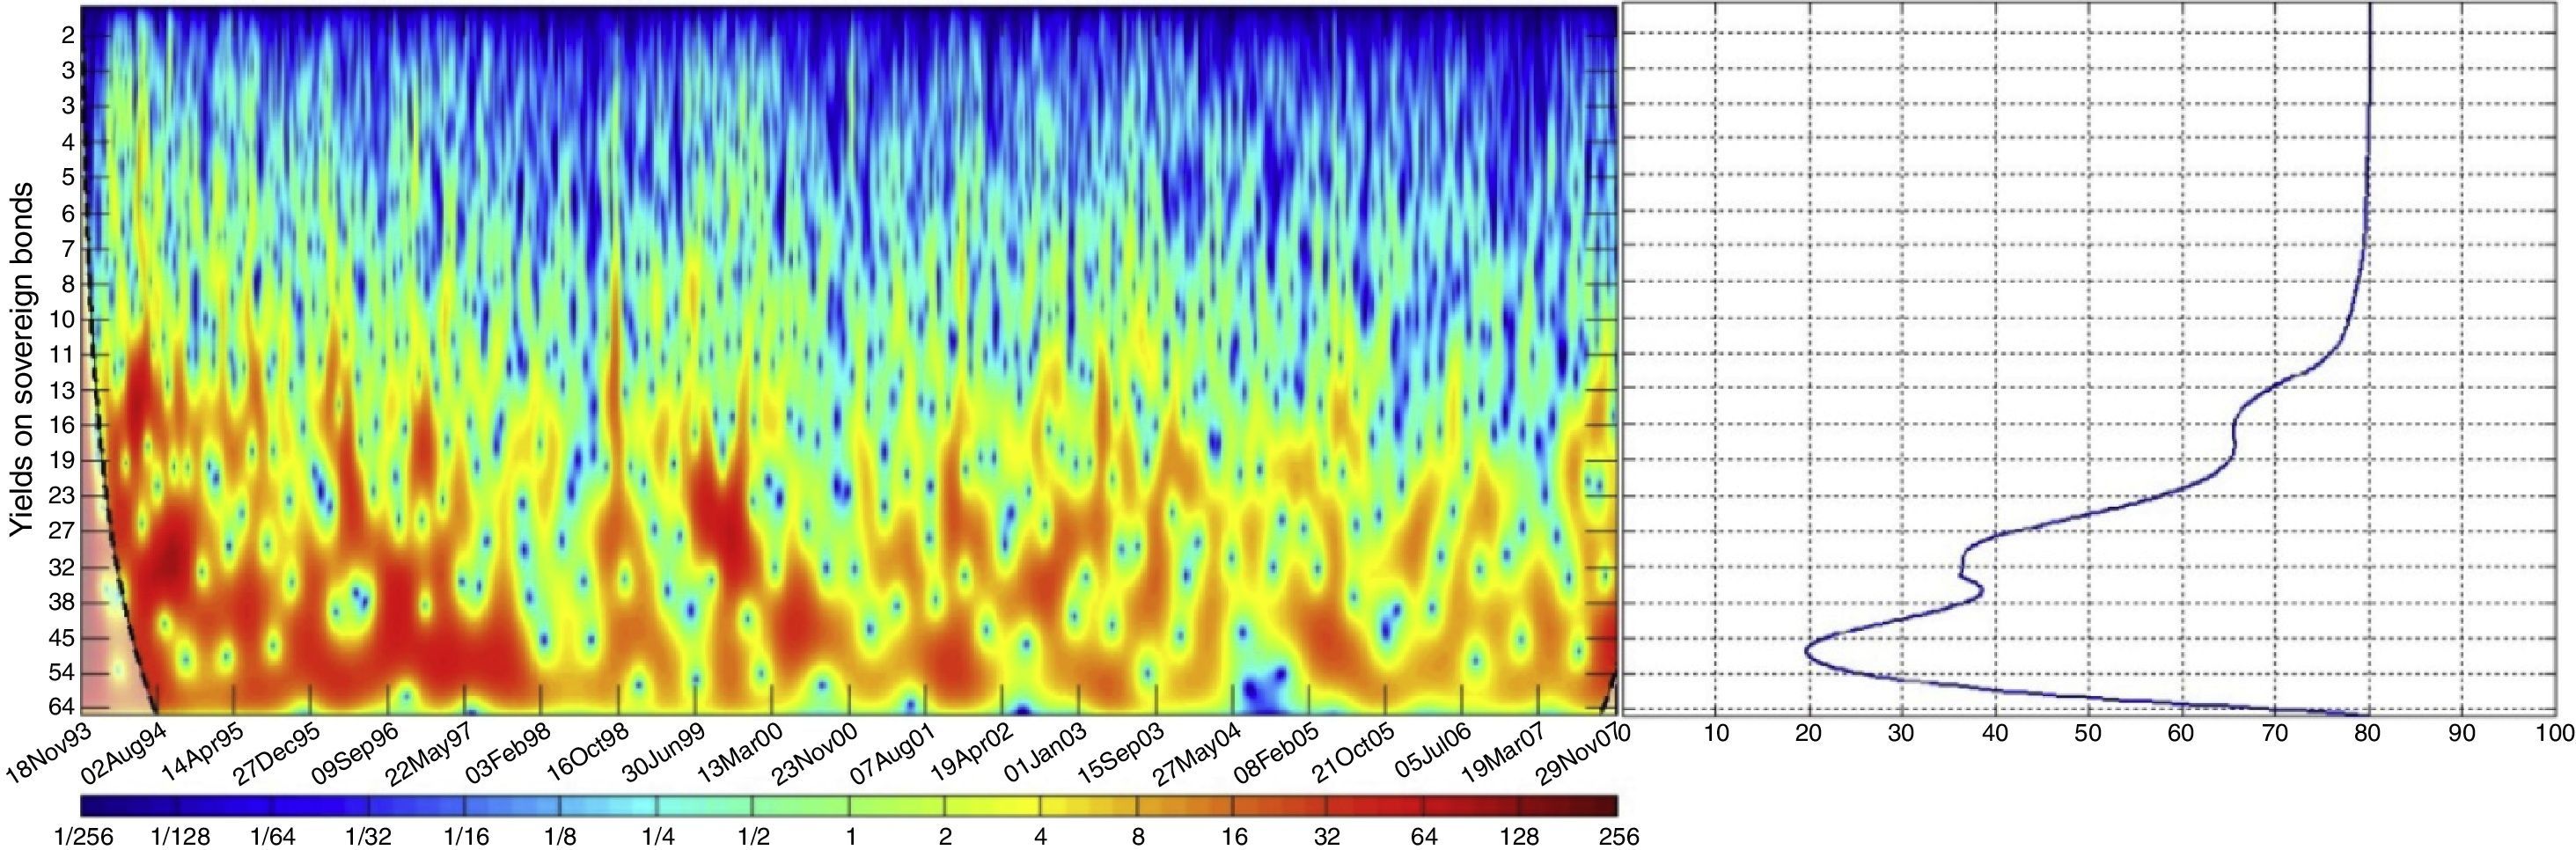
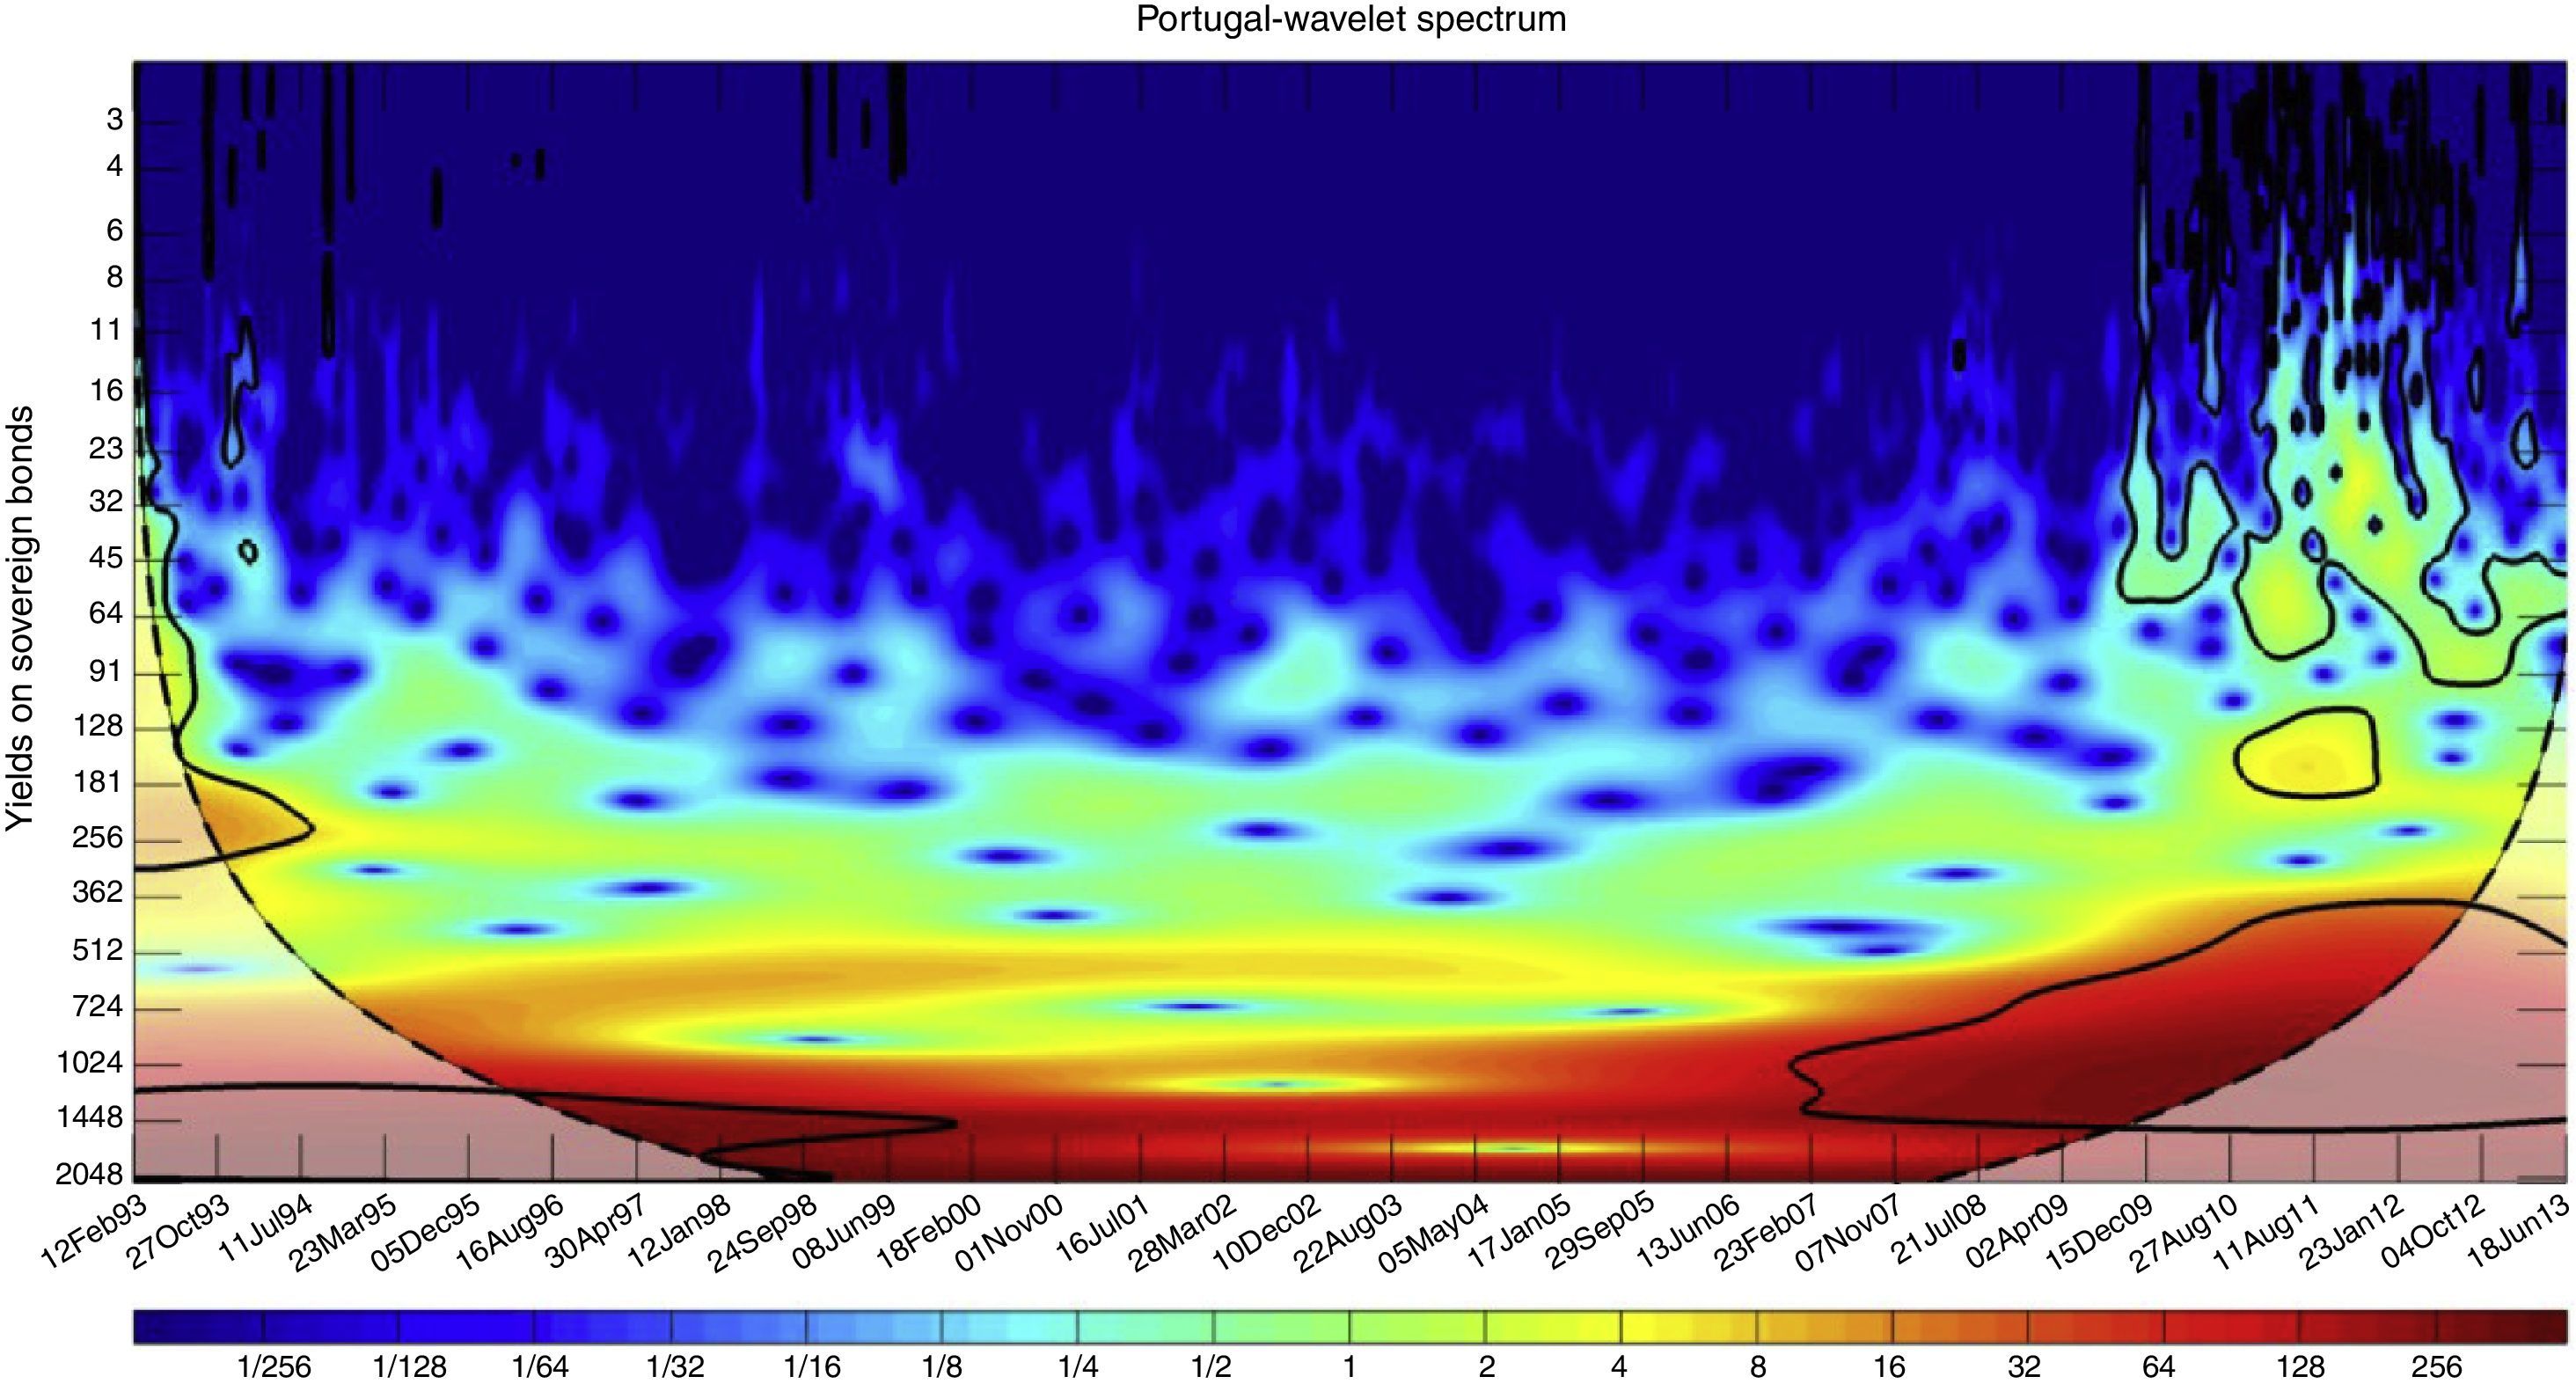
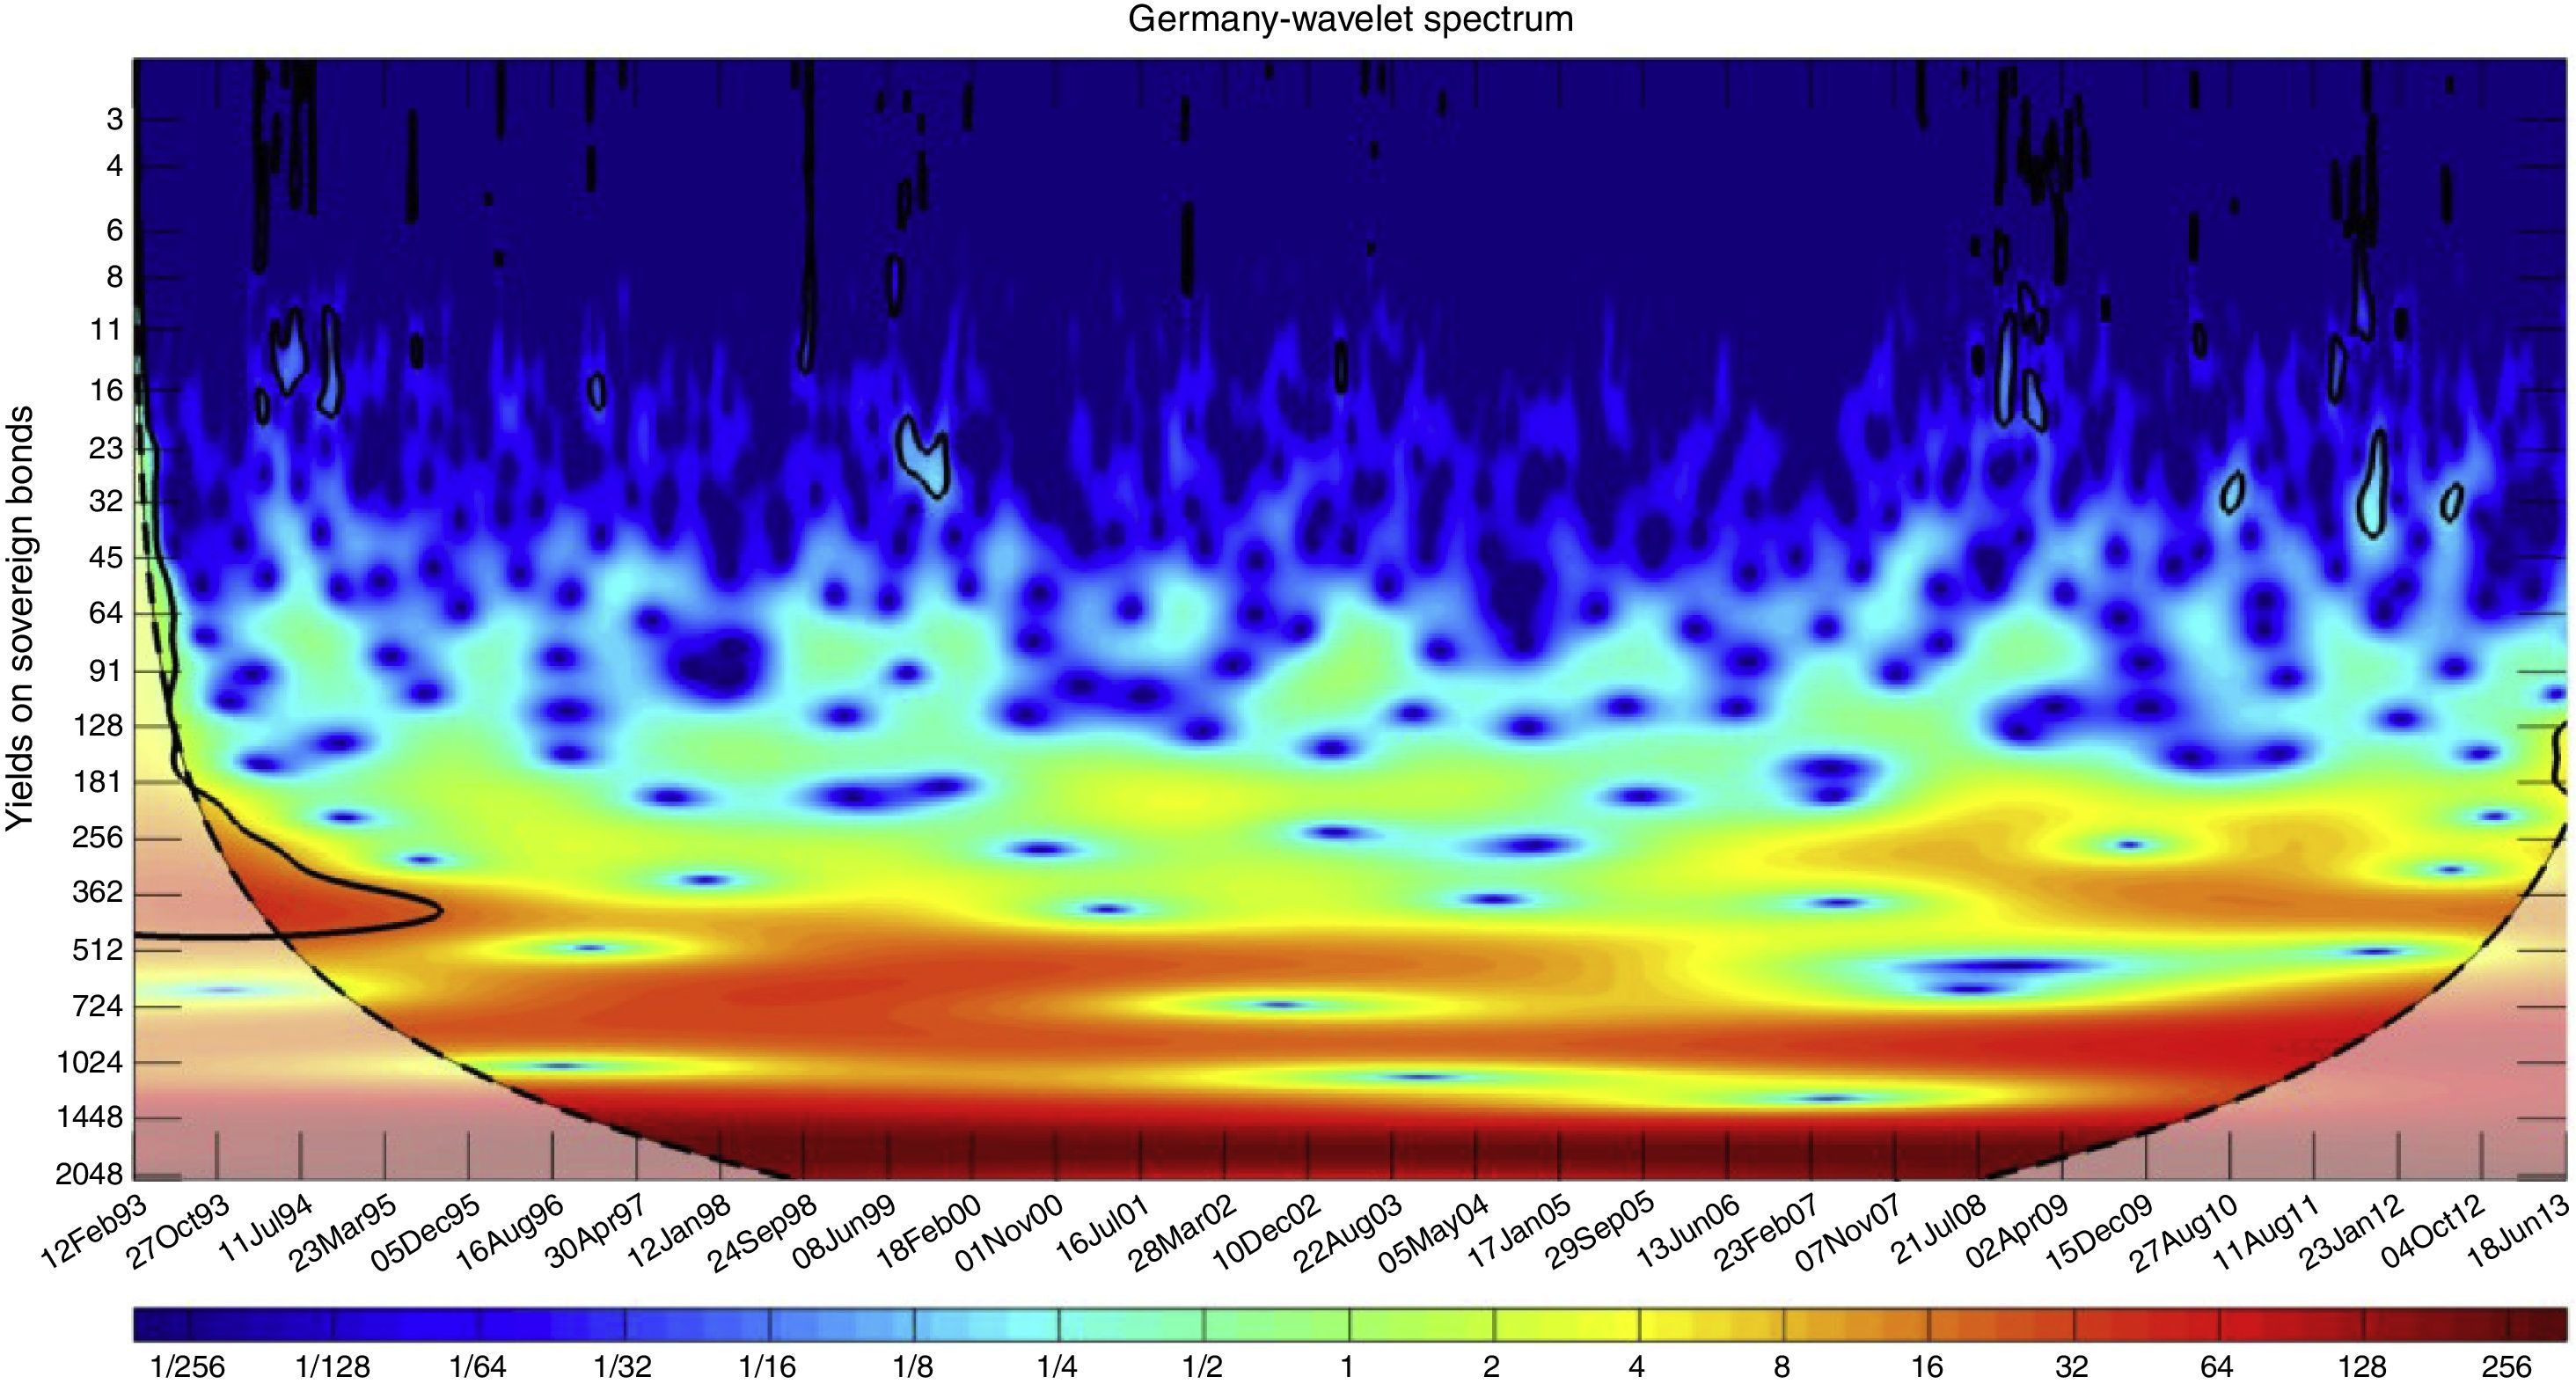
where j=20, 21, …, 2k for each band of frequency and i≥0 are the values of discrete time considered. A scalogram or spectrogram is the graphic representation of the normalized wavelet power of a signal f(t) in a time-varying frequency domain, within a three-dimensional space: time (x), scale/frequency (y) and power (z). The example given in Fig. 2 is a discrete power spectrum representation. Color tones stand for coefficient values in the spectral matrix (Eq. (5)), Y-axis is the range of selected power bands and X is the timing of the signal.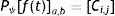
. The X-axis is time (days). Curved lines on either side indicate the cone of influence (dashed line) where edge effects become important. Spectral strength is shown by colors ranging from deep blue (weak) to deep red (strong). The thick black contour designates the 5% significance level against red noise. (For interpretation of the references to color in this figure legend, the reader is referred to the web version of the article.)")
Wavelet power spectrum of sovereign bond evolution in Spain. The Y-axis is the wavelet scale (bond yield in percent). The X-axis is time (days). Curved lines on either side indicate the cone of influence (dashed line) where edge effects become important. Spectral strength is shown by colors ranging from deep blue (weak) to deep red (strong). The thick black contour designates the 5% significance level against red noise. (For interpretation of the references to color in this figure legend, the reader is referred to the web version of the article.)
The wavelet transform applied to a finite length time series inevitably suffers from border distortions. The affected region is delimited by the cone of influence (COI) of the wavelet spectrum that can be calculated according to Grinsted et al. (2004).
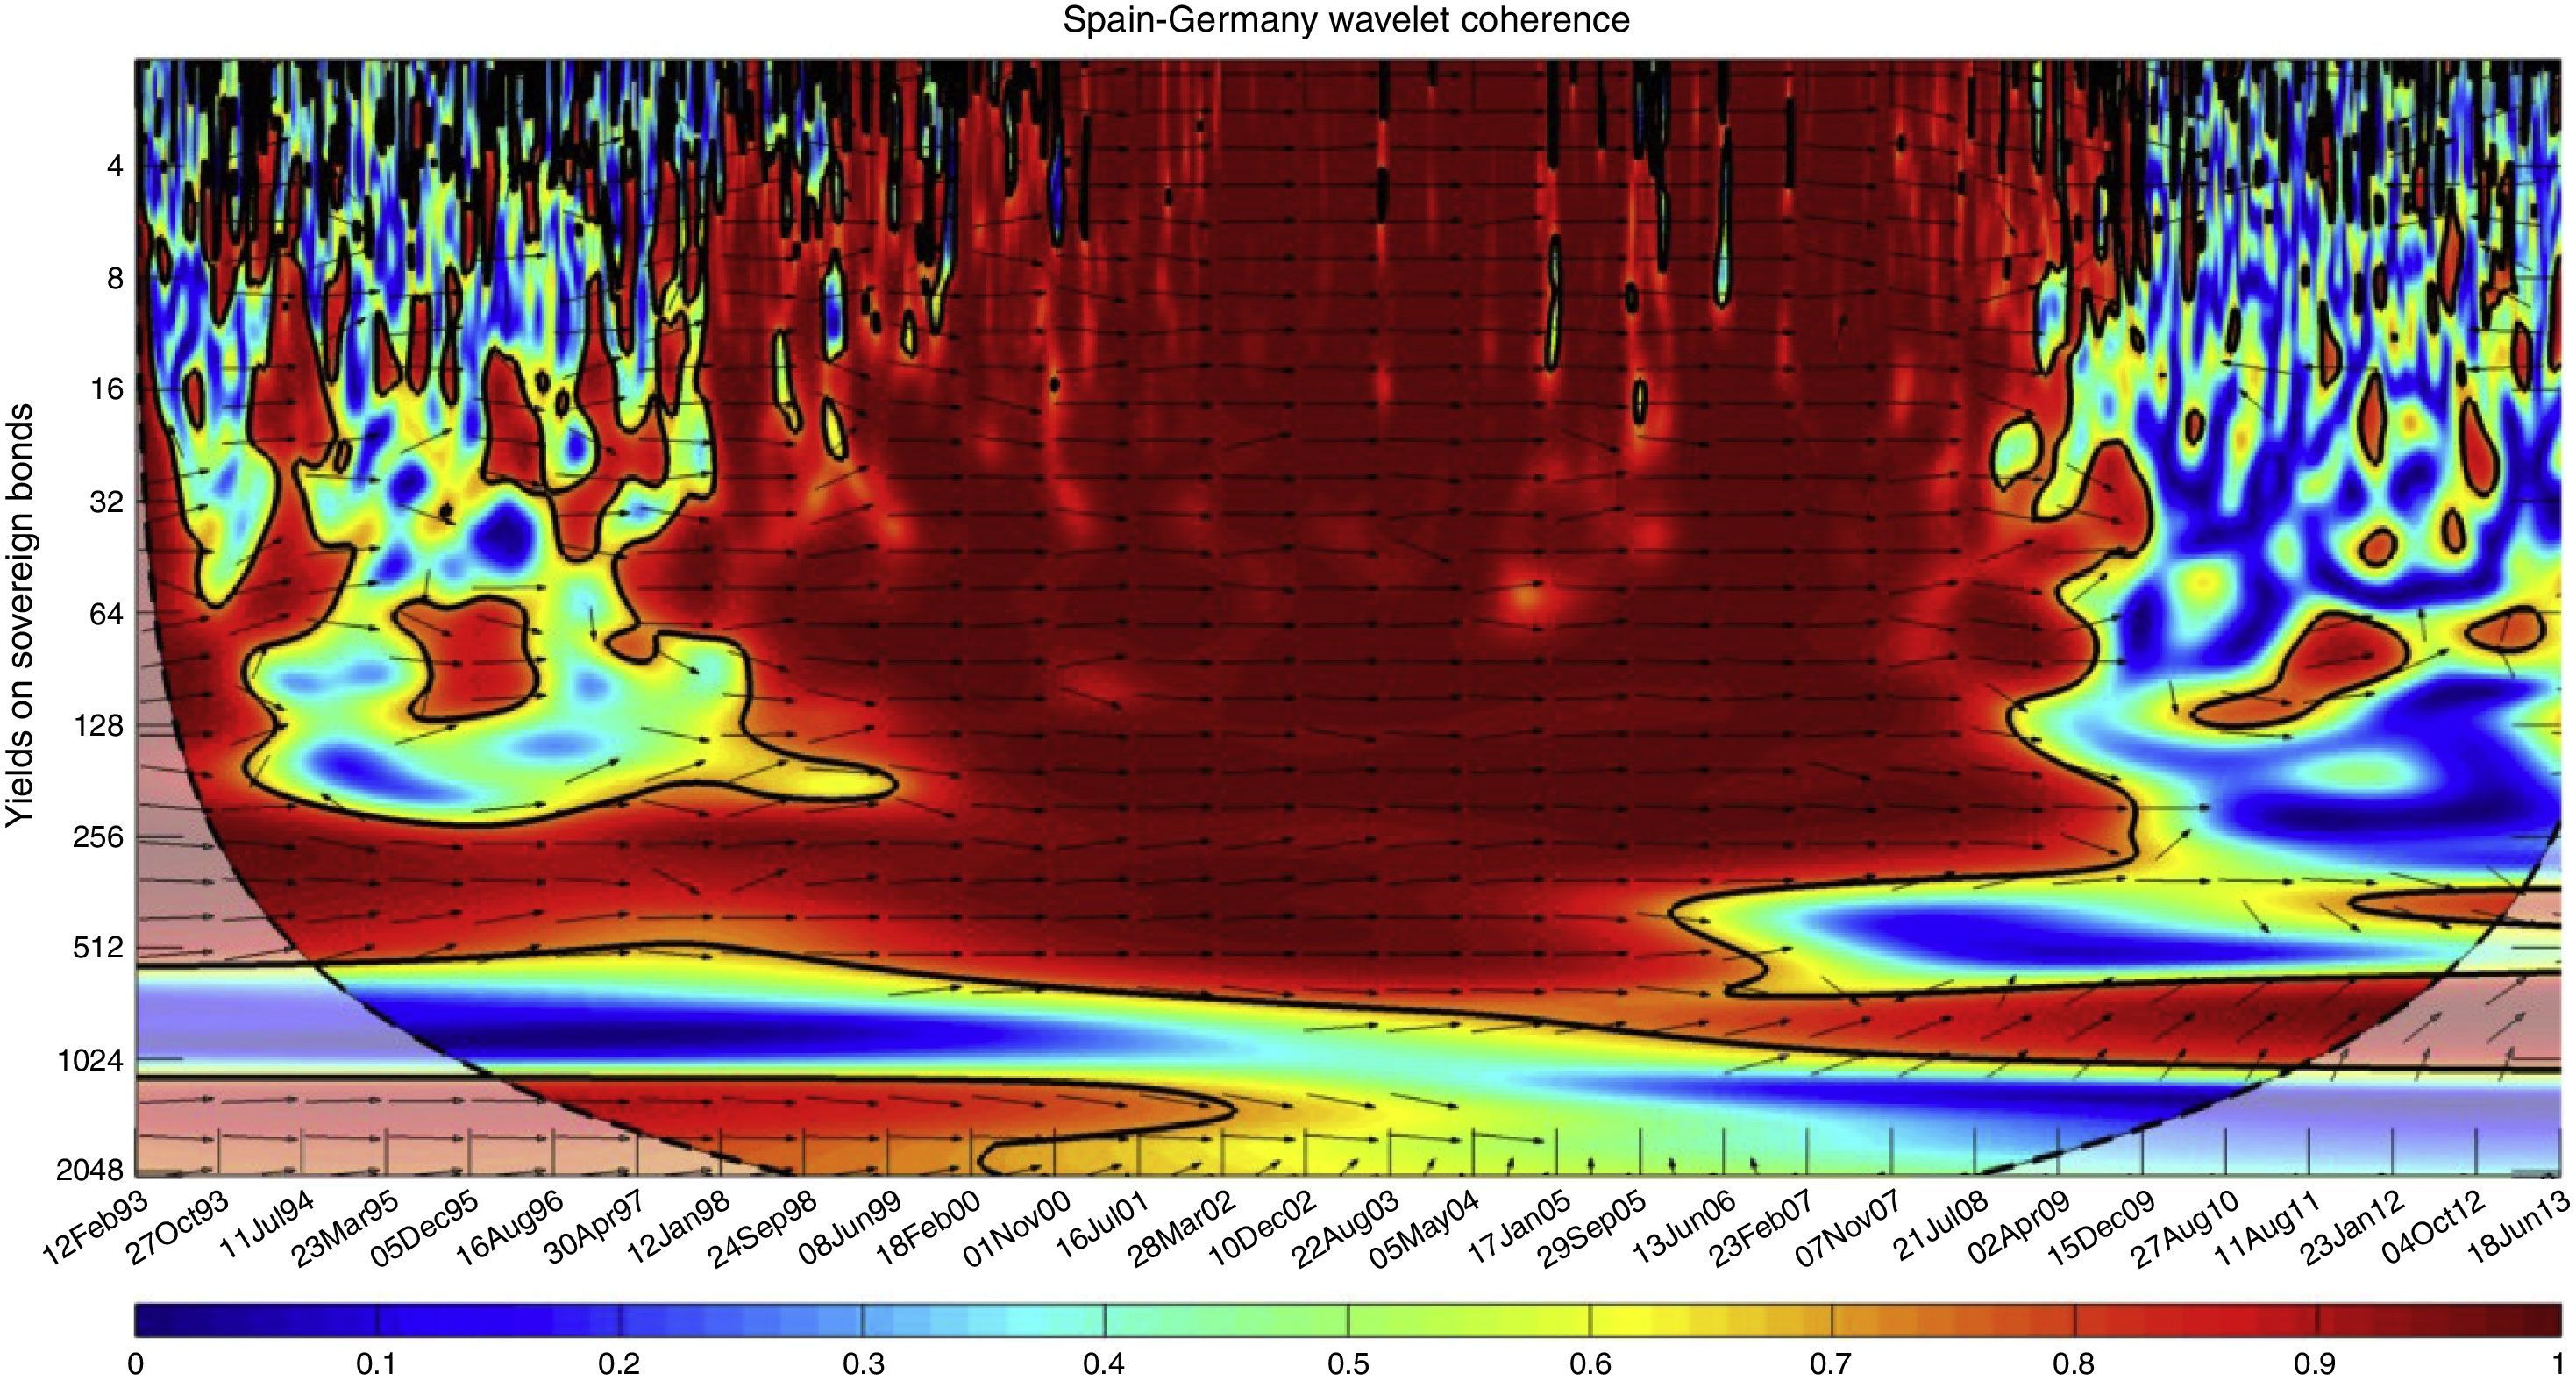
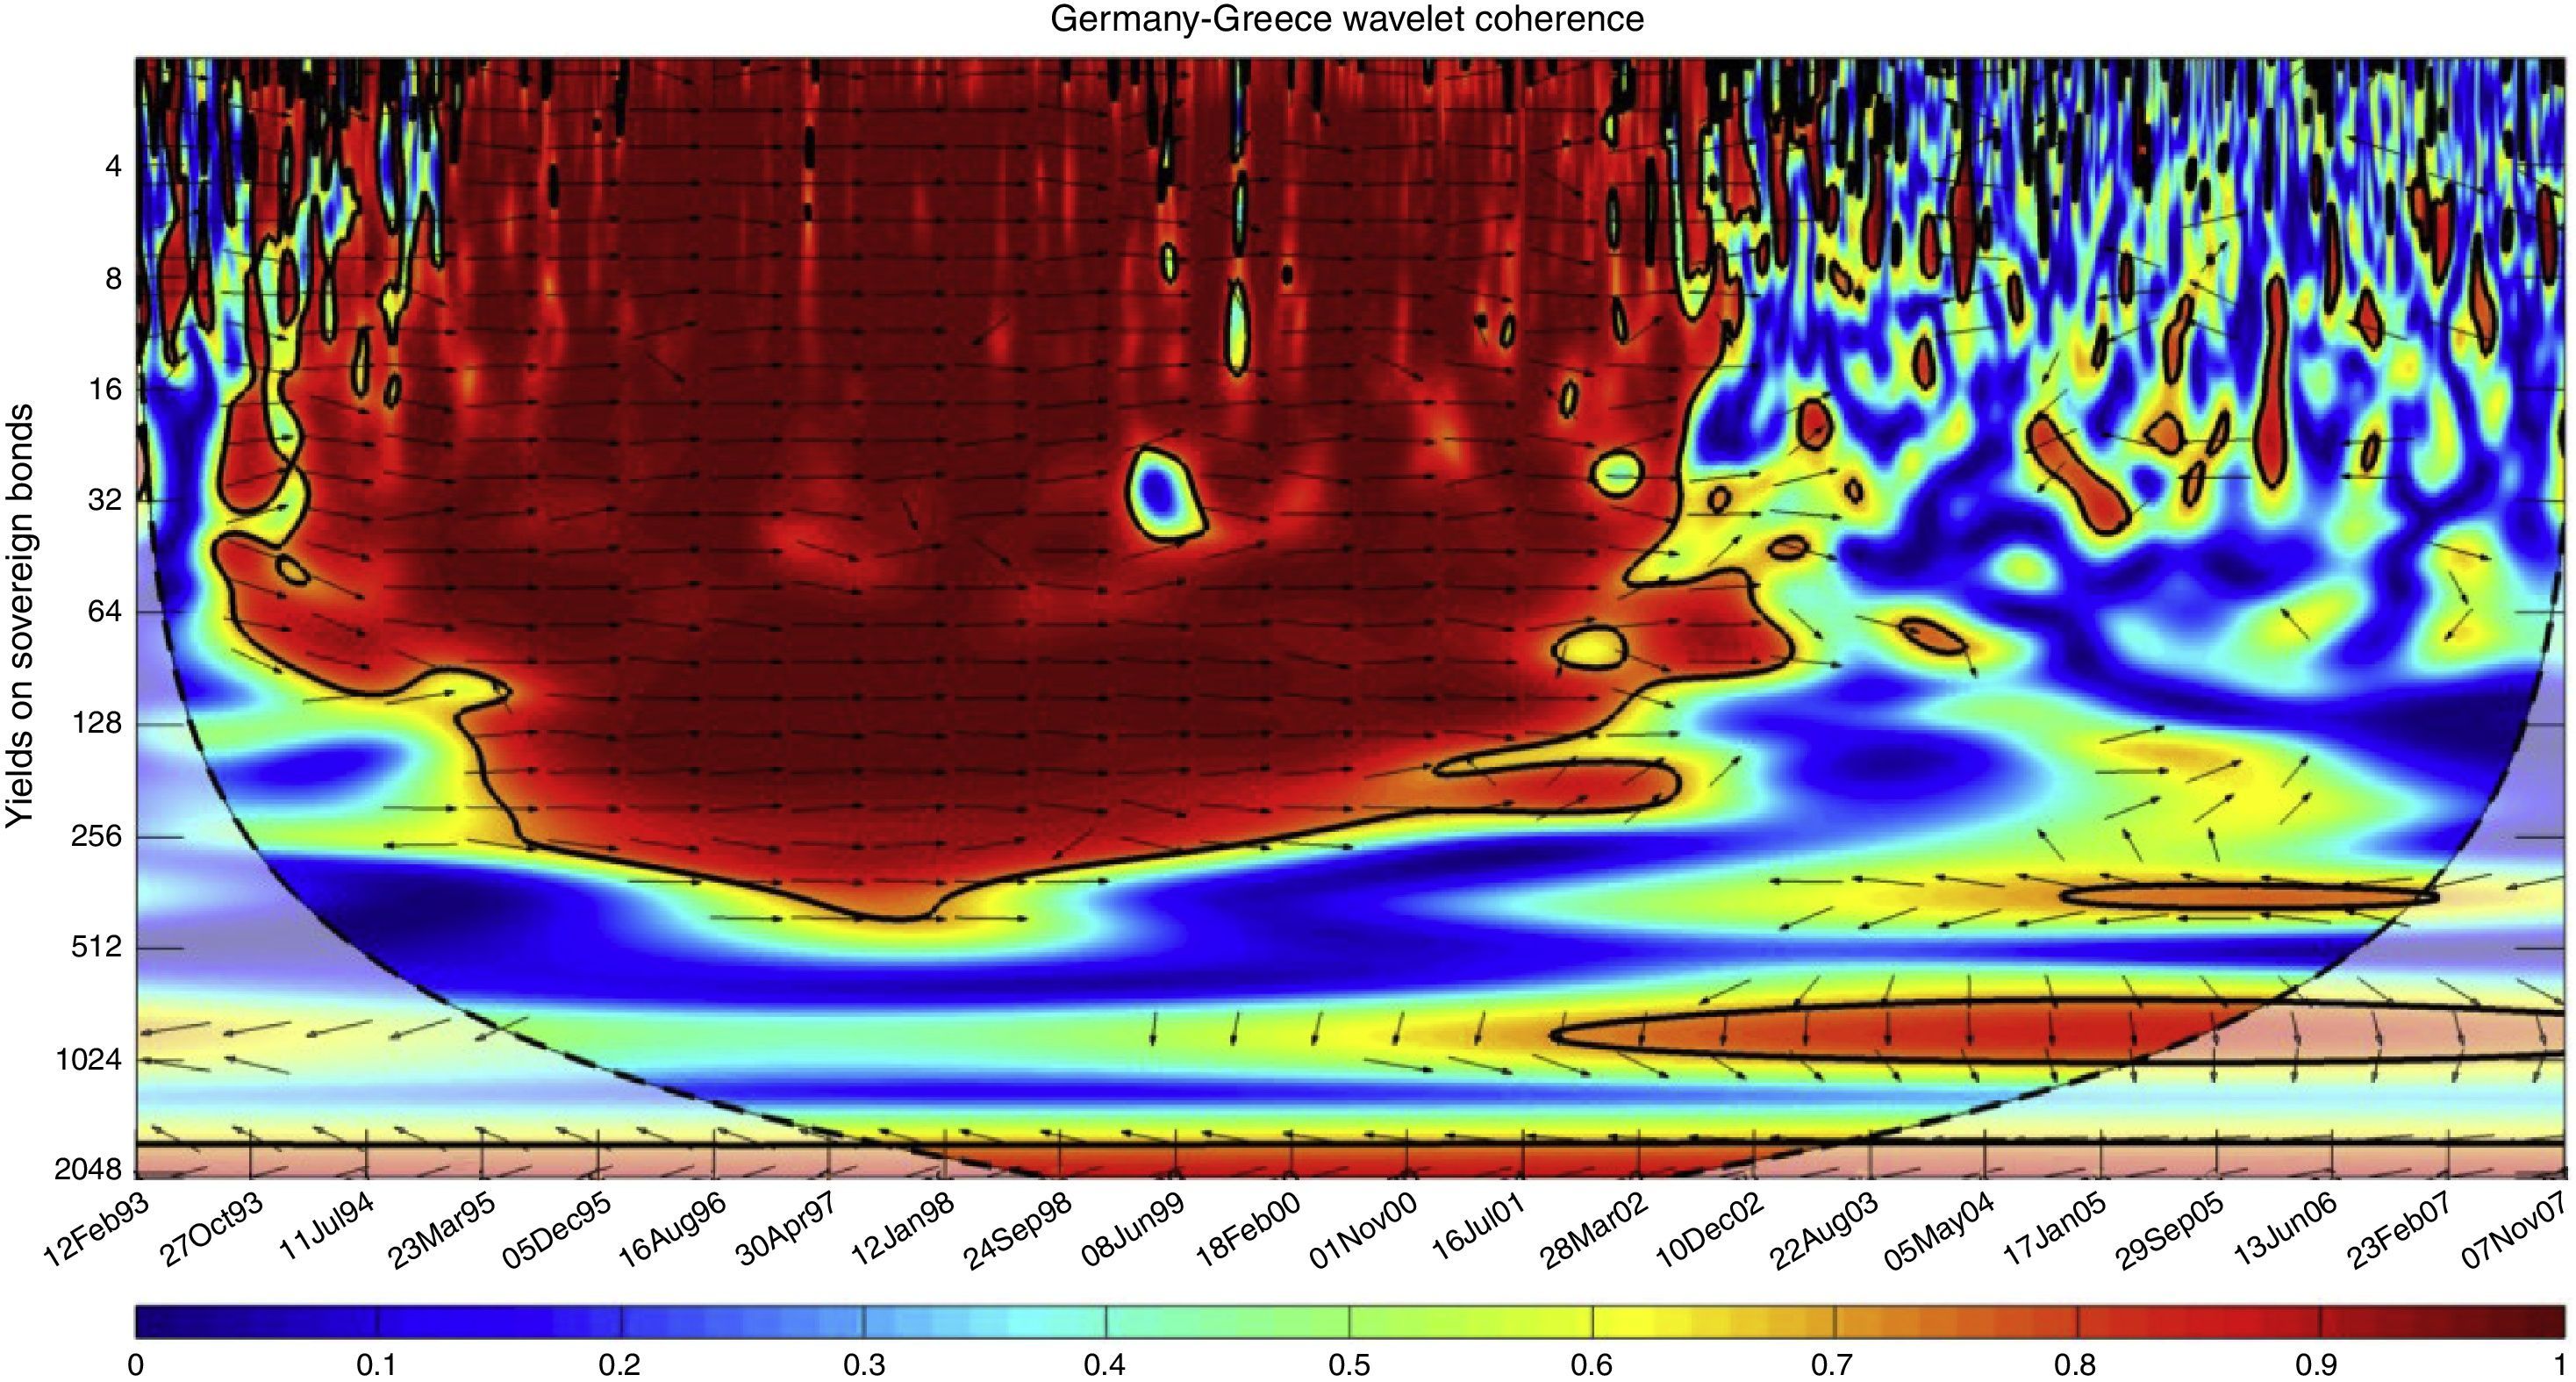
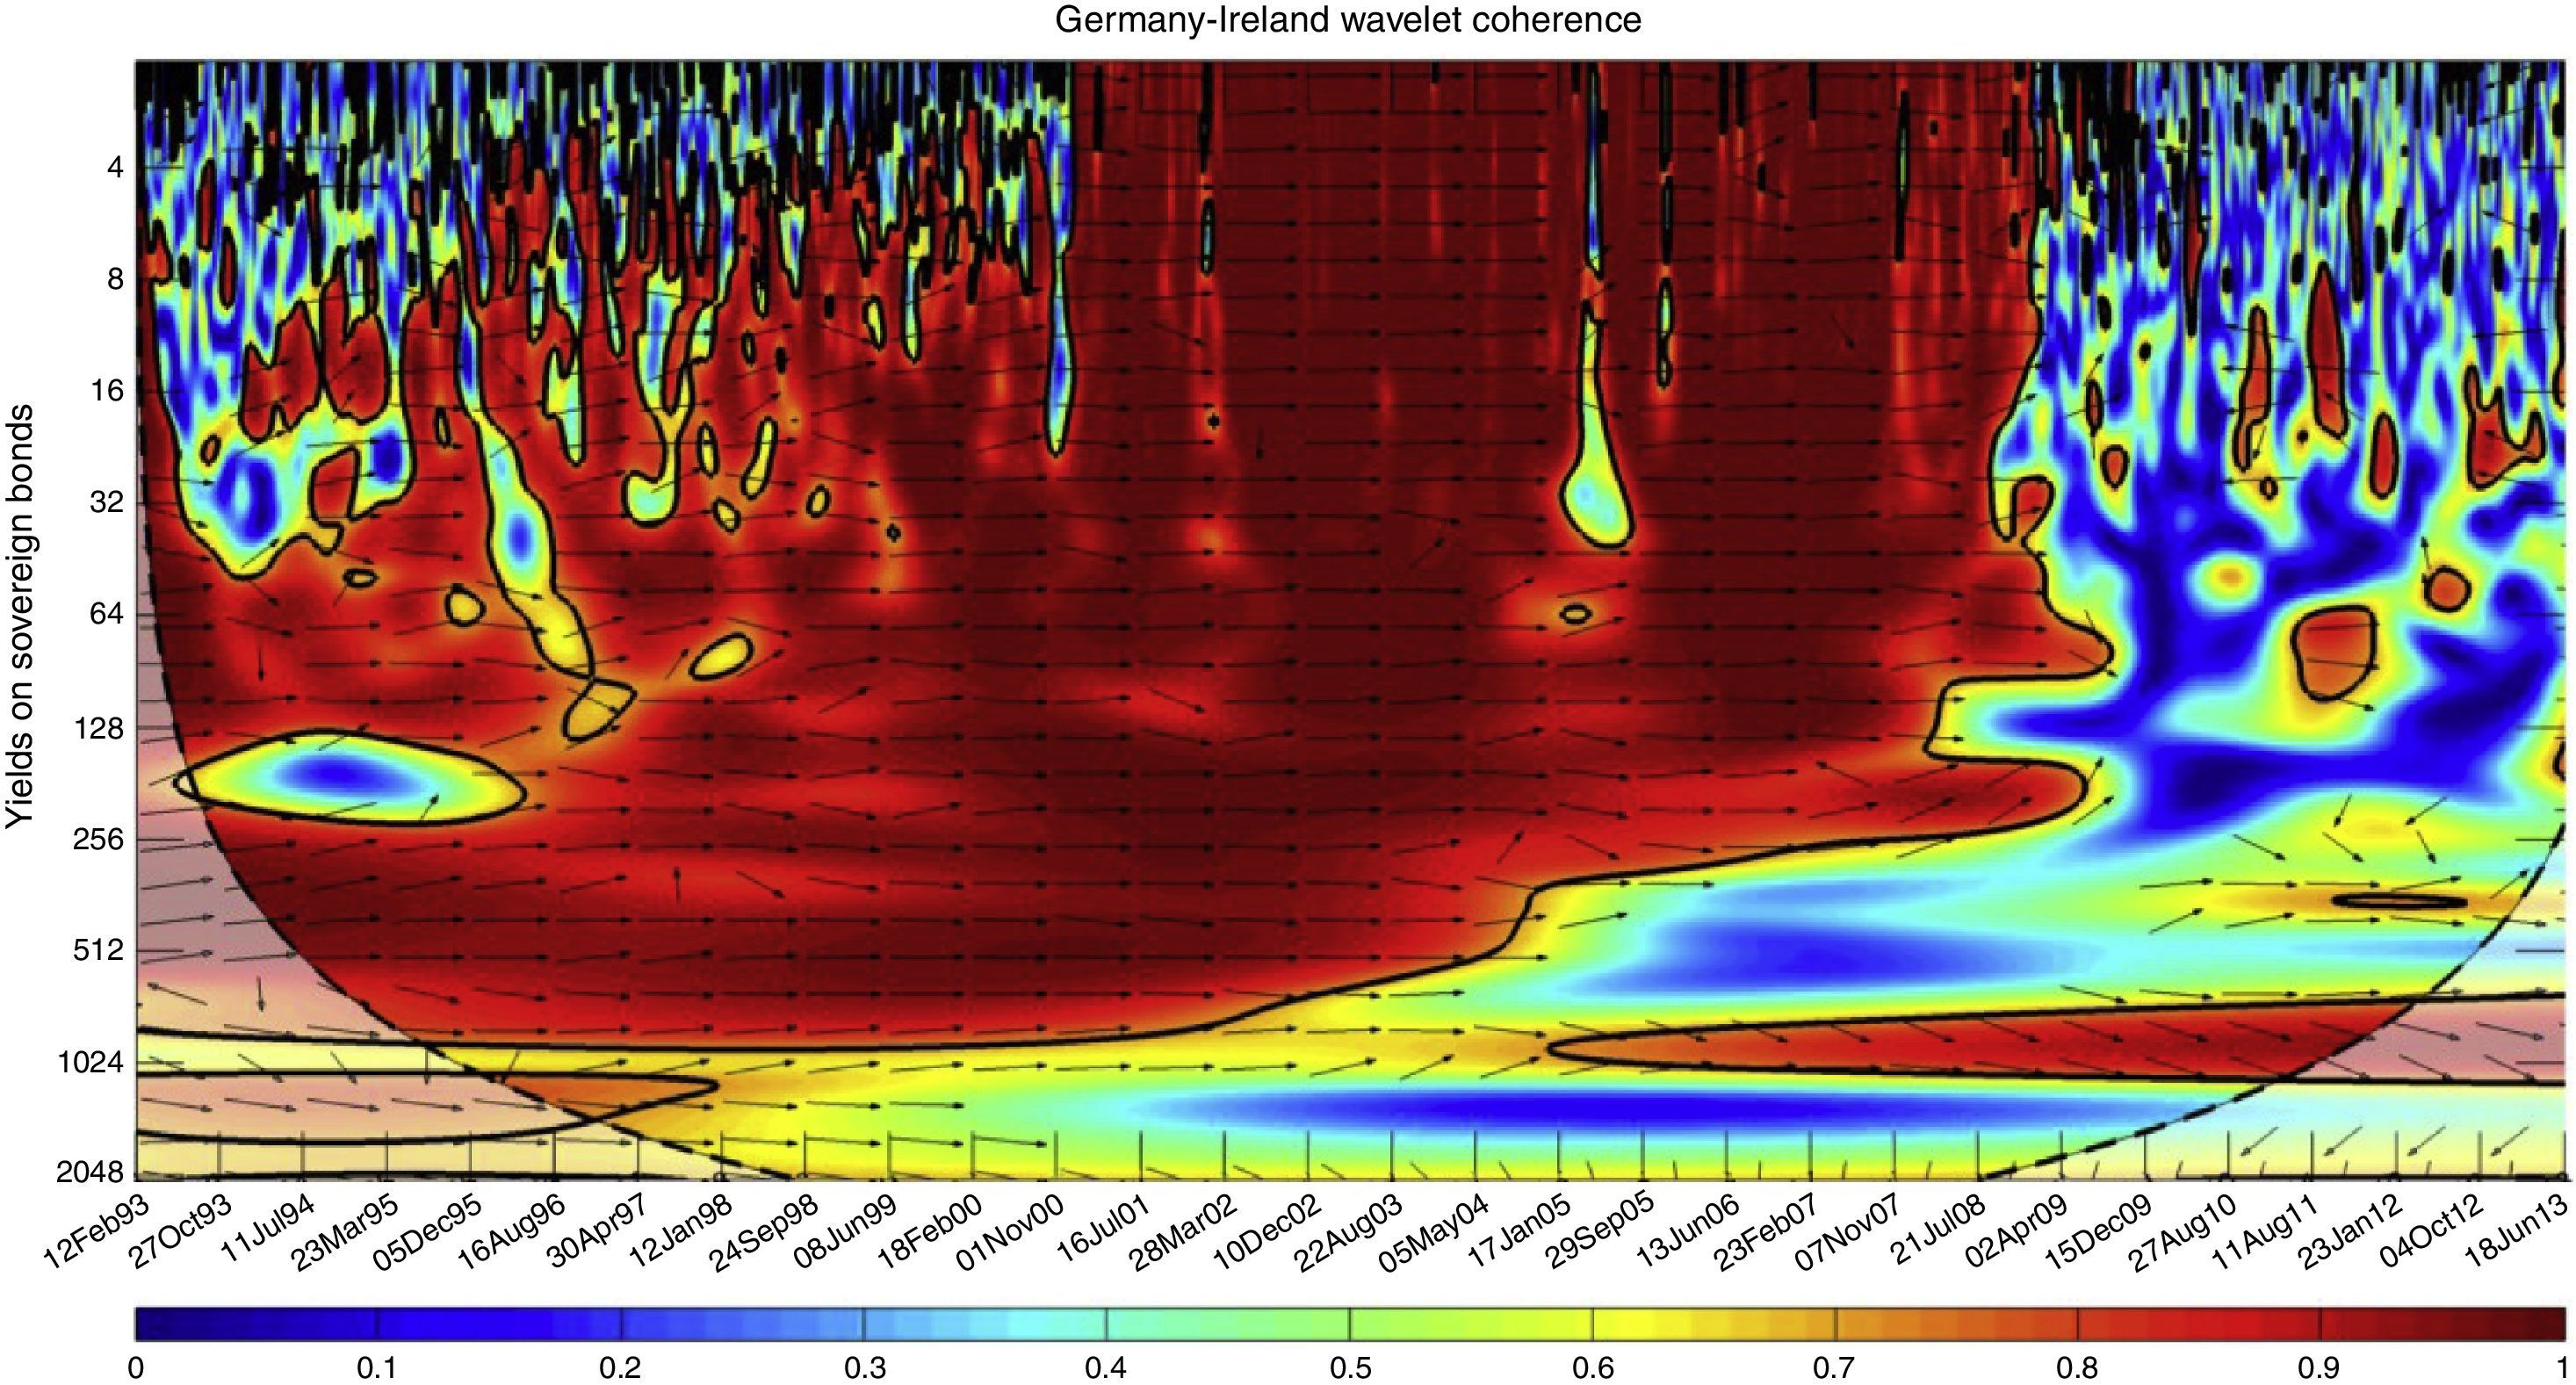
Wavelet power coherence (WPC) is a relative measure of the correlation between two signals. So is the normalized cross spectrum (Eq. (4)) of two signals in both power and phase. WPC is the normalized measurement of the cross-power spectrum, as expressed in:
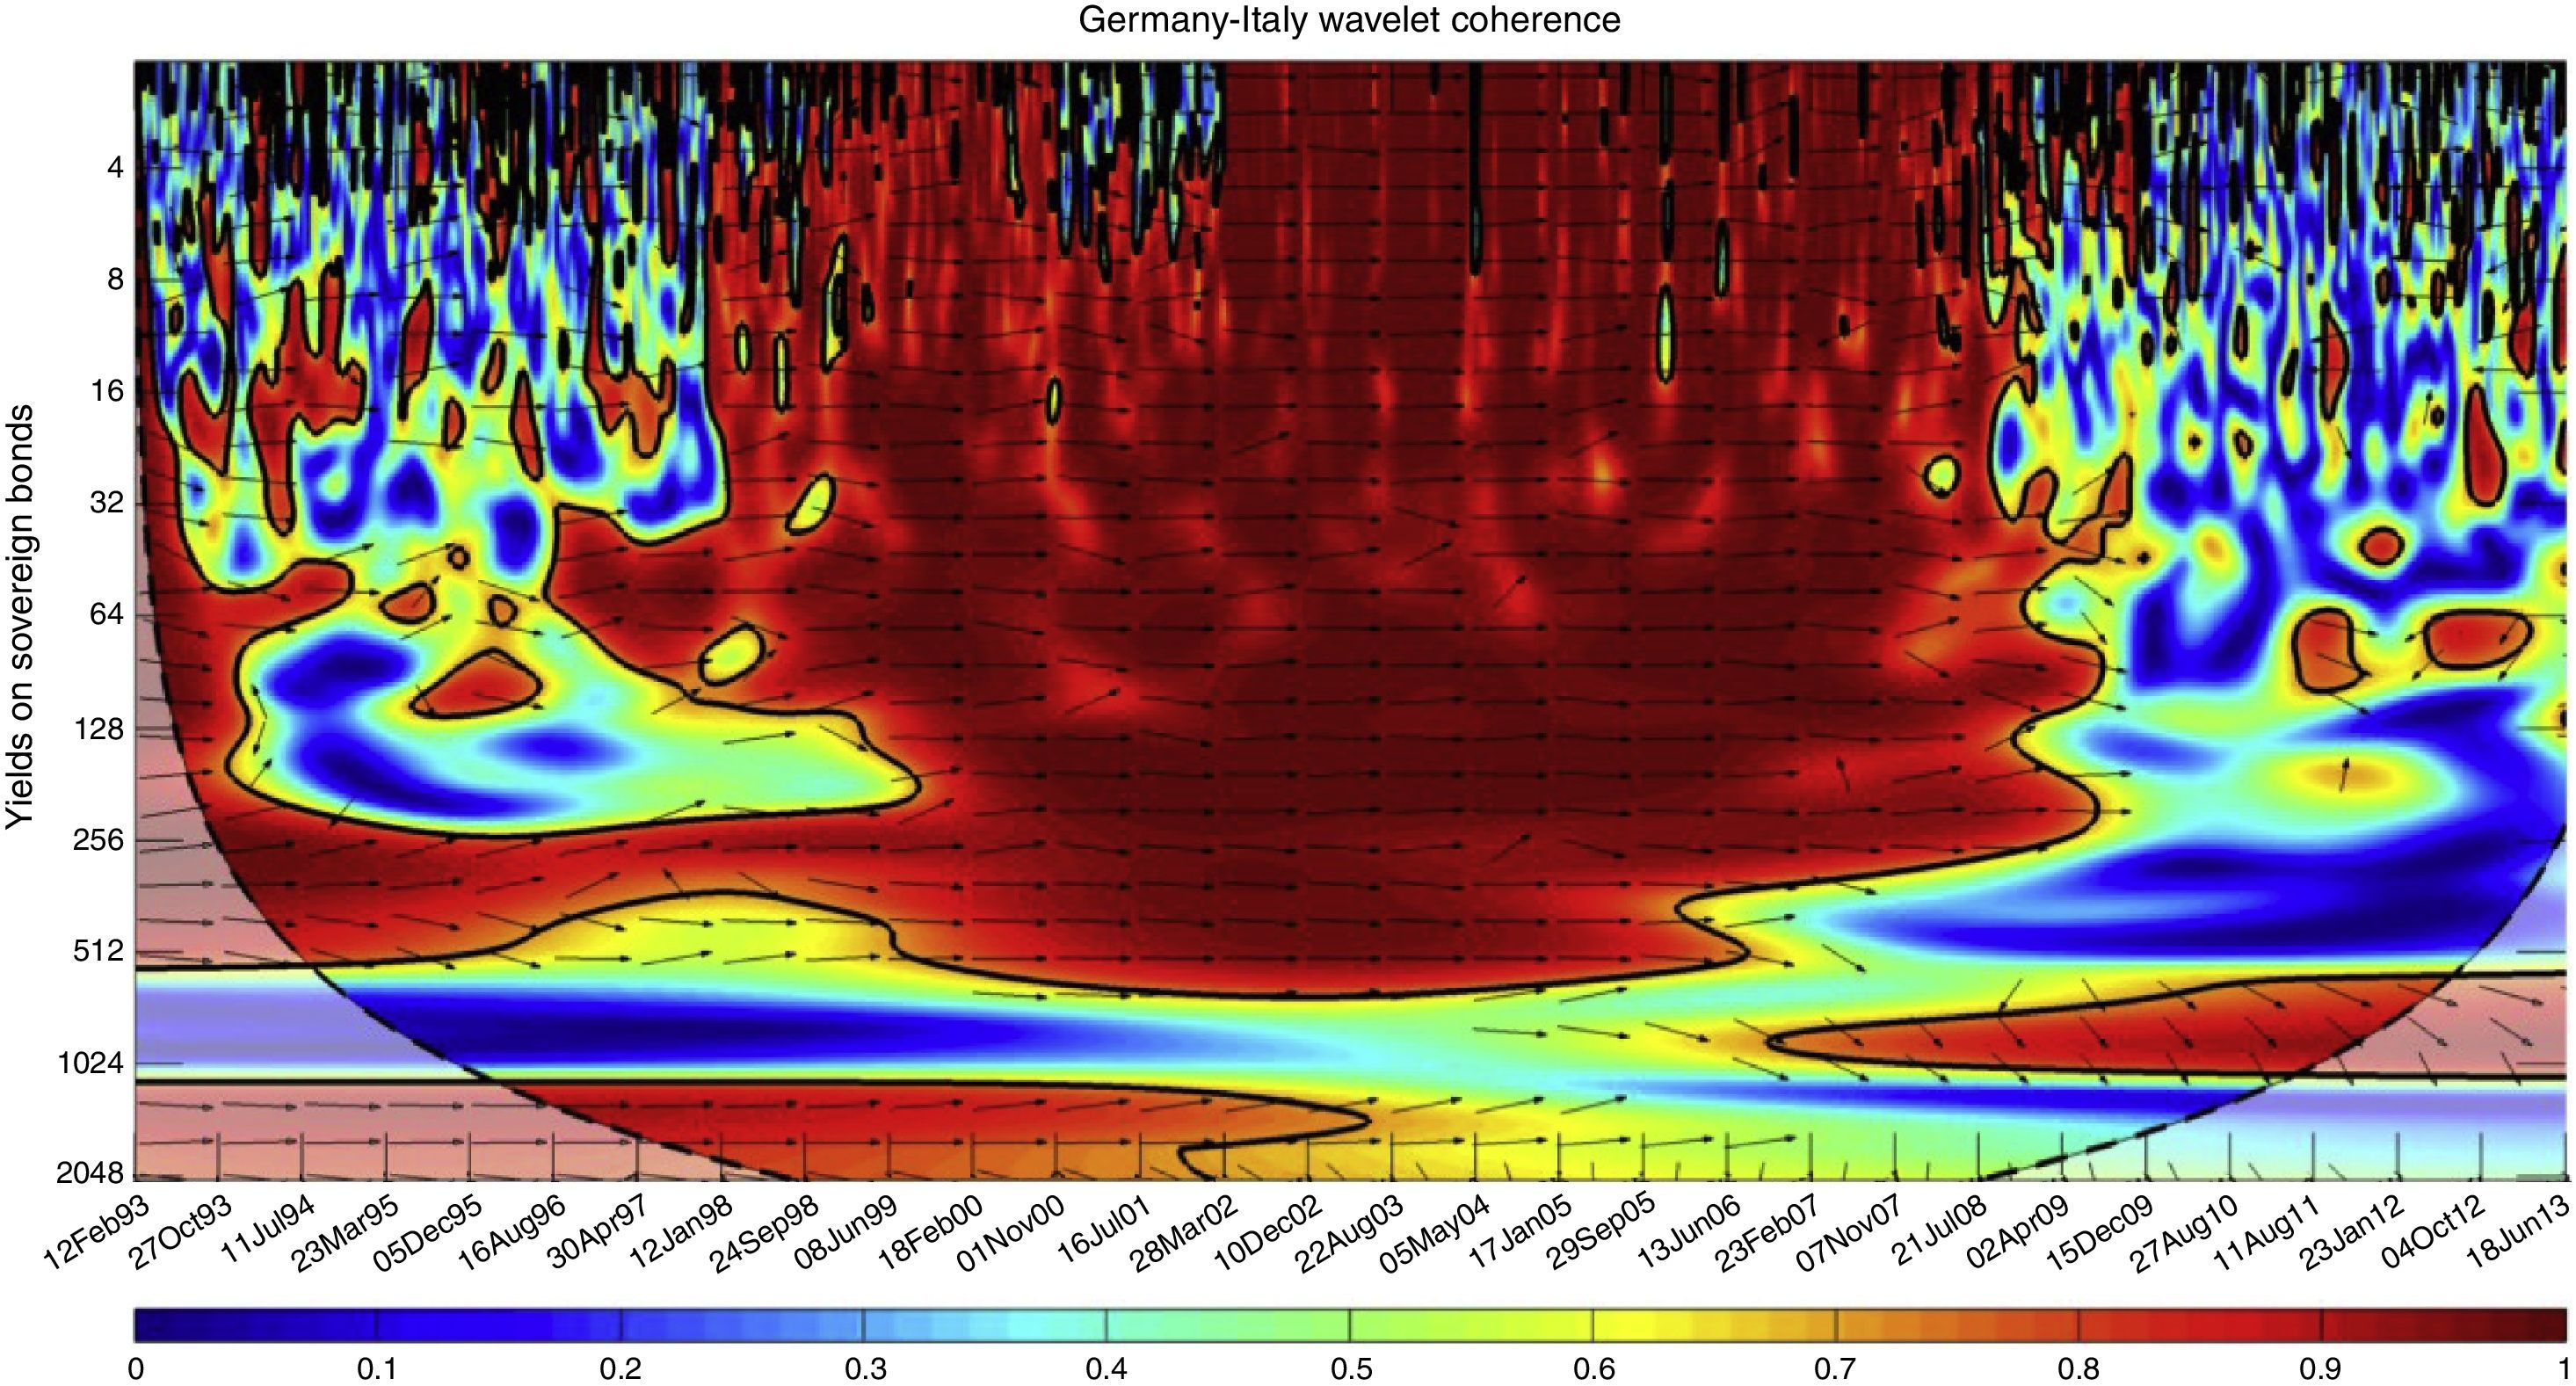
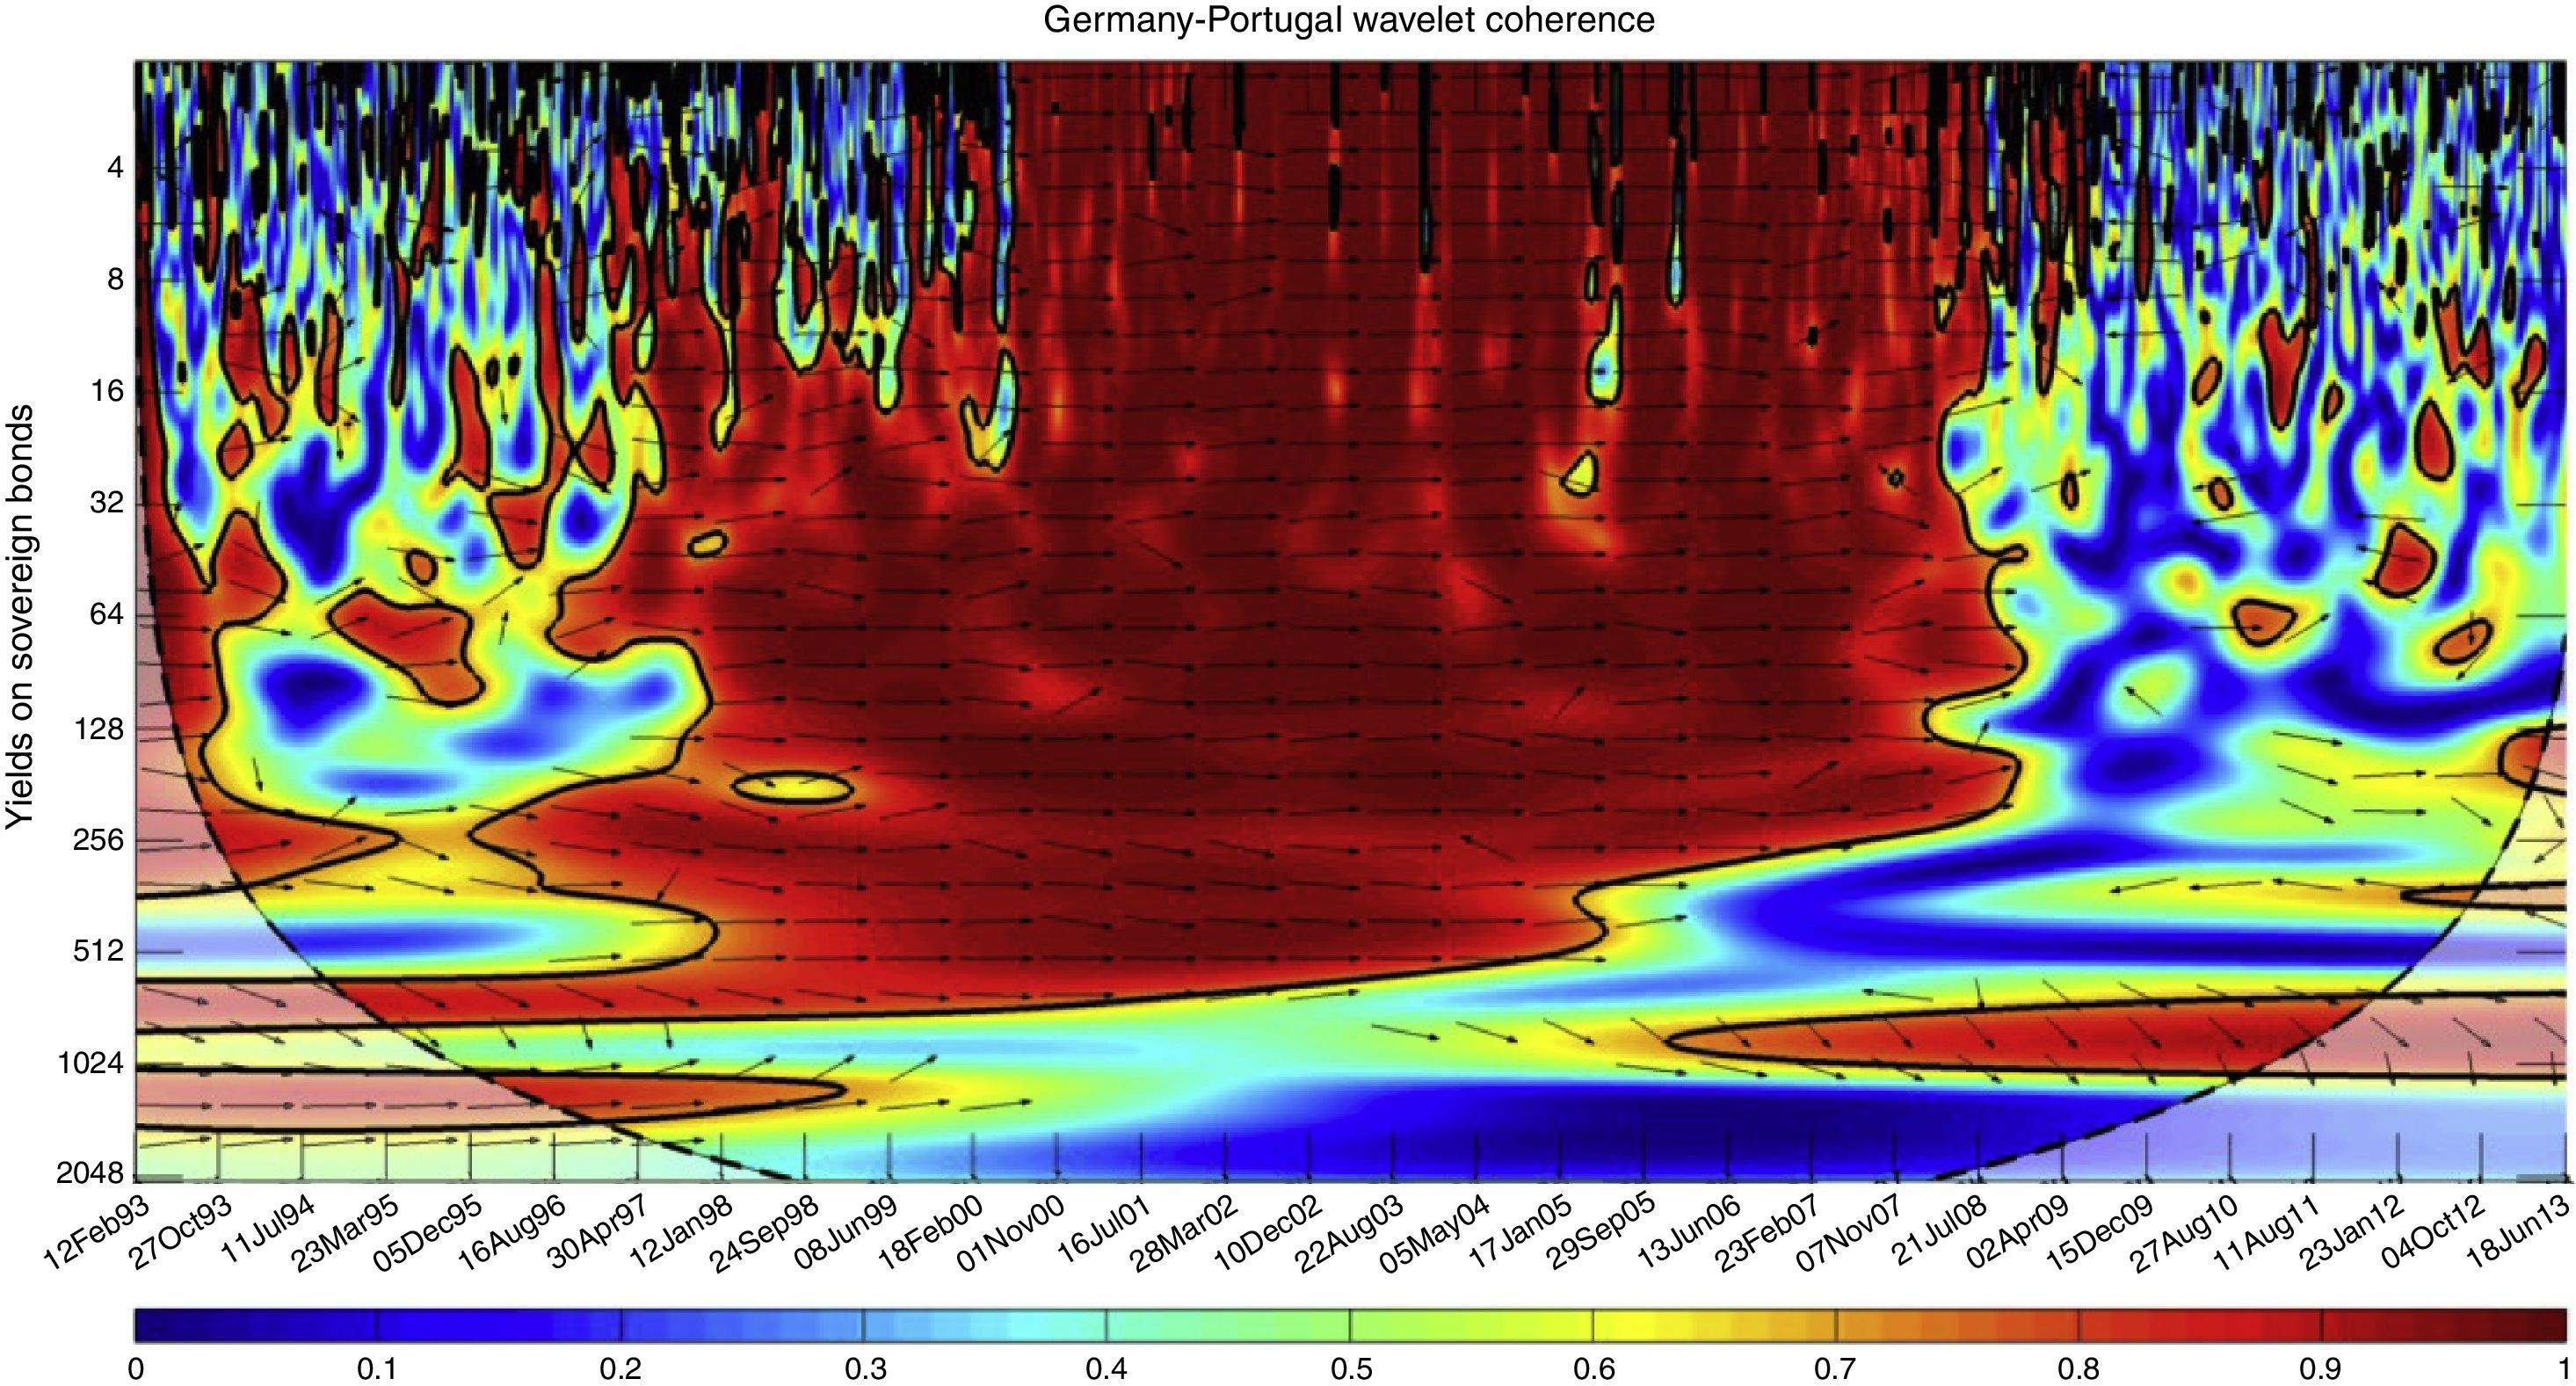
The coherence values range from 0 to 1 and reveal how much input and output series are correlated in terms of power and phase at a given frequency in a time instant. The WPC is useful for elucidating which of the multiple input signal sources represent the main contribution to the response signal. This contribution is shown in frequency and time bands. An example is Fig. 3 for the representation of the cross spectral power between two countries’ bonds.
. The bottom axis is time. Curved lines on either side indicate the COI. The spectral strength spreads out from weak values (blue) to strong ones (dark red) for high coherence. (For interpretation of the references to color in this figure legend, the reader is referred to the web version of the article.)")
Coherence spectrum obtained through the Normalized Cross Wavelet Spectrum of sovereign bonds time series in Spain and Germany. The 5% of significance levels are plotted with black thick line. The left axis is the wavelet scale (h). The bottom axis is time. Curved lines on either side indicate the COI. The spectral strength spreads out from weak values (blue) to strong ones (dark red) for high coherence. (For interpretation of the references to color in this figure legend, the reader is referred to the web version of the article.)
Shannon (1948) put forward the concept of information entropy firstly; he put the entropy as the uncertainty of a random event or the amount of information. The entropy is the measure of the degree of disorder of the signal. A low value of entropy can reveal useful information about certain underlying dynamical processes or events associated with the signal. In spectral analysis, a very ordered process is represented by a very clear and highlighted band. The wavelet power distribution of a disordered signal will be almost zero except in the wavelet resolution level.
Since wavelet analysis has good ability of time-frequency localization, the combination of multi-resolution wavelet and information entropy leads to wavelet entropy definition of a signal. A time series generated by a random process will represent a disordered behavior and will have a flat power representation for all frequency bands. Consequently the entropy will take high values for all frequencies. Nevertheless, time series of economic data are not completely disordered or ordered. Wavelet entropy (WE) can help in providing a procedure to detect frequency bands with low entropy, i.e. an ordered behavior and consistent periodicity. Shannon (1948) gives a useful criterion for analyzing the entropy and estimating a probability distribution. The total wavelet entropy based on normalized Shannon entropy at scale j, in a moving data window, is estimated by the detail coefficients at each time, as is showed in Eq. (7):
where w is the window length of the moving window in the fundamental frequency of the original signal.3Data analysis3.1Time series analysis in the time domain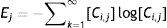
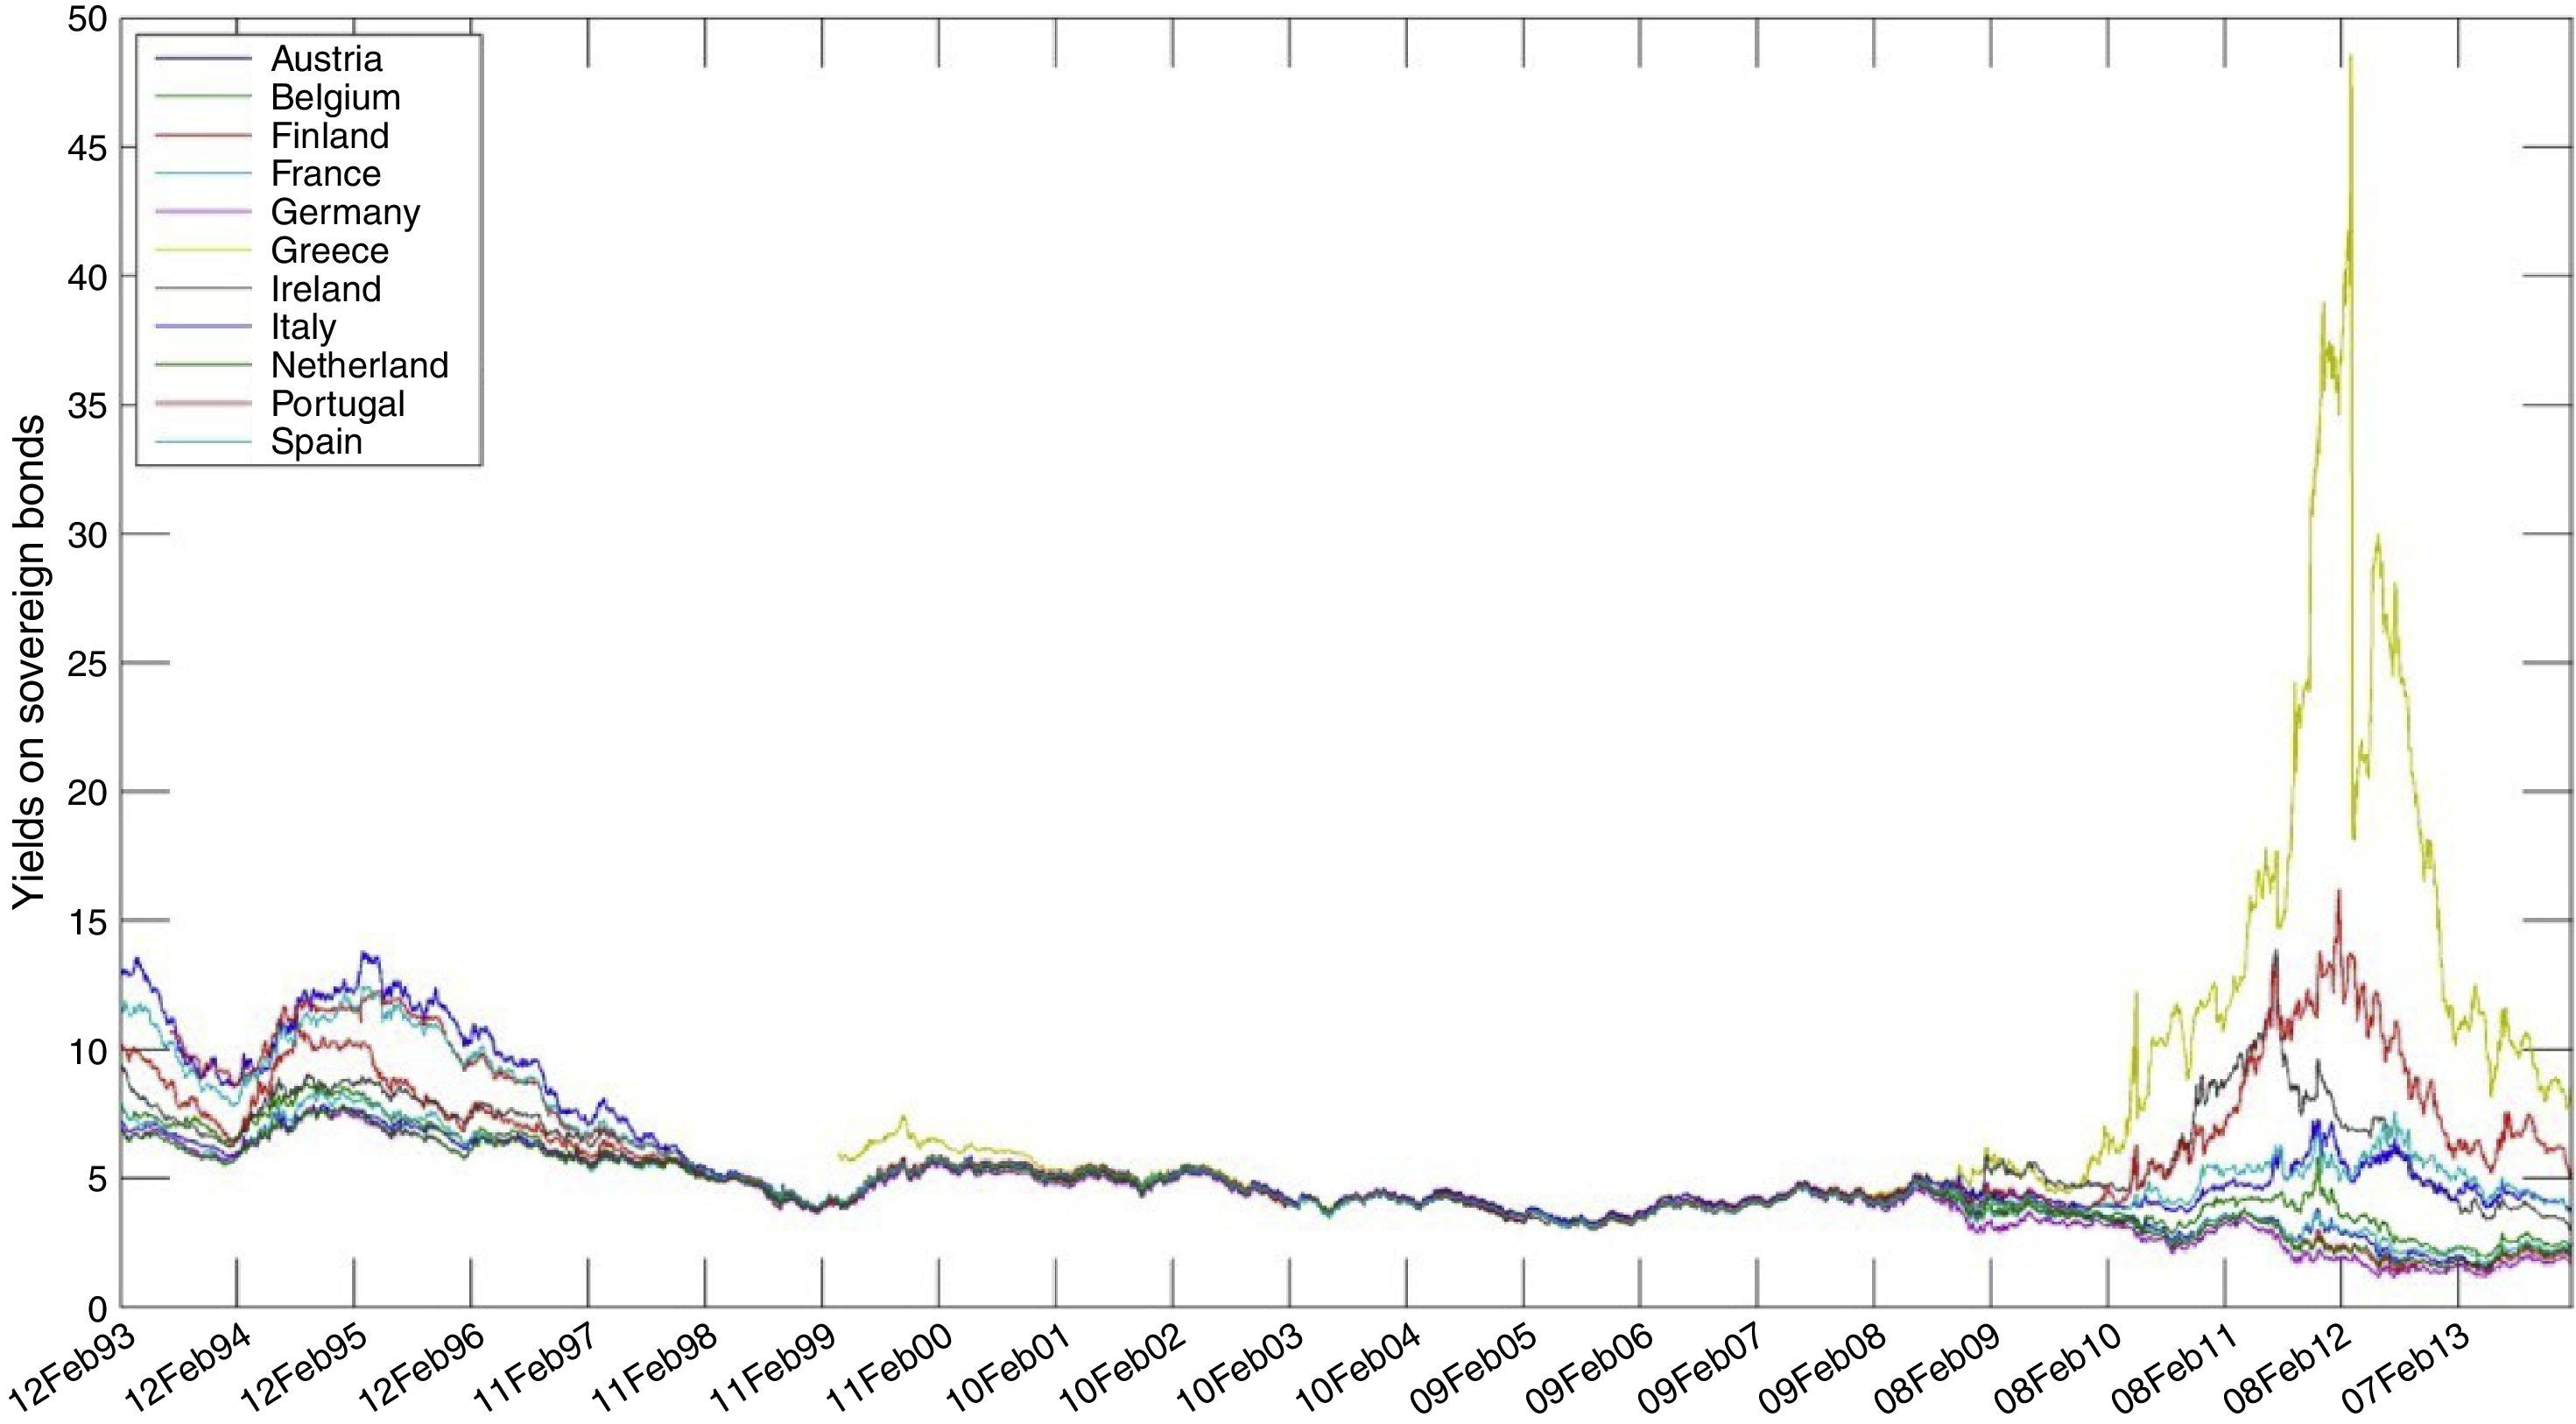
Time series are constituted by the values of sovereign bonds from 11 countries of the Euro area, with daily sampling except non-working days (Fig. 1). To ensure continuity in the time series, it has been assumed that the values remain constant during non-working days. The time series ranges cover from 12/02/1993 to 27/01/2014 for Austria, Belgium, Finland, France, Germany, Ireland, Italy, Netherland and Spain; from 15/07/1993 for Portugal; and from 31/03/1999 for Greece. Once obtained graphically the evolution in the time domain of the time series for each country, an initial assessment of a possible co-evolution of the prices of sovereign bonds can be observed.
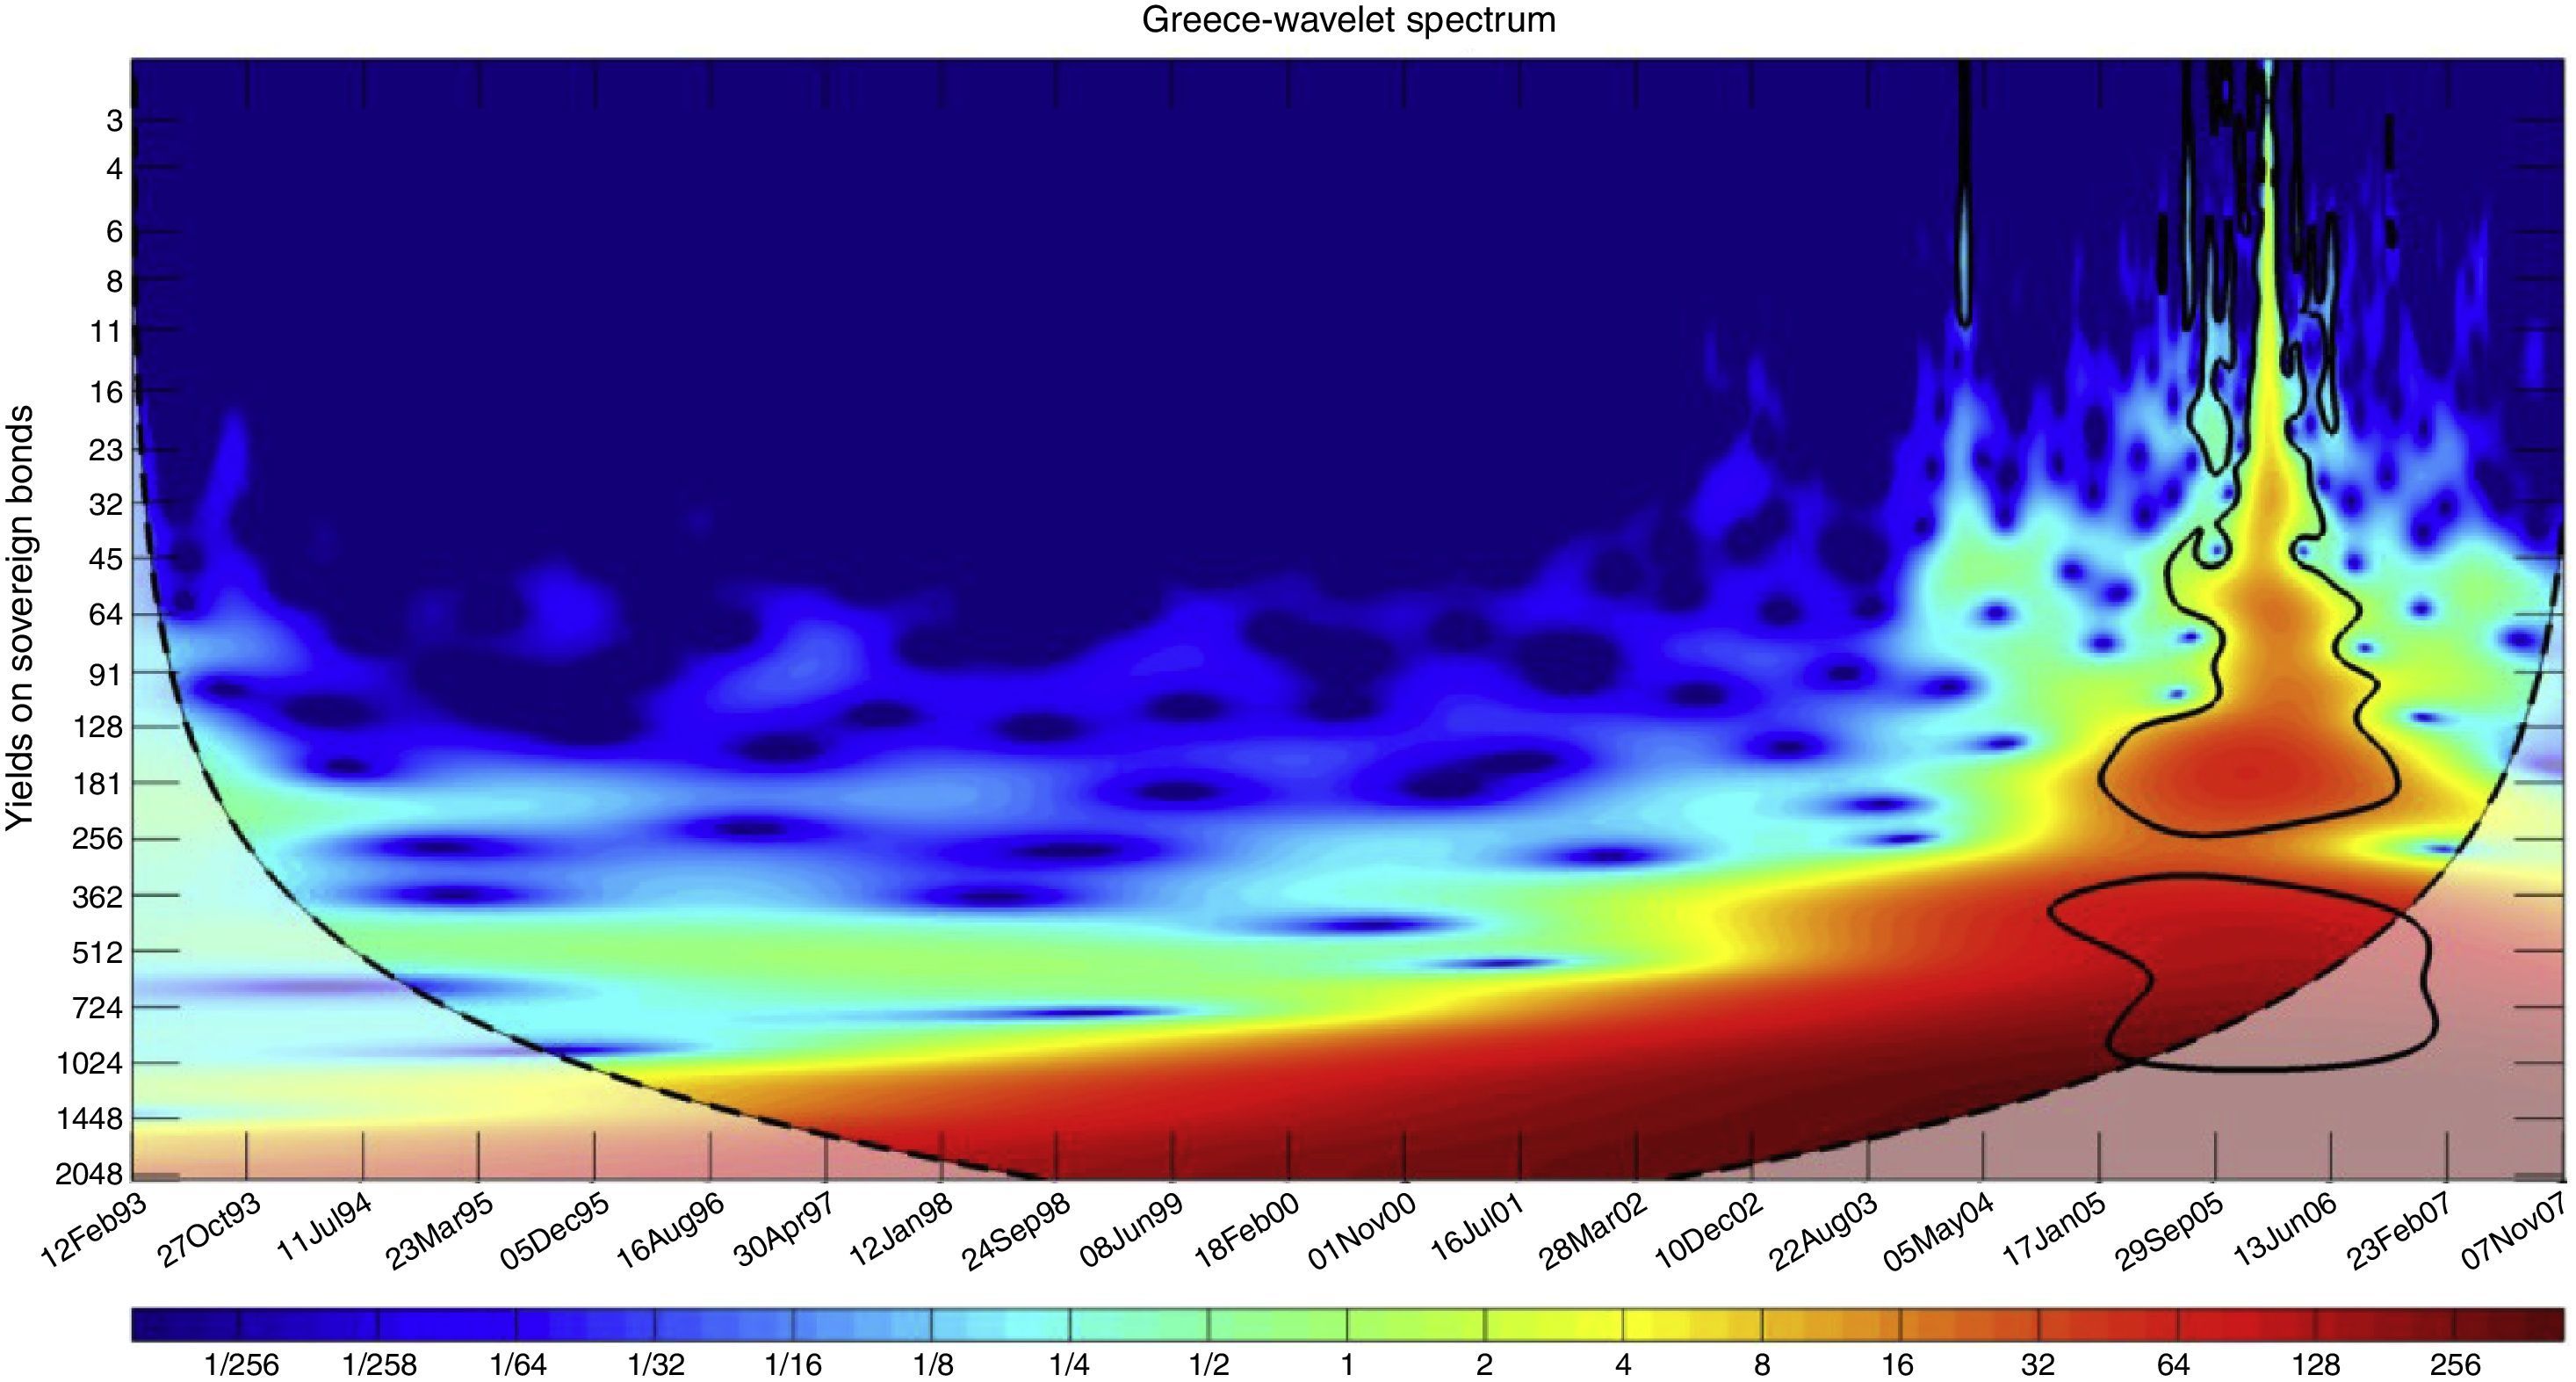
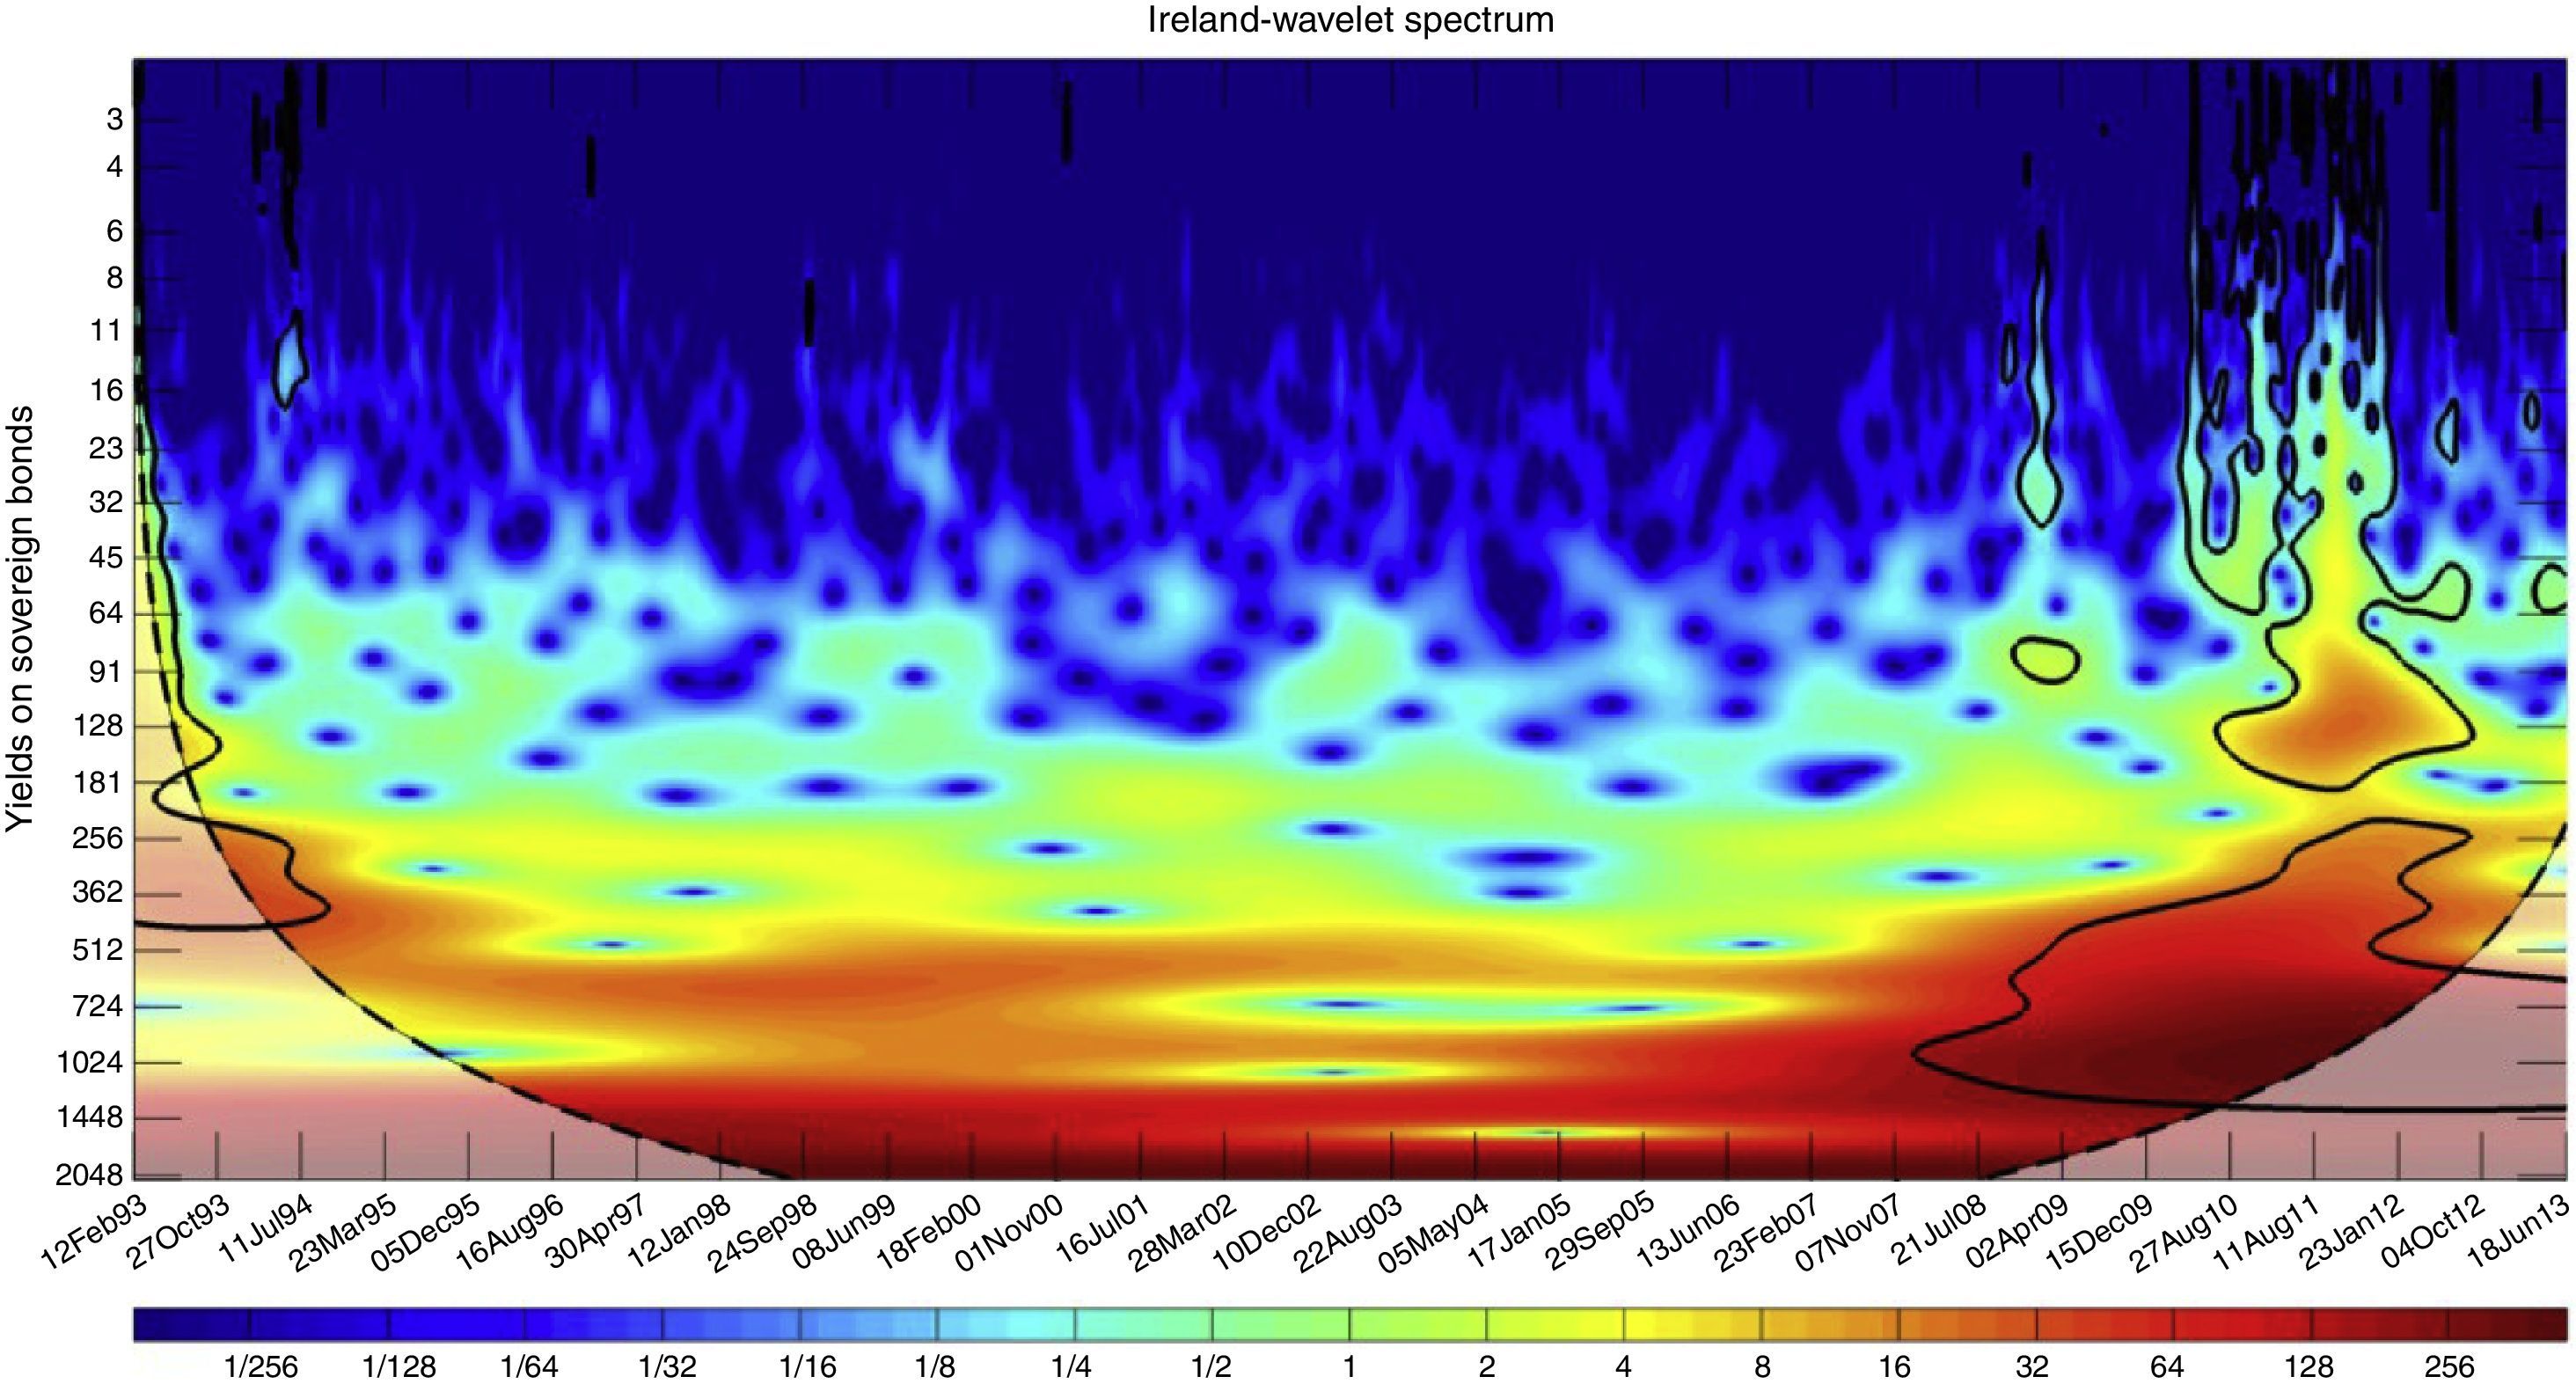
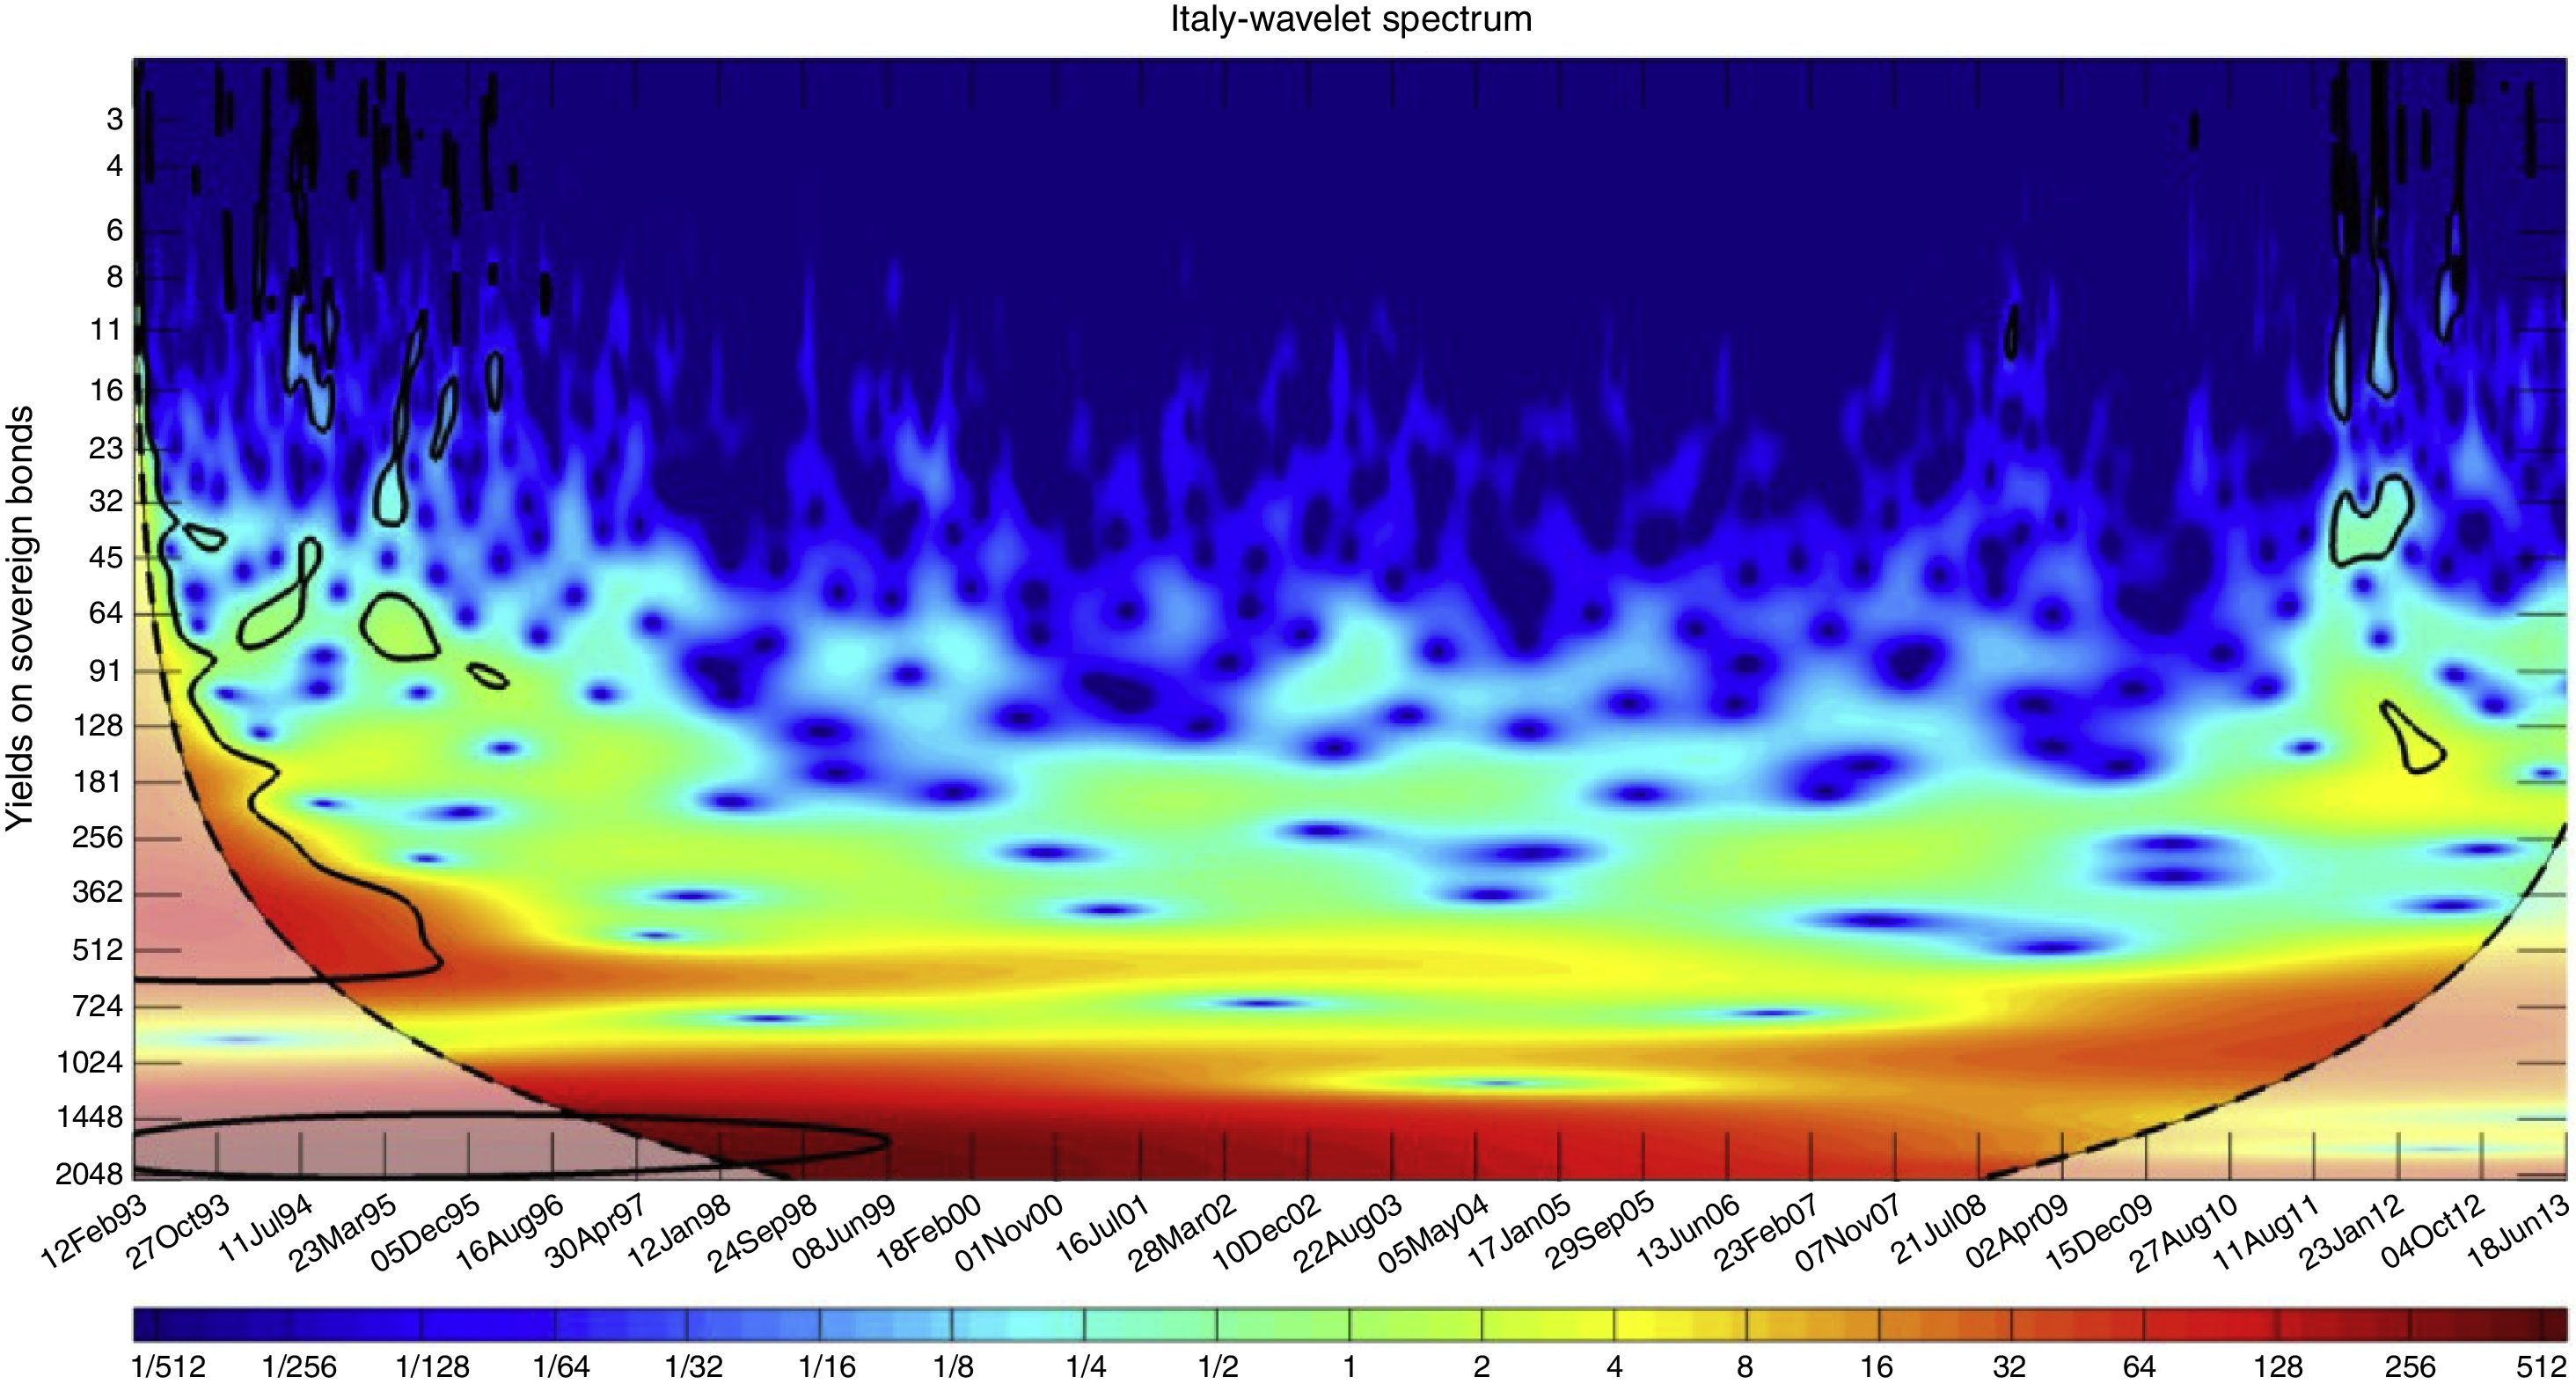
3.2Time series analysis in the frequency domainOne singular characteristic of wavelet analysis is the arbitrary choice of the wavelet function (in Fourier and in other transforms the basis function is fixed). But several factors should be considered in order to select a suitable wavelet to get best performance. Figs. 2 and A.1–A.5 depict the evolution of sovereign bonds in Germany, Greece, Ireland, Italy, Portugal, and Spain, respectively.
In order to help reveal the highlighted frequency bands in the spectrum, a wavelet entropy is applied (Eq. (7)). A very ordered time series should present a periodic mono-frequency signal (signal with a narrow band spectrum). In the sovereign bonds considered at a glance the wavelet representation is resolved in a few wavelet resolution levels, with wavelet power values near zero in high frequencies. Sometimes the graphic observation cannot be sufficiently clear. Colored frames are extended and interact both in the horizontal dimension (time) and vertical dimension (frequency), making blurred the bands power representation. Therefore, additional tools are needed to assist the graphical interpretation, dilucidate the periodicities and confirm the clustering of frequency bands. In order to disclose possible hidden information, a restricted focus on high frequency area of spectrum is performed (4). So, a new power spectrum values in some bands appear, although yet with blurred dispersion that could be confusing a prima face observer. In order to precise the existence of frequency bands, the graphical observation is supported by analysis of wavelet entropy (WE). The left side of Fig. 4 is the wavelet power spectrum in high frequencies of Ireland sovereign bonds. Right side is the entropy representation of the wavelet coefficients by frequency bands. Peaks of low entropy are an indicator of a highlight band. This is applied in this restricted area and depicted in Fig. 4.

Now, for this example, two bands of low entropy indicate a high order levels in the probability distribution for these bands. The most notable is between 14 and 16 frequency band which is showing a weekly period. In the same way, we can note about 30-days period to exist and also, another peak of low entropy can be noted between 45 and 50 band. Therefore, the signal follows some possible important three events with these periodicities.
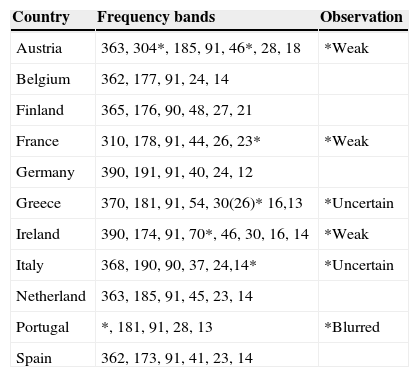
A detailed wavelet spectral analysis was performed on each country making a progressive focus on different areas of the spectrum, starting from the lowest frequency band (long period) to the lowest frequency. The results are presented in Table 1 with the help of entropy analysis to clarify the peak of frequency or central value of frequency in each band (Eq. (7)).
Frequency bands detected in all countries analyzed by wavelet spectrum.
| Country | Frequency bands | Observation |
|---|---|---|
| Austria | 363, 304*, 185, 91, 46*, 28, 18 | *Weak |
| Belgium | 362, 177, 91, 24, 14 | |
| Finland | 365, 176, 90, 48, 27, 21 | |
| France | 310, 178, 91, 44, 26, 23* | *Weak |
| Germany | 390, 191, 91, 40, 24, 12 | |
| Greece | 370, 181, 91, 54, 30(26)* 16,13 | *Uncertain |
| Ireland | 390, 174, 91, 70*, 46, 30, 16, 14 | *Weak |
| Italy | 368, 190, 90, 37, 24,14* | *Uncertain |
| Netherland | 363, 185, 91, 45, 23, 14 | |
| Portugal | *, 181, 91, 28, 13 | *Blurred |
| Spain | 362, 173, 91, 41, 23, 14 |
Very similar frequency components are observed in all countries. It is noteworthy to show the annual and semiannual values. But the observer can be especially struck by the very precise quarterly value that happens in all countries. Also, at high frequencies periods around 45 days, 3 weeks and 2 weeks usually appear.
3.3Cross wavelet analysisCross wavelet analysis and wavelet coherence are powerful methods for testing proposed linkages between two time series. Therefore it would be suitable for the identification of comovement between two sovereign bonds time series.
Figs. 3, A.3, A.4, A.6, and A.7 depict the correlation in terms of coherence between the sovereign bond in Germany and with one in Spain, Greece, Ireland, Italy and Portugal, respectively.
Fig. 3 shows the wavelet coherence between the German and Spanish bond yields, following Eq. (6). In each point of the frequency-time map, the coherence result is a value between 0 for dark blue color, and 1 for dark red color. A value of 1 for a given frequency band, indicates that the response energy is 100%, due to both signal enters in clear relationship. This suggests there are two behaviors of this bivariate set acting as a system: (a) A strong coherent behavior that happens when the system clearly reacts in a correlated mode or there is a clear relationship between both signals. The strong coherence between January 1998 and April 2009 indicates a co-movement of both signals. (b) A weak or non-coherent behavior that occurs before January 1998 and after April 2009 when both signals evolve independently.
4ConclusionThe use of wavelet transforms allowed to discover the main periodic features of the sovereign bonds of 11 countries in Europe. A detailed wavelet spectral analysis reveals on each country different frequency bands. Entropy provides the central value of frequency in each band. The result is that very similar frequency components are observed in all countries. In addition of annual and semiannual values, there is a very precise quarterly value that happens in all countries. Also, it is remarkable the frequencies periods around 45 days, 3-weeks and 2-weeks cycles.
In the detailed analysis of the possible co-evolution German versus Spanish sovereign bonds, a strong coherent behavior of signals is unveiled by the wavelet coherence analysis. The strong coherence between January 1998 and April 2009, shows the co-movement of both signals or the period when both sovereign bond yields are impacted by the same factors. The asynchronism, between both signals, due to low wavelet coherence, is observed before January 1998 and after April 2009 when likely different economic factors are independently involved. The methodology used in the example for Germany and Spain can be applied to analyze other couples of countries.
This appendix reflects the main graphic results obtained. Data processing was carried out by programming applications in Matlab language (MathWork Co.) and some routines coded in Java Language, which have been designed specifically for this purpose. Also, system identification library and wavelet functions provided by the Matlab package have been included to improve the algorithm performance (Figs. A.8 and A.9).


 of sovereign bond evolutions in Germany and Greece.")


