


The 1997 “Treu Act” reformed the Italian labor market “at the margin”. This paper studies the act's effects on the flows out from on-the-job-training contracts (including both “Contratti di Formazione Lavoro” and Apprenticeship Contracts) into a new labor market status after one year. Applying a multinomial logit model and Fairlie decomposition, our findings suggest that the Treu Reform has shifted firms’ hiring preferences by changing the returns of workers’ characteristics. Moreover, with some differences between “Contratti di Formazione Lavoro” and Apprenticeship Contracts, the Treu Reform involved a substitution between transitions into a permanent job and into a new on-the-job-training contract. Interestingly, following the introduction of the Treu Reform, workers need to accumulate more experience in Apprenticeship Contracts to achieve the same probability of future employment, which suggests that Italian firms value the flexibility characteristics of on-the-job-training contracts more than their training content. The underlying lesson we can draw is that in labor markets with a weak demand of skilled workers, policies aimed at promoting stable employment and avoiding precarious careers should consider the effectiveness of on-the-job training and monetary incentive levels.
En 1997, la “ley Treu” reformó el mercado laboral italiano “al margen”. En este documento se estudian los efectos de la ley sobre los flujos de los contratos de formación en el puesto de trabajo (tanto contratti di formazione lavoro como contratos de prácticas) en un nuevo estado de mercado laboral tras un año. Aplicando un modelo lógit multinomial y la descomposición de Fairlie, nuestros hallazgos indican que la reforma de Treu ha cambiado las preferencias de contratación de las empresas modificando las características de las ganancias de los trabajadores. Además, incluyendo algunas diferencias entre contratti di formazione lavoro y contratos de prácticas, la reforma de Treu conllevó una sustitución de transiciones por un trabajo permanente y un nuevo contrato de formación en el puesto de trabajo. Curiosamente, según la introducción de la reforma de Treu, los trabajadores deben acumular más experiencia en contratos de prácticas para lograr las mismas probabilidades de empleo futuro, lo que indica que las empresas italianas valoran la flexibilidad de los contratos de formación en el puesto de trabajo más que el contenido de la formación. La lección subyacente que podemos concluir es que, en los mercados laborales con poca demanda de trabajadores cualificados, las políticas destinadas al fomento del trabajo estable y a la evitación de las carreras precarias deberían tener en cuenta la eficacia de la formación en el puesto de trabajo y los niveles de los incentivos económicos.
Since the 1980s, many European labor markets have been reformed “at the margin” to reduce employment protection legislation that was believed to be the main reason for high and persistent unemployment among disadvantaged groups. In this context, new atypical contractual forms have been introduced and others have been more largely applied.
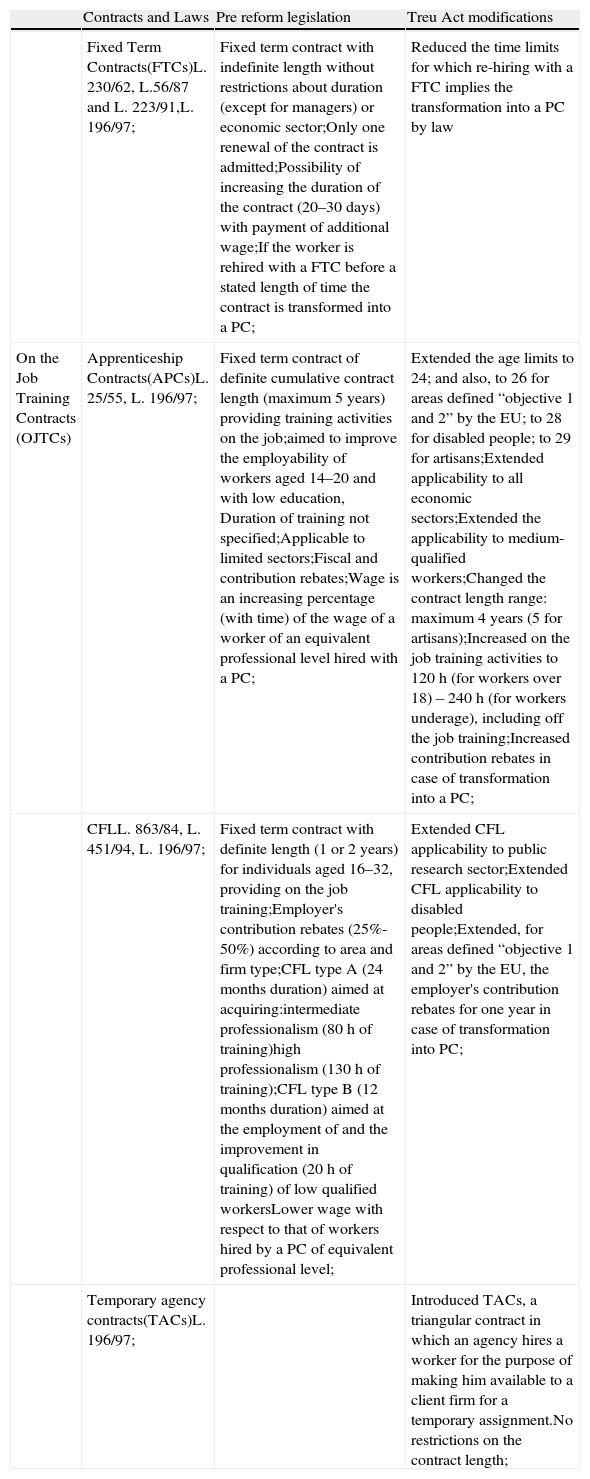
In Italy, atypical contractual forms include both contracts merely aimed at reducing firing costs, such as fixed-term contracts (FTCs) and temporary-agency contracts (TACs), and contracts more strictly devoted to make the entry of youths into the labor market easier. These contracts, called on-the-job-training contracts (OJTCs), combine lower firing costs and specific on-the-job activities to train young workers. Italian OJTCs include two contractual forms, the Contratto di Formazione Lavoro (CFL) and the apprenticeship contract (APC), that differ in terms of age limits and contract duration (see Table 1).
Atypical contracts legislation and Treu Act modifications.
| Contracts and Laws | Pre reform legislation | Treu Act modifications | |
| Fixed Term Contracts(FTCs)L. 230/62, L.56/87 and L. 223/91,L. 196/97; | Fixed term contract with indefinite length without restrictions about duration (except for managers) or economic sector;Only one renewal of the contract is admitted;Possibility of increasing the duration of the contract (20–30 days) with payment of additional wage;If the worker is rehired with a FTC before a stated length of time the contract is transformed into a PC; | Reduced the time limits for which re-hiring with a FTC implies the transformation into a PC by law | |
| On the Job Training Contracts (OJTCs) | Apprenticeship Contracts(APCs)L. 25/55, L. 196/97; | Fixed term contract of definite cumulative contract length (maximum 5 years) providing training activities on the job;aimed to improve the employability of workers aged 14–20 and with low education, Duration of training not specified;Applicable to limited sectors;Fiscal and contribution rebates;Wage is an increasing percentage (with time) of the wage of a worker of an equivalent professional level hired with a PC; | Extended the age limits to 24; and also, to 26 for areas defined “objective 1 and 2” by the EU; to 28 for disabled people; to 29 for artisans;Extended applicability to all economic sectors;Extended the applicability to medium-qualified workers;Changed the contract length range: maximum 4 years (5 for artisans);Increased on the job training activities to 120h (for workers over 18) – 240h (for workers underage), including off the job training;Increased contribution rebates in case of transformation into a PC; |
| CFLL. 863/84, L. 451/94, L. 196/97; | Fixed term contract with definite length (1 or 2 years) for individuals aged 16–32, providing on the job training;Employer's contribution rebates (25%-50%) according to area and firm type;CFL type A (24 months duration) aimed at acquiring:intermediate professionalism (80h of training)high professionalism (130h of training);CFL type B (12 months duration) aimed at the employment of and the improvement in qualification (20h of training) of low qualified workersLower wage with respect to that of workers hired by a PC of equivalent professional level; | Extended CFL applicability to public research sector;Extended CFL applicability to disabled people;Extended, for areas defined “objective 1 and 2” by the EU, the employer's contribution rebates for one year in case of transformation into PC; | |
| Temporary agency contracts(TACs)L. 196/97; | Introduced TACs, a triangular contract in which an agency hires a worker for the purpose of making him available to a client firm for a temporary assignment.No restrictions on the contract length; |
The training characteristics and the specific incentives often associated with the transformation into permanent contracts (PCs) make both OJTCs a privileged channel to reach a stable job. However, while the empirical literature devoted attention to the stepping-stone or trap role of temporary contracts in the transition toward permanent employment,1 the specific case of OJTCs has been scarcely investigated, although these contracts are of particular interest.2
Particularly, the contextual training and flexibility role of OJTCs possibly determines a trade-off in firms’ hiring process depending on the role emphasized by the employers. On the one hand, firms should be more prone to hire on-the-job trained workers for PCs, both because of the incentives in the case of transformation and because of the specific training provided to workers.3 On the other hand, the lower firing costs, the determined length and the lower pay associated with OJTCs may constitute an incentive not to transform the relationship into a PC. Thus, the probability of transition from an OJTC to a PC, apart from workers’ characteristics, will also depend on firms’ hiring preferences between the flexibility and training content of OJTC. No univocal responses may be given a priori, and the prevalent effect will depend on the balance of opposite impulses.
This paper attempts to disentangle the question focusing on the role of OJTCs in the Italian labor market in the context of the first Italian reform “at the margin” (Law 196/97, Treu Reform henceforth). The Treu Reform was introduced in 1997 to make one of the most rigid labor markets in Europe more flexible.4 In addition to creating Temporary Agency Contracts (TACs) and introducing negligible changes to FTCs,5 the reform substantially altered OJTCs. Particularly, the reform mainly acted in three directions to change OJTCs. First, the reform extended the age limits of their applicability. Second, the reform made training activities more substantial and increased the penalties for employers eluding job-training discipline. Third, the reform increased incentives for employers to transform OJTCs into PCs (Table 1).
Thus, although the age limit extension potentially favored both the number of workers potentially involved in OJTCs and the re-application of these contracts to the same worker, the Treu Reform mainly acted to increase the training contents of OJTCs and the incentives in the case of transformation into a PC. As a consequence, the transition probabilities from an OJTC to a PC should increase. Conversely, decreasing transition probabilities would indicate a predominance of the flexibility role of OJTCs in Italy.
As anticipated, even though OJTCs share underlying characteristics and principles, CFLs and APCs were different in the pre-reform period and were changed differently by the Treu Reform. For example, the age extension concerned APCs more than CFLs; because of these differences, the transitions out of OJTCs will be investigated separately. Therefore, an empirical analysis is conducted to estimate the flows out from CFLs and APCs toward a new labor market status and to evaluate whether and how the introduction of the Treu Reform changed the transition probabilities, with specific attention to the transitions toward PCs.6
Particularly, I apply a Multinomial Logit Model to Work Histories Italian Panel (WHIP), for the period ranging from August 1994 to December 1999, to estimate the flows out from OJTCs one year after the end of the original contract.7 Further controls are implemented to make my analysis more robust. First, a Chow test is used to control if the change in the transition probabilities is directly imputable to the Treu Reform. Second, and more importantly, I apply the Oaxaca-Blinder decomposition for nonlinear outcomes (Fairlie, 2006, Fairlie decomposition henceforth) to investigate the sources of the potential change in both the CFL–PC and APC–PC transitions. Particularly, the Fairlie decomposition allows one to determine if the potential changes in both transitions are explained by changes in worker characteristics, for example, due to the extended age limits, or if they are explained by changes in returns’ characteristics, indirectly representing the firms’ hiring preferences.
According to the estimation results, I find that the introduction of the Treu Reform involved a substitution between transitions into PCs and into both of the new OJTCs. Nevertheless, transitions between the different OJTCs appear to be quite negligible, even though CFL–APC transitions have increased in the post-reform period.
According to the Fairlie decomposition, the substitution effect is explained more by changes in returns in the workers’ characteristics than by changes in the workers’ characteristics implied by the reform. I also find that the Treu reform smoothed the human capital accumulation effect. This finding indicates that OJTC workers (particularly apprenticeships) need to accumulate a longer contract length, and hence more training and more experience, to achieve the same employment probability. Moreover, this finding possibly indicates that firms test workers for a longer period of time before converting their contract into PCs. These findings suggest that, in the Italian labor market, at least for manual professions, firms are more prone to use OJTCs because of their flexibility characteristics than because of their training content. A possible explanation is the structure of the Italian labor demand. In fact, the Italian labor market is historically characterized by a weak demand of skilled workers, for example, because of the small mean size of firms (Baldini and Toso, 2009). This finding means that, at least for manual professions, the stronger demand for unskilled workers lowers the advantages of hiring trainees. Finally, my findings open questions about the effectiveness of on-the-job training and of monetary incentives with respect to transforming OJTCs into PCs.
The remainder of this paper is organized as follows. Section 2 provides the empirical specification. Section 3 describes the data, while Section 4 presents the results. Section 4.2 provides the robustness checks of the econometric analysis. Finally, conclusions follow in Section 5.
2The modelThe probability of changing from an OJTC (a CFL or an APC) toward a new labor market status (namely, a non-working status, a permanent contract, or a CFL or apprenticeship contract) is estimated by applying a Multinomial Logit Model (MNL) pooled over time. The MNL model relies on the assumption of independence of irrelevant alternatives (IIA), for which the odds of preferring a choice over another do not depend on the presence or absence of other “irrelevant” alternatives.8 The MNL model allows me to analyze a reduced-form equation that estimates the factors affecting the product of the two probabilities, i.e., the probability of receiving a job offer and the probability of accepting it, for workers in an OJTC. Independent of the original contract (CFL or APC), let j denote the J possible categories of a polytomous response variable9 and i denote the agent.
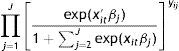
The multinomial probabilities associated with each response can be derived by assuming that an unobserved utility Uij is associated with each alternative and that the alternative with the highest utility is selected. Thus, the probability that the choice j is made is the following:
The utility of choice j is modeled as follows:where j, in turn, refers to NW (non-working condition, our base category), PC, new CFL, or APC if the original contract is a CFL and to NW, PC, CFL, or a new APC if the original contract is an apprenticeship contract.
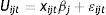
Moreover, xijt is a vector of explanatory variables including individual and job-related characteristics as well as a macro-economic indicator; βj is a vector of unknown parameters; and the ¿ijt are time-varying i.i.d error terms. If the ¿ijt follow the type I extreme value distribution, the probability of transition in status j at time t has a multinomial logit form:
where j=1 is selected as base category and the β1=0 condition is imposed for identification purposes.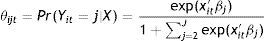
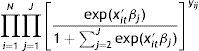
The model is estimated by maximum likelihood. The probability of an individual i choosing the alternative that he/she was actually observed to choose can be expressed as follows:
where yij takes the value of one if individual i chooses j; otherwise, it takes the value of zero. Assuming that the observations are independent, the likelihood for N observations may be written as follows:
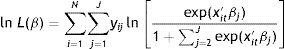
Taking the log of this equation results in the following log-likelihood function
Because some omitted individual characteristics may cause observations within individuals to be correlated over time, the usual standard error may be incorrect. Thus, these errors are replaced in all standard estimations by robust standard errors (Huber–White Sandwich estimator) with an additional correction for the effects of clustered data.
3Data description and source of bias3.1Data descriptionThe sub-sample used in our analysis is selected by the WHIP dataset, in its standard version, provided by the “Laboratorio Riccardo Revelli”. WHIP is a database of individual working histories, based on the National Institute of Social Security (INPS) administrative archives, and consists of a representative sample with a dynamic population of 370.000 individuals. The database provides full information from 1985 to 1999; however, I used only the information from August 1994 (when Law 451/94 was introduced)10 to 1999 for homogeneity purposes from a legislative point of view. For the sake of homogeneity, I only included individuals aged 16–32. Even if the data only reach 1999, the use of this dataset is recommended for at least three reasons. First, the dataset provides monthly information on private employment relationships; therefore, I can reconstruct the time of transitions with good precision. Second, OJTCs are recognizable with respect to other atypical contracts. Third, the data allow a comparison between the pre- and post-reform periods.
Flows out of the original OJTC are the units of observations. The after-one-year transitions control the new status of the worker exactly one year after the current OJTC ended. As anticipated above, in Italy, OJTCs include Apprenticeship Contracts and “Contratti di Formazione Lavoro”11; these two types of contracts are quite similar: both oblige employers to provide job training (on the job and/or off the job) to the employees, and they allow firms to pay reduced contributions. Differences concern contract length, age limits, hours of training that employers must provide and monetary incentive levels.
For each sampled individual, the single employment relationship is identified by the type of contribution rebate paid to the INPS. Employer contributions allow us to identify the contract type for each individual. In particular, in the database, I can distinguish between the contribution rebates relative to a permanent contract and three types of contribution rebates related to atypical contracts (CFLs, APCs and TACs). It is still not possible to identify individuals employed with FTCs because according to Italian legislation they do not benefit from a reduction of contribution rebates; thus, they are included jointly with PCs.12 Finally, only yearly information is available for Co.Co.Co. contracts, which are classified as self-employed by the Italian legislation. Individuals with Co.Co.Co. contracts are removed from my sample.
The units of observations related to the transitions after 12 months are 7841 (5983 individuals), 4695 of which refer to the pre-reform period. Regarding the OJTC type, 1/3 of the sampled individuals are employed with a CFL and 2/3 are employed with an APC, with a slight decrease of the former contractual form in the post-reform period.
The transition probability from generic OJTCs to another labor market status is estimated in terms of a set of covariates affecting workers’ and firms’ behavior. The age variable is introduced in a nonlinear way. Gender and territorial dummies were introduced to control for the presence of a disadvantaged position in the labor market that is also imputable to the demand side. Professional dummy variables, when their use is possible, allow us to catch possible differences due to workers’ skills or specific contract characteristics. Economic sector dummies intend to isolate specific effects for economic sectors that are more likely to be characterized by a short-term job relationship. The wage variable (expressed in daily terms) possibly allows us to catch the individual productivity in the original job; meanwhile, a part-time dummy is introduced to recognize possible discrimination in transitions for part-timers. The illness dummy is intended to control for possible health-problem effects. The actual OJTC length and experience variables were introduced in a nonlinear way. Both variables allow us to control for the effects of training and job experience accumulation, distinguishing between specific within-firm effects and no-within-firm effects. Nevertheless, when accounting for previous OJTCs experiences, we do not distinguish between CFLs and APCs. Finally, the future rate of local employment growth is introduced under the assumption of rational expectations, allowing to catch macroeconomic conditions.
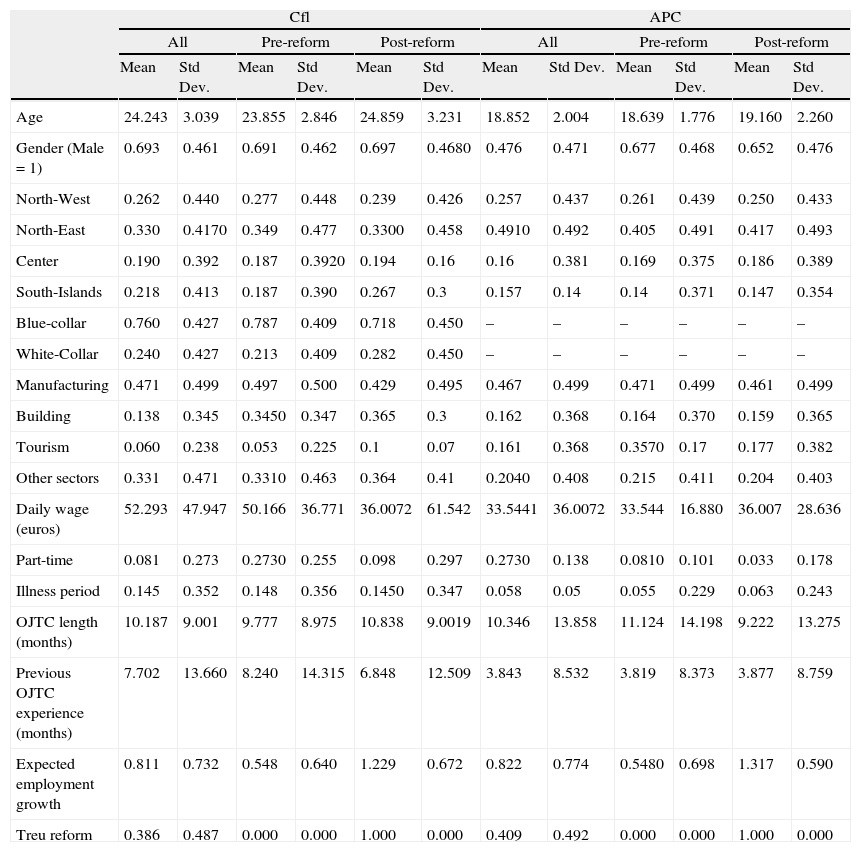
Table 2 shows descriptive statistics divided by period and type of OJTC. Their values refer to the original contract, and in the case of time-varying covariates, I considered the value at the end of the original contract. Examining Table 2, we are able to discover some differences between CFLs and APCs. Obviously, CFL workers are, on average, older than APC workers. Moreover, differences emerge in terms of territorial distribution, sector, previous wage (APC workers earn less than CFL workers), illness periods and previous OJTC experience.
Descriptive statistics.
| Cfl | APC | |||||||||||
| All | Pre-reform | Post-reform | All | Pre-reform | Post-reform | |||||||
| Mean | Std Dev. | Mean | Std Dev. | Mean | Std Dev. | Mean | Std Dev. | Mean | Std Dev. | Mean | Std Dev. | |
| Age | 24.243 | 3.039 | 23.855 | 2.846 | 24.859 | 3.231 | 18.852 | 2.004 | 18.639 | 1.776 | 19.160 | 2.260 |
| Gender (Male=1) | 0.693 | 0.461 | 0.691 | 0.462 | 0.697 | 0.4680 | 0.476 | 0.471 | 0.677 | 0.468 | 0.652 | 0.476 |
| North-West | 0.262 | 0.440 | 0.277 | 0.448 | 0.239 | 0.426 | 0.257 | 0.437 | 0.261 | 0.439 | 0.250 | 0.433 |
| North-East | 0.330 | 0.4170 | 0.349 | 0.477 | 0.3300 | 0.458 | 0.4910 | 0.492 | 0.405 | 0.491 | 0.417 | 0.493 |
| Center | 0.190 | 0.392 | 0.187 | 0.3920 | 0.194 | 0.16 | 0.16 | 0.381 | 0.169 | 0.375 | 0.186 | 0.389 |
| South-Islands | 0.218 | 0.413 | 0.187 | 0.390 | 0.267 | 0.3 | 0.157 | 0.14 | 0.14 | 0.371 | 0.147 | 0.354 |
| Blue-collar | 0.760 | 0.427 | 0.787 | 0.409 | 0.718 | 0.450 | – | – | – | – | – | – |
| White-Collar | 0.240 | 0.427 | 0.213 | 0.409 | 0.282 | 0.450 | – | – | – | – | – | – |
| Manufacturing | 0.471 | 0.499 | 0.497 | 0.500 | 0.429 | 0.495 | 0.467 | 0.499 | 0.471 | 0.499 | 0.461 | 0.499 |
| Building | 0.138 | 0.345 | 0.3450 | 0.347 | 0.365 | 0.3 | 0.162 | 0.368 | 0.164 | 0.370 | 0.159 | 0.365 |
| Tourism | 0.060 | 0.238 | 0.053 | 0.225 | 0.1 | 0.07 | 0.161 | 0.368 | 0.3570 | 0.17 | 0.177 | 0.382 |
| Other sectors | 0.331 | 0.471 | 0.3310 | 0.463 | 0.364 | 0.41 | 0.2040 | 0.408 | 0.215 | 0.411 | 0.204 | 0.403 |
| Daily wage (euros) | 52.293 | 47.947 | 50.166 | 36.771 | 36.0072 | 61.542 | 33.5441 | 36.0072 | 33.544 | 16.880 | 36.007 | 28.636 |
| Part-time | 0.081 | 0.273 | 0.2730 | 0.255 | 0.098 | 0.297 | 0.2730 | 0.138 | 0.0810 | 0.101 | 0.033 | 0.178 |
| Illness period | 0.145 | 0.352 | 0.148 | 0.356 | 0.1450 | 0.347 | 0.058 | 0.05 | 0.055 | 0.229 | 0.063 | 0.243 |
| OJTC length (months) | 10.187 | 9.001 | 9.777 | 8.975 | 10.838 | 9.0019 | 10.346 | 13.858 | 11.124 | 14.198 | 9.222 | 13.275 |
| Previous OJTC experience (months) | 7.702 | 13.660 | 8.240 | 14.315 | 6.848 | 12.509 | 3.843 | 8.532 | 3.819 | 8.373 | 3.877 | 8.759 |
| Expected employment growth | 0.811 | 0.732 | 0.548 | 0.640 | 1.229 | 0.672 | 0.822 | 0.774 | 0.5480 | 0.698 | 1.317 | 0.590 |
| Treu reform | 0.386 | 0.487 | 0.000 | 0.000 | 1.000 | 0.000 | 0.409 | 0.492 | 0.000 | 0.000 | 1.000 | 0.000 |
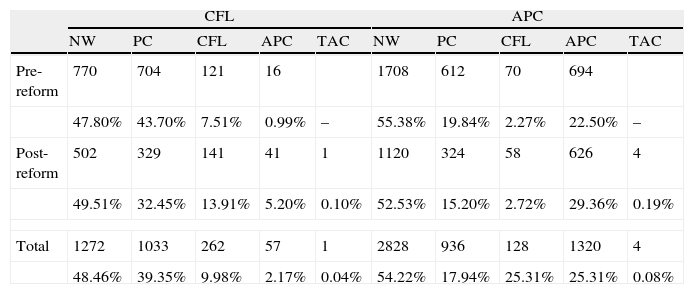
Table 3 provides information about observed after-one-year transitions, distinguishing between pre- and post-reform periods, distinguished by the original contract. Following the introduction of the Treu reform in June 1997, the instantaneous transitions into NW states have slightly increased for individuals leaving a CFL and have slightly decreased for individuals leaving a PAC; transitions into PCs have decreased (from 43.7% to 32.5% for workers leaving a CFL and from 19.8% to 15.2% for those leaving an APC) and transitions into new OJTCs (both CFL and APC) have increased. Transitions between the different OJTCs are quite negligible, although the CFL–APC transitions have increased in the post-reform period. Transitions into TACs are negligible. Moreover, further information concerning the transition rates for specific individual characteristics is provided in Tables 6A and 6B.
Observed transitions from OJTC.
| CFL | APC | |||||||||
| NW | PC | CFL | APC | TAC | NW | PC | CFL | APC | TAC | |
| Pre-reform | 770 | 704 | 121 | 16 | 1708 | 612 | 70 | 694 | ||
| 47.80% | 43.70% | 7.51% | 0.99% | – | 55.38% | 19.84% | 2.27% | 22.50% | – | |
| Post-reform | 502 | 329 | 141 | 41 | 1 | 1120 | 324 | 58 | 626 | 4 |
| 49.51% | 32.45% | 13.91% | 5.20% | 0.10% | 52.53% | 15.20% | 2.72% | 29.36% | 0.19% | |
| Total | 1272 | 1033 | 262 | 57 | 1 | 2828 | 936 | 128 | 1320 | 4 |
| 48.46% | 39.35% | 9.98% | 2.17% | 0.04% | 54.22% | 17.94% | 25.31% | 25.31% | 0.08% | |
Because WHIP data only provide yearly information about Co.Co.Co. contracts and include FTCs among PCs, their treatment in my analysis is likely to be a source of bias.
Not considering Co.Co.Co. contracts raises the possibility that some flows identified as transitions to a non-working status are actually transitions to a Co.Co.Co. contract. Thus, to avoid an over-estimation of the OJTC–NW flows, individuals with at least one experience with a Co.Co.Co. contract are removed from the sample. Consequent selection problems are likely to be negligible because only approximately 3% of the observations belonging to individuals with at least one Co.Co.Co. contract experience are deleted from the sample. Furthermore, descriptive statistics related to unrestricted and restricted samples are rather stable, the estimated coefficients maintain their signs, and their dimensions are affected only slightly.
Including FTCs into PCs means that the observed OJTC–PC transitions actually include both transitions into “true PCs, indicated as TPCs” as well as into FTCs (PC=TPC+FTC). Thus, the transitions into TPCs could be over-estimated. What is the magnitude of the bias? The available information appears to indicate that the over-estimation is quite small. According to Tronti and Ceccato (2004), in 2003, FTCs represented 6.7% of all contracts and the use of FTCs has increased during the second half of the 1990s (+6.2% per year from 1996 to 2003).13 Thus, in the period 1994–1999 (the years under investigation), FTCs are likely to represent a percentage of all contracts smaller than 6.7%. In contrast, PCs made up 76.1% in 2003 (76.6% in 2002), and considering their relative decreased use in previous years, it is possible to conclude that in the period 1994–1999 their percentage of the overall sample was greater than 76.1%. To summarize, in 2003, FTCs made up approximately 8.8% of PCs. Thus, given the increasing use of FTCs and the decreasing use of PCs in previous years, it is possible to conclude that the percentage of FTCs with respect to PCs was smaller than 8.8% in the analyzed period. However, the most important issue is the effect of the over-estimation of the OJTC–PC transitions. Using previous information, given that the use of FTCs has increased during the second half of the 1990s, it is possible to conclude that the over-estimation of the transitions to a TPC is greater in the post-Reform period. My results show a reduction in the OJTC–PC transitions; thus, considering the above, it is likely that a greater reduction in the OJTC–TPC transitions would be found if TPCs were observable. In fact, according to my results and to Tronti and Ceccato (2004)’s findings, it is possible to conclude that OJTC–PC transitions have decreased in the post-Reform period, while the use of FTCs has increased. Therefore, it is possible to conclude that in the post-Reform period, the reduction in OJTC–TPC transitions is greater than the reduction in OJTC–PC transitions; hence, conclusions about a reduction of OJTC–PC transitions should be conservative. From an analytical point of view, this thesis could be presented as follows:
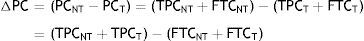
It follows that ΔPC=ΔTPC+ΔFTC; hence, ΔTPC=ΔPC−ΔFTC According to my previous findings,


therefore,
4Estimation results4.1Multinomial logit estimates
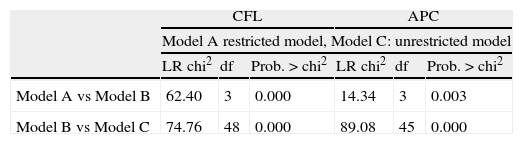
Estimation results are obtained by non-restricted models, which are the parameterization that includes a Treu reform dummy and the relevant interaction dummies because this solution is the best for fitting the data. In fact, the likelihood ratio tests reject the null hypothesis concerning the equality between the restricted and the less restricted model (that includes the Treu reform dummy) and the equality between the less restricted and the non-restricted model (see Table 4). This fact justifies the introduction of estimates comparing the pre- and post-Reform situation using two different groups.
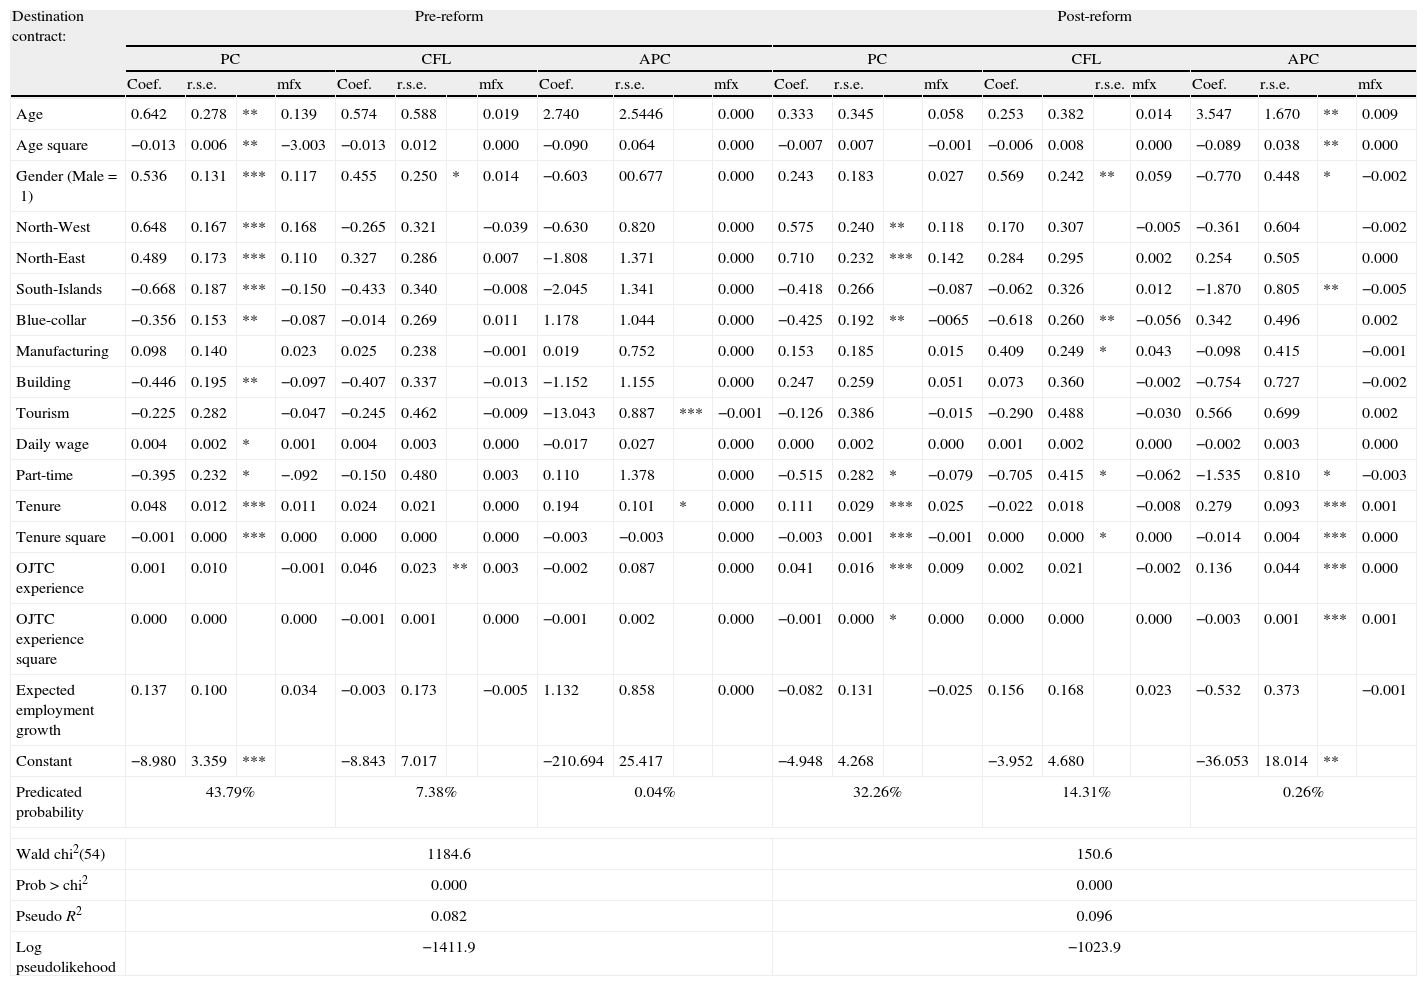
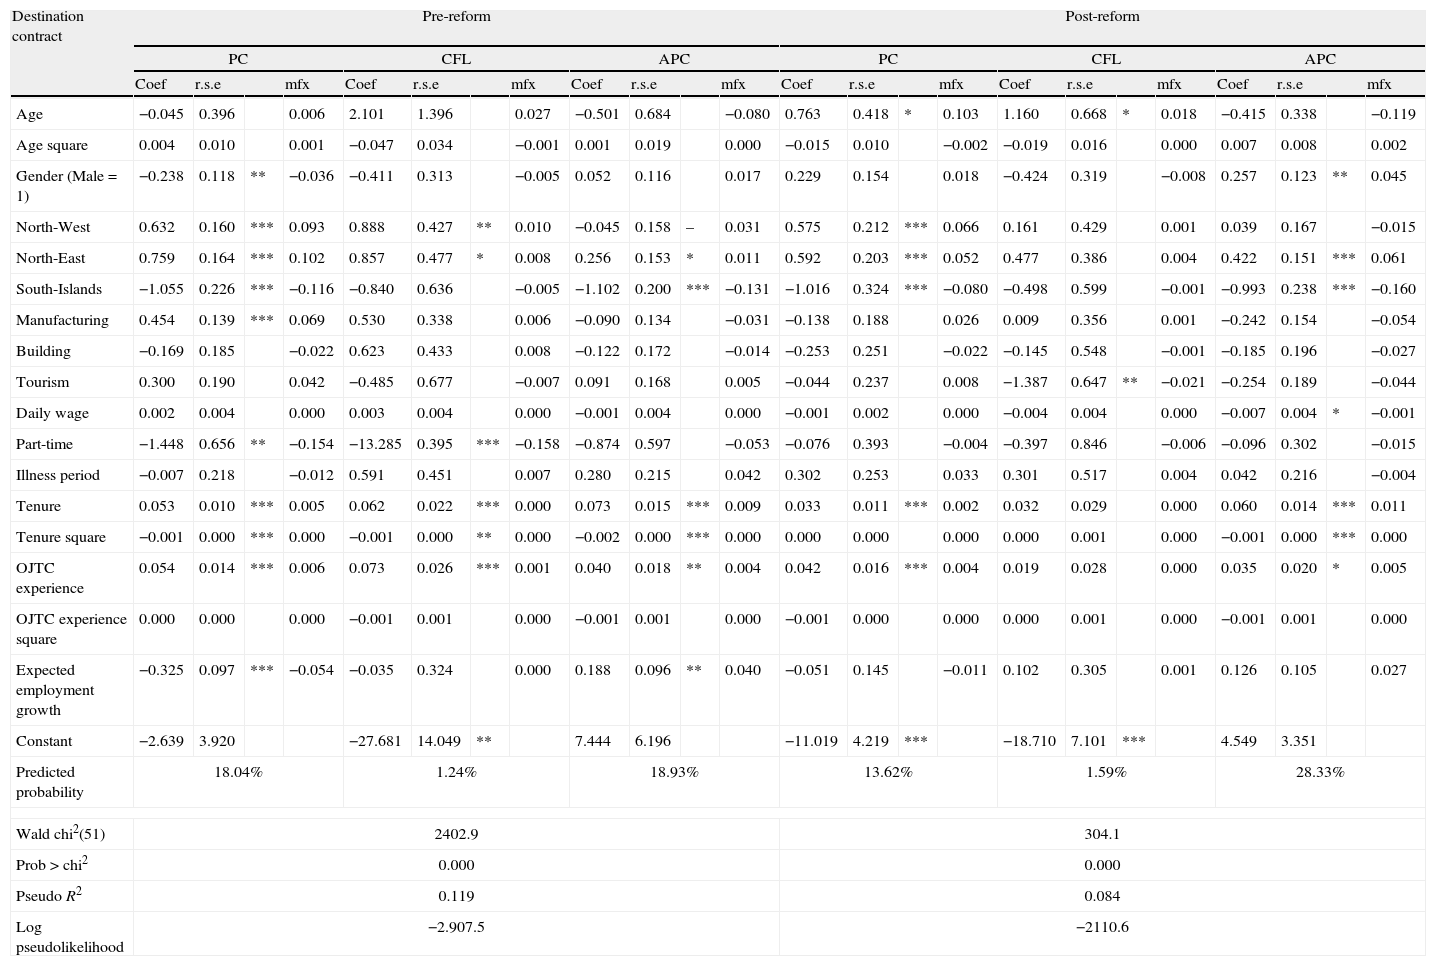
Tables 5A and 5B show estimates relative to the MNL models for 12 months after the transitions for workers leaving a CFL and for workers leaving an APC, respectively.
Pooled multinomial logit estimates. Original contract: CFL.
| Destination contract: | Pre-reform | Post-reform | ||||||||||||||||||||||
| PC | CFL | APC | PC | CFL | APC | |||||||||||||||||||
| Coef. | r.s.e. | mfx | Coef. | r.s.e. | mfx | Coef. | r.s.e. | mfx | Coef. | r.s.e. | mfx | Coef. | r.s.e. | mfx | Coef. | r.s.e. | mfx | |||||||
| Age | 0.642 | 0.278 | ** | 0.139 | 0.574 | 0.588 | 0.019 | 2.740 | 2.5446 | 0.000 | 0.333 | 0.345 | 0.058 | 0.253 | 0.382 | 0.014 | 3.547 | 1.670 | ** | 0.009 | ||||
| Age square | −0.013 | 0.006 | ** | −3.003 | −0.013 | 0.012 | 0.000 | −0.090 | 0.064 | 0.000 | −0.007 | 0.007 | −0.001 | −0.006 | 0.008 | 0.000 | −0.089 | 0.038 | ** | 0.000 | ||||
| Gender (Male=1) | 0.536 | 0.131 | *** | 0.117 | 0.455 | 0.250 | * | 0.014 | −0.603 | 00.677 | 0.000 | 0.243 | 0.183 | 0.027 | 0.569 | 0.242 | ** | 0.059 | −0.770 | 0.448 | * | −0.002 | ||
| North-West | 0.648 | 0.167 | *** | 0.168 | −0.265 | 0.321 | −0.039 | −0.630 | 0.820 | 0.000 | 0.575 | 0.240 | ** | 0.118 | 0.170 | 0.307 | −0.005 | −0.361 | 0.604 | −0.002 | ||||
| North-East | 0.489 | 0.173 | *** | 0.110 | 0.327 | 0.286 | 0.007 | −1.808 | 1.371 | 0.000 | 0.710 | 0.232 | *** | 0.142 | 0.284 | 0.295 | 0.002 | 0.254 | 0.505 | 0.000 | ||||
| South-Islands | −0.668 | 0.187 | *** | −0.150 | −0.433 | 0.340 | −0.008 | −2.045 | 1.341 | 0.000 | −0.418 | 0.266 | −0.087 | −0.062 | 0.326 | 0.012 | −1.870 | 0.805 | ** | −0.005 | ||||
| Blue-collar | −0.356 | 0.153 | ** | −0.087 | −0.014 | 0.269 | 0.011 | 1.178 | 1.044 | 0.000 | −0.425 | 0.192 | ** | −0065 | −0.618 | 0.260 | ** | −0.056 | 0.342 | 0.496 | 0.002 | |||
| Manufacturing | 0.098 | 0.140 | 0.023 | 0.025 | 0.238 | −0.001 | 0.019 | 0.752 | 0.000 | 0.153 | 0.185 | 0.015 | 0.409 | 0.249 | * | 0.043 | −0.098 | 0.415 | −0.001 | |||||
| Building | −0.446 | 0.195 | ** | −0.097 | −0.407 | 0.337 | −0.013 | −1.152 | 1.155 | 0.000 | 0.247 | 0.259 | 0.051 | 0.073 | 0.360 | −0.002 | −0.754 | 0.727 | −0.002 | |||||
| Tourism | −0.225 | 0.282 | −0.047 | −0.245 | 0.462 | −0.009 | −13.043 | 0.887 | *** | −0.001 | −0.126 | 0.386 | −0.015 | −0.290 | 0.488 | −0.030 | 0.566 | 0.699 | 0.002 | |||||
| Daily wage | 0.004 | 0.002 | * | 0.001 | 0.004 | 0.003 | 0.000 | −0.017 | 0.027 | 0.000 | 0.000 | 0.002 | 0.000 | 0.001 | 0.002 | 0.000 | −0.002 | 0.003 | 0.000 | |||||
| Part-time | −0.395 | 0.232 | * | −.092 | −0.150 | 0.480 | 0.003 | 0.110 | 1.378 | 0.000 | −0.515 | 0.282 | * | −0.079 | −0.705 | 0.415 | * | −0.062 | −1.535 | 0.810 | * | −0.003 | ||
| Tenure | 0.048 | 0.012 | *** | 0.011 | 0.024 | 0.021 | 0.000 | 0.194 | 0.101 | * | 0.000 | 0.111 | 0.029 | *** | 0.025 | −0.022 | 0.018 | −0.008 | 0.279 | 0.093 | *** | 0.001 | ||
| Tenure square | −0.001 | 0.000 | *** | 0.000 | 0.000 | 0.000 | 0.000 | −0.003 | −0.003 | 0.000 | −0.003 | 0.001 | *** | −0.001 | 0.000 | 0.000 | * | 0.000 | −0.014 | 0.004 | *** | 0.000 | ||
| OJTC experience | 0.001 | 0.010 | −0.001 | 0.046 | 0.023 | ** | 0.003 | −0.002 | 0.087 | 0.000 | 0.041 | 0.016 | *** | 0.009 | 0.002 | 0.021 | −0.002 | 0.136 | 0.044 | *** | 0.000 | |||
| OJTC experience square | 0.000 | 0.000 | 0.000 | −0.001 | 0.001 | 0.000 | −0.001 | 0.002 | 0.000 | −0.001 | 0.000 | * | 0.000 | 0.000 | 0.000 | 0.000 | −0.003 | 0.001 | *** | 0.001 | ||||
| Expected employment growth | 0.137 | 0.100 | 0.034 | −0.003 | 0.173 | −0.005 | 1.132 | 0.858 | 0.000 | −0.082 | 0.131 | −0.025 | 0.156 | 0.168 | 0.023 | −0.532 | 0.373 | −0.001 | ||||||
| Constant | −8.980 | 3.359 | *** | −8.843 | 7.017 | −210.694 | 25.417 | −4.948 | 4.268 | −3.952 | 4.680 | −36.053 | 18.014 | ** | ||||||||||
| Predicated probability | 43.79% | 7.38% | 0.04% | 32.26% | 14.31% | 0.26% | ||||||||||||||||||
| Wald chi2(54) | 1184.6 | 150.6 | ||||||||||||||||||||||
| Prob>chi2 | 0.000 | 0.000 | ||||||||||||||||||||||
| Pseudo R2 | 0.082 | 0.096 | ||||||||||||||||||||||
| Log pseudolikehood | −1411.9 | −1023.9 | ||||||||||||||||||||||
Pooled multinomial logit estimates. Original contract: APC.
| Destination contract | Pre-reform | Post-reform | ||||||||||||||||||||||
| PC | CFL | APC | PC | CFL | APC | |||||||||||||||||||
| Coef | r.s.e | mfx | Coef | r.s.e | mfx | Coef | r.s.e | mfx | Coef | r.s.e | mfx | Coef | r.s.e | mfx | Coef | r.s.e | mfx | |||||||
| Age | −0.045 | 0.396 | 0.006 | 2.101 | 1.396 | 0.027 | −0.501 | 0.684 | −0.080 | 0.763 | 0.418 | * | 0.103 | 1.160 | 0.668 | * | 0.018 | −0.415 | 0.338 | −0.119 | ||||
| Age square | 0.004 | 0.010 | 0.001 | −0.047 | 0.034 | −0.001 | 0.001 | 0.019 | 0.000 | −0.015 | 0.010 | −0.002 | −0.019 | 0.016 | 0.000 | 0.007 | 0.008 | 0.002 | ||||||
| Gender (Male=1) | −0.238 | 0.118 | ** | −0.036 | −0.411 | 0.313 | −0.005 | 0.052 | 0.116 | 0.017 | 0.229 | 0.154 | 0.018 | −0.424 | 0.319 | −0.008 | 0.257 | 0.123 | ** | 0.045 | ||||
| North-West | 0.632 | 0.160 | *** | 0.093 | 0.888 | 0.427 | ** | 0.010 | −0.045 | 0.158 | – | 0.031 | 0.575 | 0.212 | *** | 0.066 | 0.161 | 0.429 | 0.001 | 0.039 | 0.167 | −0.015 | ||
| North-East | 0.759 | 0.164 | *** | 0.102 | 0.857 | 0.477 | * | 0.008 | 0.256 | 0.153 | * | 0.011 | 0.592 | 0.203 | *** | 0.052 | 0.477 | 0.386 | 0.004 | 0.422 | 0.151 | *** | 0.061 | |
| South-Islands | −1.055 | 0.226 | *** | −0.116 | −0.840 | 0.636 | −0.005 | −1.102 | 0.200 | *** | −0.131 | −1.016 | 0.324 | *** | −0.080 | −0.498 | 0.599 | −0.001 | −0.993 | 0.238 | *** | −0.160 | ||
| Manufacturing | 0.454 | 0.139 | *** | 0.069 | 0.530 | 0.338 | 0.006 | −0.090 | 0.134 | −0.031 | −0.138 | 0.188 | 0.026 | 0.009 | 0.356 | 0.001 | −0.242 | 0.154 | −0.054 | |||||
| Building | −0.169 | 0.185 | −0.022 | 0.623 | 0.433 | 0.008 | −0.122 | 0.172 | −0.014 | −0.253 | 0.251 | −0.022 | −0.145 | 0.548 | −0.001 | −0.185 | 0.196 | −0.027 | ||||||
| Tourism | 0.300 | 0.190 | 0.042 | −0.485 | 0.677 | −0.007 | 0.091 | 0.168 | 0.005 | −0.044 | 0.237 | 0.008 | −1.387 | 0.647 | ** | −0.021 | −0.254 | 0.189 | −0.044 | |||||
| Daily wage | 0.002 | 0.004 | 0.000 | 0.003 | 0.004 | 0.000 | −0.001 | 0.004 | 0.000 | −0.001 | 0.002 | 0.000 | −0.004 | 0.004 | 0.000 | −0.007 | 0.004 | * | −0.001 | |||||
| Part-time | −1.448 | 0.656 | ** | −0.154 | −13.285 | 0.395 | *** | −0.158 | −0.874 | 0.597 | −0.053 | −0.076 | 0.393 | −0.004 | −0.397 | 0.846 | −0.006 | −0.096 | 0.302 | −0.015 | ||||
| Illness period | −0.007 | 0.218 | −0.012 | 0.591 | 0.451 | 0.007 | 0.280 | 0.215 | 0.042 | 0.302 | 0.253 | 0.033 | 0.301 | 0.517 | 0.004 | 0.042 | 0.216 | −0.004 | ||||||
| Tenure | 0.053 | 0.010 | *** | 0.005 | 0.062 | 0.022 | *** | 0.000 | 0.073 | 0.015 | *** | 0.009 | 0.033 | 0.011 | *** | 0.002 | 0.032 | 0.029 | 0.000 | 0.060 | 0.014 | *** | 0.011 | |
| Tenure square | −0.001 | 0.000 | *** | 0.000 | −0.001 | 0.000 | ** | 0.000 | −0.002 | 0.000 | *** | 0.000 | 0.000 | 0.000 | 0.000 | 0.000 | 0.001 | 0.000 | −0.001 | 0.000 | *** | 0.000 | ||
| OJTC experience | 0.054 | 0.014 | *** | 0.006 | 0.073 | 0.026 | *** | 0.001 | 0.040 | 0.018 | ** | 0.004 | 0.042 | 0.016 | *** | 0.004 | 0.019 | 0.028 | 0.000 | 0.035 | 0.020 | * | 0.005 | |
| OJTC experience square | 0.000 | 0.000 | 0.000 | −0.001 | 0.001 | 0.000 | −0.001 | 0.001 | 0.000 | −0.001 | 0.000 | 0.000 | 0.000 | 0.001 | 0.000 | −0.001 | 0.001 | 0.000 | ||||||
| Expected employment growth | −0.325 | 0.097 | *** | −0.054 | −0.035 | 0.324 | 0.000 | 0.188 | 0.096 | ** | 0.040 | −0.051 | 0.145 | −0.011 | 0.102 | 0.305 | 0.001 | 0.126 | 0.105 | 0.027 | ||||
| Constant | −2.639 | 3.920 | −27.681 | 14.049 | ** | 7.444 | 6.196 | −11.019 | 4.219 | *** | −18.710 | 7.101 | *** | 4.549 | 3.351 | |||||||||
| Predicted probability | 18.04% | 1.24% | 18.93% | 13.62% | 1.59% | 28.33% | ||||||||||||||||||
| Wald chi2(51) | 2402.9 | 304.1 | ||||||||||||||||||||||
| Prob>chi2 | 0.000 | 0.000 | ||||||||||||||||||||||
| Pseudo R2 | 0.119 | 0.084 | ||||||||||||||||||||||
| Log pseudolikelihood | −2.907.5 | −2110.6 | ||||||||||||||||||||||
Examining Table 5A (i.e., workers leaving a CFL), estimates show a typical inverted U effect for the age variable for OJTC–PC transitions, while a similar effect is found just with regard to CFL–APC transitions in the post-reform period. Being male increases the probability of CFL–PC transitions in the pre-reform period by 11.7%, whereas in the post-reform period, the estimates are not significant. Being male also increases the probability of CFL–CFL transitions; moreover, this positive impact has increased (from +1.4% to +5.9%) following the introduction of the Treu Reform. Conversely, in the post-reform period, being male significantly (and slightly) reduces the probability of a CFL–APC transition. Territorial duality in the Italian labor market is confirmed by our estimates. The probability of CFL–PC transitions is higher for Northern workers and lower for the Southern ones; nevertheless, the Treu Reform has contributed to reduce the territorial gap. No significant evidence emerges for other investigated transitions besides the fact that Southern workers are less likely to transition from a CFL to an APC. Examining the profession, we find that CFL blue-collar workers are less likely to transition toward a PC compared with white-collar workers. The negative effect slightly decreases in the post-reform period. A similar negative impact is found for the CFL–CFL transitions of blue-collar workers in the post-reform period. Economic sector dummies are rarely significant for workers leaving a CFL. In the pre-reform period, being a worker employed in the building sector reduces the probability of a CFL–PC transition by 10%. The wage level in the starting CFL also increases the probability of CFL–PC transitions, possibly as a consequence of higher productivity measured by the wage variable. Conversely, having experienced illness periods in the post-reform period reduces the probability of transitions both toward an APC and, particularly, toward a PC. Tenure positively affects the probability of CFL–PC transitions in the pre-reform period and of both CFL–PC and CFL–APC transitions in the post-reform period, suggesting a human capital accumulation effect.14 Interestingly, the inverted U effect increases after the introduction of the Treu Reform for CFL–PC transitions. This result indicates that a CFL worker needs less experience to transit to a PC. We anticipate that even though the inverted U effect is confirmed for the flows out from APCs, in that case the introduction of the Treu Reform has reduced the human capital accumulation effect. This assumption suggests a different behavior between the different OJTCs. Examining the role of previous OJTC experiences, we find a significant effect particularly in the post-reform period, suggesting again a human capital accumulation effect. Particularly, previous experiences affect the CFL–PC and the CFL–APC transitions following an inverted U effect. This finding possibly indicates that accumulating previous job training is positively perceived by firms as a factor of greater productivity because of job-specific/job-unspecific experiences. However, once again, the effect of the Treu Reform is opposed to that of APC–PC transitions (Table 5B). Finally, Table 5A indicates the predicted transition probabilities starting from a CFL. The predicted values confirm that the introduction of the Treu Reform has reduced the transitions toward a PC (from 43.8% to 32.3%), has increased the transitions toward a new CFL (from 7.4% to 14.3%) and has a negligible effect on the CFL–APC transitions. This result suggests that the Treu Reform has involved a substitution between transitions into a PC and into a new CFL.
Table 5B contains estimates for the sub-samples of workers leaving an APC. We find that in the post-reform period, the probability of being employed, one year later, in a permanent relationship or with a CFL increases as age increases. Being male appears to be less relevant for workers leaving a CFL. The impact is significant (and negative) for APC–PC transitions in the pre-reform period and significant (and positive) for APC–APC transitions. As we have previously found for CFL as well as for APC flows out, we find evidence of territorial duality. The probability of being employed one year after the end of an APC is higher in the Northern regions and lower in the Southern regions. When significant, the effect is particularly stronger for transitions toward a PC and a new APC. In the pre-reform period, concerning the APC–PC transitions, the positive effect (with respect to the base category, the Italian central regions) of working in the North West was equal to 9.3% and equal to 10.2% for working in the North East. Conversely, the negative effect for working in the South was equal to 11.6%. Although a duality emerges also for the post-reform period, the gap has decreased. In fact, the positive effects for North West and North East were equal to 6.6% and 5.2%, respectively, and the negative effect for the South was equal to 8%. Differently from what emerged for the APC–PC transitions, the territorial duality for the APC–APC transitions has increased. Concerning the economic sectors, we find a significant effect (+6.9%) in the pre-reform period for the manufacturing dummy for transitions toward a PC and a significant effect (−2.1%) in the post-reform period for the APC–CFL transitions for the tourism dummy. The wage variable estimate is only significant (and negative) for the APC–APC transitions in the post-reform period, while being employed as a part-timer negatively affects the probability of reaching a PC or a CFL in the pre-reform period. This result is possibly suggesting a marginalization for part-time workers. Concerning tenure, as explained above, we found evidence of a human capital accumulation effect. However, this effect has decreased after the introduction of the Treu Reform, possibly as a consequence of the extension of the age limits for the application of APCs and/or suggesting a loss of effectiveness of on-the-job training in APCs. Although not always significant, previous accumulated job training increases the probability of moving to a new job, suggesting that previous OJTC experiences do not reduce the probability of finding a permanent job. In fact, repeated previous OJTC experiences not transformed into a PC relationship may send bad signals about workers’ ability; however, these signals may be countervailed by later employment positions because the workers have already been re-tested by other firms. In addition, cumulative job training likely makes firms more prone to hire workers with some job experiences rather than individuals without any training. Quite surprisingly, the expected employment growth variable, if significant (and before the introduction of the Treu Reform), shows a positive effect for the APC–APC transitions and a negative effect for the APC–PC transitions. Finally, Table 5B shows the predicted transition probabilities starting from an APC. As above, the predicted values confirm that the introduction of the Treu Reform has reduced the transitions toward a PC (from 18.1% to 13.6%), has increased the transitions toward a new APC (from 18.9% to 28.3%) and has a negligible effect on the APC–CFL transitions. Once again, this result suggests that the Treu Reform has involved a substitution between transitions into a PC and into a new APC.
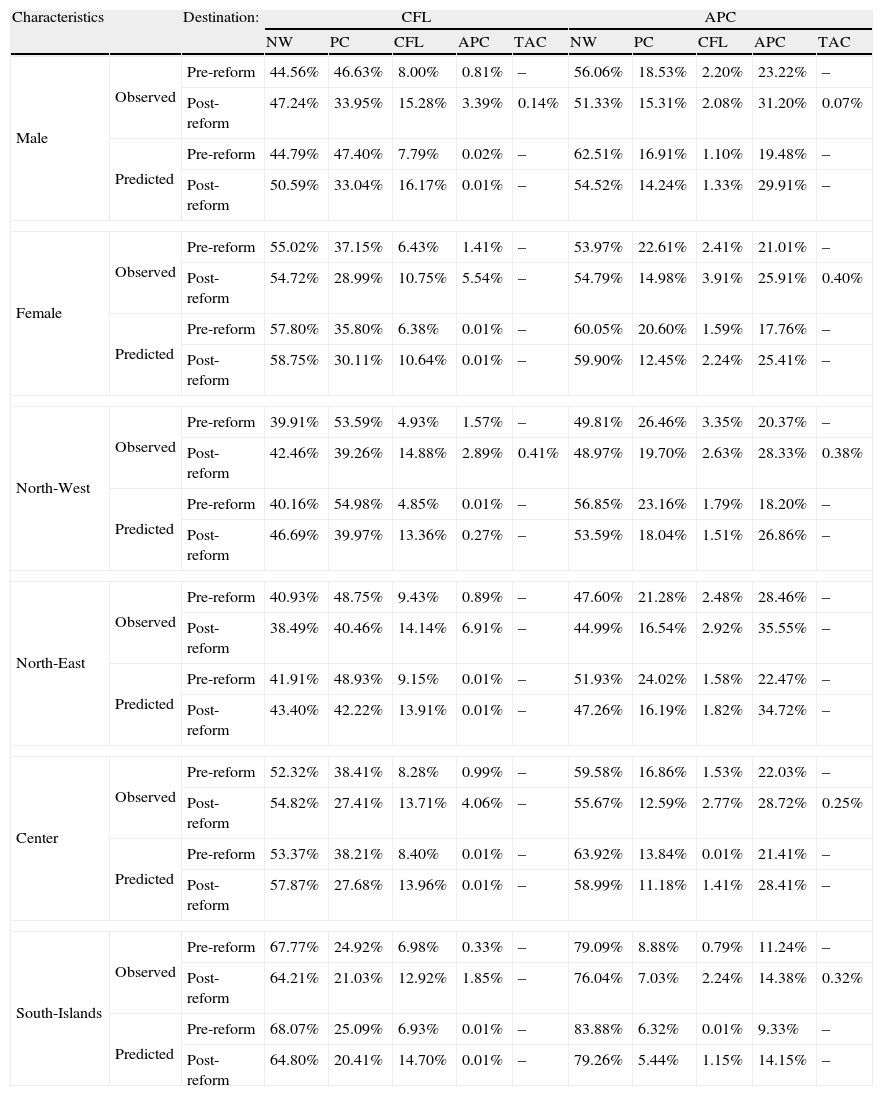
The obtained estimation results are applied to the mean values of the set of covariates to obtain the estimated values of transition probabilities, distinguishing between pre- and post-reform periods. As a further confirmation of the goodness of the estimation results, the observed and computed transition probabilities move in the same direction and differences in magnitude are quite small. Here, for brevity, I only comment on the more interesting predicted values (Tables 6A and 6B).
Observed and predicted transitions from CFL and APC.
| Characteristics | Destination: | CFL | APC | |||||||||
| NW | PC | CFL | APC | TAC | NW | PC | CFL | APC | TAC | |||
| Male | Observed | Pre-reform | 44.56% | 46.63% | 8.00% | 0.81% | – | 56.06% | 18.53% | 2.20% | 23.22% | – |
| Post-reform | 47.24% | 33.95% | 15.28% | 3.39% | 0.14% | 51.33% | 15.31% | 2.08% | 31.20% | 0.07% | ||
| Predicted | Pre-reform | 44.79% | 47.40% | 7.79% | 0.02% | – | 62.51% | 16.91% | 1.10% | 19.48% | – | |
| Post-reform | 50.59% | 33.04% | 16.17% | 0.01% | – | 54.52% | 14.24% | 1.33% | 29.91% | – | ||
| Female | Observed | Pre-reform | 55.02% | 37.15% | 6.43% | 1.41% | – | 53.97% | 22.61% | 2.41% | 21.01% | – |
| Post-reform | 54.72% | 28.99% | 10.75% | 5.54% | – | 54.79% | 14.98% | 3.91% | 25.91% | 0.40% | ||
| Predicted | Pre-reform | 57.80% | 35.80% | 6.38% | 0.01% | – | 60.05% | 20.60% | 1.59% | 17.76% | – | |
| Post-reform | 58.75% | 30.11% | 10.64% | 0.01% | – | 59.90% | 12.45% | 2.24% | 25.41% | – | ||
| North-West | Observed | Pre-reform | 39.91% | 53.59% | 4.93% | 1.57% | – | 49.81% | 26.46% | 3.35% | 20.37% | – |
| Post-reform | 42.46% | 39.26% | 14.88% | 2.89% | 0.41% | 48.97% | 19.70% | 2.63% | 28.33% | 0.38% | ||
| Predicted | Pre-reform | 40.16% | 54.98% | 4.85% | 0.01% | – | 56.85% | 23.16% | 1.79% | 18.20% | – | |
| Post-reform | 46.69% | 39.97% | 13.36% | 0.27% | – | 53.59% | 18.04% | 1.51% | 26.86% | – | ||
| North-East | Observed | Pre-reform | 40.93% | 48.75% | 9.43% | 0.89% | – | 47.60% | 21.28% | 2.48% | 28.46% | – |
| Post-reform | 38.49% | 40.46% | 14.14% | 6.91% | – | 44.99% | 16.54% | 2.92% | 35.55% | – | ||
| Predicted | Pre-reform | 41.91% | 48.93% | 9.15% | 0.01% | – | 51.93% | 24.02% | 1.58% | 22.47% | – | |
| Post-reform | 43.40% | 42.22% | 13.91% | 0.01% | – | 47.26% | 16.19% | 1.82% | 34.72% | – | ||
| Center | Observed | Pre-reform | 52.32% | 38.41% | 8.28% | 0.99% | – | 59.58% | 16.86% | 1.53% | 22.03% | – |
| Post-reform | 54.82% | 27.41% | 13.71% | 4.06% | – | 55.67% | 12.59% | 2.77% | 28.72% | 0.25% | ||
| Predicted | Pre-reform | 53.37% | 38.21% | 8.40% | 0.01% | – | 63.92% | 13.84% | 0.01% | 21.41% | – | |
| Post-reform | 57.87% | 27.68% | 13.96% | 0.01% | – | 58.99% | 11.18% | 1.41% | 28.41% | – | ||
| South-Islands | Observed | Pre-reform | 67.77% | 24.92% | 6.98% | 0.33% | – | 79.09% | 8.88% | 0.79% | 11.24% | – |
| Post-reform | 64.21% | 21.03% | 12.92% | 1.85% | – | 76.04% | 7.03% | 2.24% | 14.38% | 0.32% | ||
| Predicted | Pre-reform | 68.07% | 25.09% | 6.93% | 0.01% | – | 83.88% | 6.32% | 0.01% | 9.33% | – | |
| Post-reform | 64.80% | 20.41% | 14.70% | 0.01% | – | 79.26% | 5.44% | 1.15% | 14.15% | – | ||
Observed and predicted transitions from CFL and APC.
| Characteristics | Destination: | CFL | APC | |||||||||
| NW | PC | CFL | APC | TAC | NW | PC | CFL | APC | TAC | |||
| Aged up to 20 | Observed | Pre-reform | 55.95% | 29.76% | 7.74% | 6.55% | – | 56.31% | 16.71% | 1.84% | 25.14% | – |
| Post-reform | 50.00% | 28.41% | 7.95% | 13.64% | – | 53.31% | 12.14% | 1.41% | 33.14% | – | ||
| Predicted | Pre-reform | 59.93% | 30.12% | 7.96% | 1.98% | – | 59.47% | 16.26% | 1.35% | 22.91% | – | |
| Post-reform | 52.28% | 34.74% | 7.68% | 5.30% | – | 55.15% | 11.94% | 1.33% | 31.58% | |||
| Aged more than 20 | Observed | Pre-reform | 46.85% | 45.32% | 7.48% | 0.35% | – | 49.40% | 40.00% | 5.06% | 5.40% | 0.00% |
| Post-reform | 49.46% | 32.83% | 14.47% | 9.13% | 0.11% | 50.43% | 23.48% | 6.26% | 19.13% | 0.70% | ||
| Predicted | Pre-reform | 47.31% | 45.27% | 7.34% | 0.01% | – | 60.42% | 29.54% | 2.18% | 7.86% | – | |
| Post-reform | 52.57% | 31.53% | 14.76% | 1.13% | – | 54.34% | 19.90% | 5.24% | 20.53% | |||
| Blue collar | Observed | Pre-reform | 48.74% | 42.27% | 7.81% | 1.18% | – | |||||
| Post-reform | 51.37% | 31.04% | 12.91% | 4.53% | 0.14% | |||||||
| Predicted | Pre-reform | 50.45% | 41.94% | 7.61% | 0.01% | – | ||||||
| Post-reform | 56.50% | 30.41% | 12.77% | 0.01% | – | |||||||
| White collar | Observed | Pre-reform | 44.31% | 48.98% | 6.41% | 0.29% | – | |||||
| Post-reform | 44.76% | 36.01% | 16.43% | 2.80% | – | |||||||
| Predicted | Pre-reform | 42.73% | 50.73% | 6.53% | 0.01% | – | ||||||
| Post-reform | 44.52% | 36.64% | 18.67% | 0.01% | – | |||||||
| 0–6 months | Observed | Pre-reform | 52.02% | 39.33% | 8.09% | 0.56% | – | 57.88% | 14.57% | 1.70% | 25.85% | |
| Post-reform | 52.50% | 27.00% | 15.50% | 7.00% | – | 5%2.43% | 11.95% | 2.43% | 29.79% | 0.15% | ||
| Predicted | Pre-reform | 53.55% | 38.83% | 7.62% | 0.01% | – | 66.46% | 14.42% | 1.19% | 17.92% | – | |
| Post-reform | 56.40% | 27.24% | 15.96% | 0.01% | – | 6.85% | 11.48% | 1.58% | 26.85% | – | ||
| 7–12 months | Observed | Pre-reform | 47.03% | 43.93% | 7.75% | 1.29% | – | 54.41% | 22.17% | 1.26% | 22.17% | – |
| Post-reform | 46.36% | 34.55% | 14.09% | 5.00% | – | 47.72% | 17.89% | 1.75% | 32.28% | 0.35% | ||
| Predicted | Pre-reform | 48.27% | 43.44% | 3.44% | 0.01% | – | 57.66% | 19.37% | 0.01% | 22.40% | – | |
| Post-reform | 48.22% | 36.83% | 14.45% | 0.01% | – | 49.84% | 15.66% | 0.01% | 33.62% | – | ||
| 13–24 months | Observed | Pre-reform | 41.70% | 50.64% | 6.38% | 1.28% | – | 51.21% | 22.86% | 2.64% | 23.30% | – |
| Post-reform | 46.26% | 38.50% | 12.19% | 2.77% | 0.28% | 47.01% | 15.54% | 5.18% | 32.27% | – | ||
| Predicted | Pre-reform | 40.98% | 52.48% | 6.53% | 0.01% | – | 52.04% | 19.99% | 1.22% | 26.75% | – | |
| Post-reform | 48.02% | 39.38% | 12.21% | 0.01% | – | 47.95% | 14.02% | 2.64% | 35.38% | – | ||
| >24 months | Observed | Pre-reform | 51.35% | 37.84% | 8.11% | 2.70% | – | 50.85% | 34.83% | 4.91% | 9.40% | – |
| Post-reform | 69.70% | 18.18% | 12.12% | 0.42% | – | 46.25% | 30.00% | 2.92% | 2%0.42% | 0.42% | ||
| Predicted | Pre-reform | 47.83% | 43.67% | 8.40% | 0.01% | – | 50.90% | 30.63% | 2.09% | 16.38% | – | |
| Post-reform | 67.71% | 19.60% | 12.69% | 0.01% | – | 46.08% | 25.58% | 1.18% | 27.16% | – | ||
Generally, although with different magnitudes, the introduction of the Treu Reform has been followed by a reduction in the transitions toward a PC, independent of the original contract, and a relevant increase in the transitions toward new OJTCs. Transitions toward NW conditions have usually increased if the original contract was a CFL and have usually decreased if the original contract was an APC.
From a gender perspective (Table 6A), men have experienced an increase in the CFL–NW transitions (from 44.8% to 50.6%) and a reduction in the CFL–PC transitions (from 47.4% to 33.1%). Conversely, models predict a reduction in the APC–NW transitions (from 62.5% to 54.5%). Women have experienced smaller changes in the CFL flows out, while the APC flows out are more robust. For example, APC–PC transitions have decreased from 20.6% to 12.5%. Evidence concerning working areas is reported in Table 6A. Northwestern workers have experienced an increase in CFL–NW transitions and a slightly decrease in APC–NW transitions. These workers also have experienced a strong fall in the CFL–PC transitions (from 55% to 40%). Northeastern workers have experienced a similar trend; however, for workers starting from an APC, the effects have been stronger than for those starting from a CFL. A great reduction of CFL–PC transitions is also found for Central workers (from 38.2% to 27.7%). Southern workers have experienced a reduction both in the transitions toward NW and PC conditions, whereas the transitions toward new OJTCs have increased. As explained before, it follows that the Treu Reform has reduced the gap to the Northern regions. In any case, the gap remains significant in absolute terms.
Table 6B focuses on age, profession and tenure. Concerning the age variable, we consider individuals aged up to 20 years and individuals aged more than 20 years. Among the individuals aged up to 20 years, the transitions toward NW conditions have been reduced, independent of the starting OJTC. CFL–PC transitions have slightly increased (from 30.1% to 34.7%), whereas APC–PC transitions have slightly decreased (by approximately 4%). Transitions toward a CFL have remained stable, whereas transitions toward APCs have increased, possibly as a consequence of the extension of age limits. Older workers (aged 21–32) have experienced an increase in the transitions toward NW conditions if starting from a CFL and a reduction if starting from an APC. Transitions toward a PC have strongly decreased (−14% if starting from a CFL and −10% if starting from an APC). Transitions toward new OJTCs have increased, suggesting again a substitution effect. Profession is only analyzed for individuals starting with a CFL. Independent of the professional level (blue or white collar), the Treu Reform has reduced the transitions toward PCs and has increased the transitions toward new CFLs. In any case, the transition rate toward PCs has remained higher for white-collar workers than for blue-collar workers. Finally, we consider the tenure variable. The model predicts that, starting from a CFL, transitions toward NW conditions have slightly increased (or remained stable) for short tenures (maximum 12 months) while they have increased strongly (+20%) for longer tenures (more than 2 years). At the same time, transitions toward a PC have decreased independent of the tenure and have decreased strongly (from 43.7% to 19.6%) for tenures longer than 2 years. Transitions toward CFLs have slightly increased. This result suggests that the introduction of the Treu Reform has emphasized the flexibility role of CFLs. Examining APCs, the trend is similar but less dramatic. The transition rates toward NW conditions have sometimes decreased, while the reduction in the transition rates toward PCs has only slightly decreased (3–5%). Transitions toward new APCs have increased strongly (9–11%).
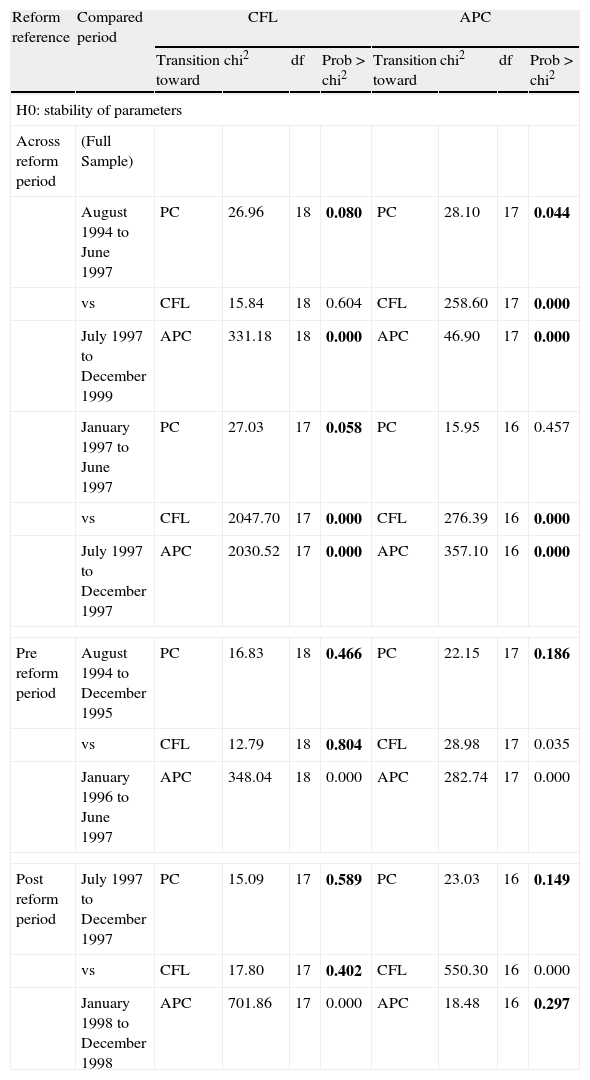
4.2Robustness checksA robustness check that I run to control the consistency of previous results is the Chow test. Particularly, this test is performed to control if the change in transition probabilities is due to the introduction of the Reform or, conversely, is explained by other evolutions of labor market conditions. Two streams of Chow tests are used. First, I test the stability of the parameters (the null hypothesis) across the Reform, using a cut-off point in correspondence with the introduction of the Reform. In this case, I should expect a rejection of the null hypothesis if the introduction of the Treu Reform changed the estimated coefficients. Second, I test the stability of the parameters between a set of homogenous sub-periods, i.e., either fully belonging to the pre-Reform period or fully belonging to the post-Reform period. In this case, I should expect a non-rejection of the null hypothesis because the tested periods are not affected by any reform and the parameters should be stable. The results reported in Table 7 are quite encouraging. In fact, quite encouragingly and despite some exceptions, the first stream of Chow tests tends to reject the hypothesis of stability while the second stream tends to not reject the null hypothesis.
Chow tests.
| Reform reference | Compared period | CFL | APC | ||||||
| Transition toward | chi2 | df | Prob>chi2 | Transition toward | chi2 | df | Prob>chi2 | ||
| H0: stability of parameters | |||||||||
| Across reform period | (Full Sample) | ||||||||
| August 1994 to June 1997 | PC | 26.96 | 18 | 0.080 | PC | 28.10 | 17 | 0.044 | |
| vs | CFL | 15.84 | 18 | 0.604 | CFL | 258.60 | 17 | 0.000 | |
| July 1997 to December 1999 | APC | 331.18 | 18 | 0.000 | APC | 46.90 | 17 | 0.000 | |
| January 1997 to June 1997 | PC | 27.03 | 17 | 0.058 | PC | 15.95 | 16 | 0.457 | |
| vs | CFL | 2047.70 | 17 | 0.000 | CFL | 276.39 | 16 | 0.000 | |
| July 1997 to December 1997 | APC | 2030.52 | 17 | 0.000 | APC | 357.10 | 16 | 0.000 | |
| Pre reform period | August 1994 to December 1995 | PC | 16.83 | 18 | 0.466 | PC | 22.15 | 17 | 0.186 |
| vs | CFL | 12.79 | 18 | 0.804 | CFL | 28.98 | 17 | 0.035 | |
| January 1996 to June 1997 | APC | 348.04 | 18 | 0.000 | APC | 282.74 | 17 | 0.000 | |
| Post reform period | July 1997 to December 1997 | PC | 15.09 | 17 | 0.589 | PC | 23.03 | 16 | 0.149 |
| vs | CFL | 17.80 | 17 | 0.402 | CFL | 550.30 | 16 | 0.000 | |
| January 1998 to December 1998 | APC | 701.86 | 17 | 0.000 | APC | 18.48 | 16 | 0.297 | |
Note: Bold fonts refer to the chi2 tests supporting the hypothesis of a structural break in June 1997 and stability in other periods.
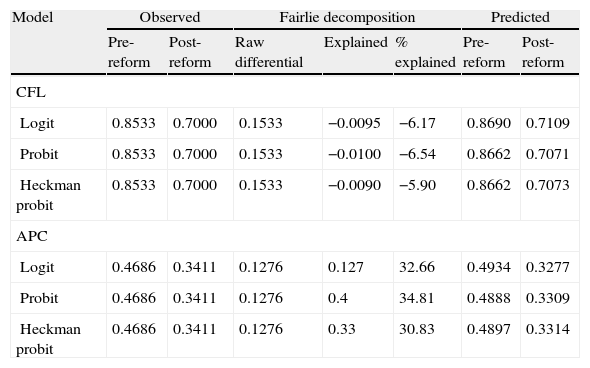
A second robustness check that I use is the Fairlie decomposition technique.15 This technique allows uncovering the sources of the OJTC–PC transition probability differentials across the Reform, distinguishing between the explained and the unexplained part. Particularly, the explained part represents the change in OJTC–PC transitions due to changes in individual characteristics, including those brought by the introduction of the Reform (such as the increase in age limits). The unexplained part represents the change in OJTC–PC transitions due to changes in returns’ characteristics. Because individual characteristics are given, a shift in firms’ hiring preferences determining a decrease in OJTC–PC transitions may be consistent only with a reduction in characteristics’ returns of individuals. Thus, if the unexplained part is a component of the observed decrease in the post-reform OJTC–PC transitions, it will also depend on labor-demand-side effects.
However, because the decomposition is only allowed for binary outcomes, I only apply it to a restricted sample of individuals moving to a new employment position (a PC or a new OJTC), excluding observations related to transitions toward a non-working status and the residual OJTC.16 According to previous evidence, both for transitions toward a CFL or an APC, a decrease in the probability of employment with a PC is found after the introduction of the Treu Reform (Table 8). Particularly, considering only transitions into new employment, observable CFL–PC transitions have decreased from 85.3% to 70% and observable APC–PC transitions have decreased from 46.9% to 34.1% after the introduction of the Treu Reform. The Fairlie decomposition is computed with reference to three possible binary outcome model specifications: a logit model, a probit model and a Heckman probit model that allows consistent estimates to be obtained in the presence of sample selection problems.17 My results show that differentials in CFL–PC transitions are not explained by differences in characteristics (the % explained is approximately −6%). Examining the changes in the characteristics, it rather appears that the introduction of the Treu Reform should have increased the transitions toward PCs. Changes in individual characteristics explain more about APC–PC transitions (approximately 35% according to the Probit model and approximately 30% according to the Heckman Probit model). These findings appear to confirm that changes in the transition rates are more likely to depend on changes in the estimated parameters, i.e., shifts in firms’ hiring preferences or other unobservable factors, possibly confirming that the effects of the Treu Reform are not simply restricted to predictable changes due to new legislation.
Fairlie decomposition.
| Model | Observed | Fairlie decomposition | Predicted | ||||
| Pre-reform | Post-reform | Raw differential | Explained | % explained | Pre-reform | Post-reform | |
| CFL | |||||||
| Logit | 0.8533 | 0.7000 | 0.1533 | −0.0095 | −6.17 | 0.8690 | 0.7109 |
| Probit | 0.8533 | 0.7000 | 0.1533 | −0.0100 | −6.54 | 0.8662 | 0.7071 |
| Heckman probit | 0.8533 | 0.7000 | 0.1533 | −0.0090 | −5.90 | 0.8662 | 0.7073 |
| APC | |||||||
| Logit | 0.4686 | 0.3411 | 0.1276 | 0.127 | 32.66 | 0.4934 | 0.3277 |
| Probit | 0.4686 | 0.3411 | 0.1276 | 0.4 | 34.81 | 0.4888 | 0.3309 |
| Heckman probit | 0.4686 | 0.3411 | 0.1276 | 0.33 | 30.83 | 0.4897 | 0.3314 |
The 1997 “Treu Act” reformed the Italian labor market “at the margin”. Among other provisions, this act extended the applicability of OJTCs (including CFL and APCs), made their conversion into PCs more favorable and reinforced their training role.
Through applying a MNL model to 1995–1999 WHIP data, I found that although the Treu Reform emphasized the training role of OJTCs, both the CFL–PC and the APC–PC after-12-month transitions decreased in the post-reform period.
However, some differences emerged in the post-reform behavior in the CFL and APC flows out. The reduction in the CFL–PC transitions has been balanced by an increase in both CFL–NW and CFL–CFL transitions, while the reduction in the APC–PC transitions has been smaller and accompanied by a strong increase in APC–APC transitions and a reduction in APC–NW transitions. This result could be viewed as a consequence of the significant age-limit extensions brought to APCs by the Treu Reform.
Robustness checks show that the Treu Reform led to parameter instability, at least for the OJTC–PC transition channels. More importantly, the reduction in the OJTC–PC transition probabilities is largely explained by changes in returns’ characteristics and the presence of unobservable factors (particularly for CFL–PC transitions). Among others, this finding suggests a shift in firms’ hiring preferences, rather than changes in characteristics per se, even though this latter factor has played a role concerning the flows out from APCs.
Our findings possibly suggest that the training contents of OJTCs are of little importance, at least for manual workers, whereas the flexibility contents of OJTCs have been emphasized in the Italian labor market. A possible explanation is the weakness of the Italian skilled labor demand, which tends to lower the need to hire workers with a specific training path.
A further difference between CFLs and APCs concerns the role of tenure and previous job training in affecting transitions toward PCs. Although a positive role of human capital accumulation exists in both cases, the effect of the Treu Reform diverges between the OJTC types. In fact, while the Treu Reform has increased the positive effect of both factors for CFL–PC transitions, it has decreased the positive effect for APC–PC transitions. This result suggests that CFL workers that transition into PCs move more rapidly than in the post-reform period, whereas the opposite occurs for APC–PC transitions. This result suggests that firms’ opportunity cost of not hiring trained workers with a PC is lower than the cost of renouncing the flexibility of APCs. Our results also confirm the existence of gender and territorial dualities, although the introduction of the Treu reform reduced North/South disparities.
In conclusion, our findings open questions about the effectiveness of on-the-job training activities and about the level of monetary incentives to hire OJTC workers permanently. Policies aimed at making the role of OJTCs more effective should consider the training content and the monetary incentive levels necessary to make OJTC workers more desirable for firms. These considerations appear particularly relevant for labor markets with a weak demand for skilled workers. Furthermore, policies ought to include specific measures in favor of disadvantages workers, i.e., women and Southern workers.
Among others, Alba-Ramirez (1998), Amuedo-Dorantes (2000), D’Addio and Rosholm (2005), Güell and Petrongolo (2007), Amuedo-Dorantes et al. (2008) have found negative or poor effects. Conversely, van den Berg et al. (2002) and Ichino et al. (2005) indicate a “stepping stone” toward permanent jobs. Gagliarducci, 2005 argued that the positive effect is conditional on not experiencing temporary work interrupted by long unemployment spells.
Booth and Satchell (1994) show the efficiency of OJTCs to provide employer-based general training. Gospel (1994) finds that trainees obtain portable skills across firms. Booth and Satchell (1994) and Winkelmann (1996) find that OJTCs promote longer job relationships and that on-the-job trained workers experience fewer unemployment spells in the transition to their first full-time employment than other workers.
Some discussions about the structure of incentives, training costs and training contents that are likely to affect firms’ hiring decisions are discussed in Harhoff and Kane (1997), Werwatz (2002) and Wolter et al. (2007).
According to the official statistics, during the period under analysis, the percentage of atypical workers raised, on average, from 10.82% to 11.88% across the pre- and post-reform periods. Because young workers are largely over-represented in atypical jobs, the raise of young atypical workers should be much stronger than 1%. In the year of the reform, the percentage of atypical workers over all subordinate workers increased from 10.76% (January–June 1997) to 11.51% (July–December 1997).
The introduction of TACs possibly produces a (negligible) reduction in transitions to a PC or a new OJTC. Changes in the FTC legislation are likely to produce only negligible effects.
Scarce literature focused on the Treu reform and mainly concentrated on TACs or temporary contracts as a whole. The literature includes Montanino and Sestito (2003), Ichino et al. (2005), Destefanis and Fonseca (2007) and Jiménez-Rodríguez and Russo (2008).
Because we are estimating the transitions one year after the end of the original contract, we use information for which the original contract ended by December 1998 and for which the destination contract is observable.
The critical implication of the IIA is that unobserved factors are assumed to be uncorrelated over alternatives and to have the same variance for all alternatives. In case of correlation, the IIA is violated. The IIA could be relaxed by applying a mixed MNL adopting, for example, the GLLAMMs program written in STATA by Rabe-Hesketh et al. (2004). Unfortunately, for our analysis, the maximization process does not converge; hence, we are unable to control for unobservable heterogeneity and for possible correlations among unobservable factors leading to the violation of the IIA. In any case, in a previous version of this paper where CFL and APCs were analyzed jointly, the estimation results obtained from a standard MNL and a mixed MNL possibly differed in magnitude and, sometimes, in significance but not in the essence.
It is convenient to think of these categories as alternatives and the response among alternatives even if the response does not strictly represent a choice.
This law has brought the last change in the labor market before the Treu reform, modifying the FTC discipline.
The CFL is defined as a fixed-term contractual form to hire young workers aged 16–32. Firms hiring workers under the CFL regulation are obliged to provide theoretical and practical training on the job and benefit in a reduction in the contribution rebates.
Possible biases due to FTCs and Co.Co.Co. contract data problems are discussed in the appendix.
Because the diffusion of FTCs is likely to be higher among young workers, while our data refers to all workers, our reasoning could be based on misleading information. Even though we cannot exclude that the percentages of FTCs among young workers could be higher, there is no particular reason to believe that the trend in the pre- and post-reform period for young workers is much different from that observed in the whole data. Thus, while it is likely that the percentages differ, it is unlikely that the essence and conclusions of our reasoning are incorrect.
This finding is consistent with Montanino's and Sestito's (2003) results on TAC effects.
The Fairlie decomposition reads as follows:
P is the probability of transitioning to a PC, T indicates the post-reform period and NT the pre-reform period.
The dependent variable takes the value one if the individual moves toward a PC and zero if the value moves toward a new OJTC (a CFL if the starting contract is a CFL, and an APC if the starting contract is an APC). Eliminating the other OJTC should be negligible because transitions across different OJTCs are a residual phenomenon.
In the Heckman probit model, both the selection and the outcome equation consist in a binary response variable (work/not work in the first one and PC/OJTC in the second one).