Bioelectrical Impedance Analysis (BIA) is a tool used in clinical nutrition and pure electrical data such as phase angle (PA) has shown prognostic value. It relates resistance and reactance indicating cellular health.
ObjectiveTo determine differences in PA between patients with obesity and disease-related malnutrition (DRM) compared to the healthy population, and to establish associations between PA and other body composition (BC) parameters.
Materials and methodsRetrospective observational study with 1079 patients from the Obesity and Nutrition Department of the Complejo Asistencial Universitario de León between April/2014 and August/2022 as well as 86 healthy controls. Demographic and anthropometric variables were collected and BC was performed with BIA Tanita MC780®. Diagnosis of malnutrition according to GLIM criteria and obesity with body mass index (BMI).
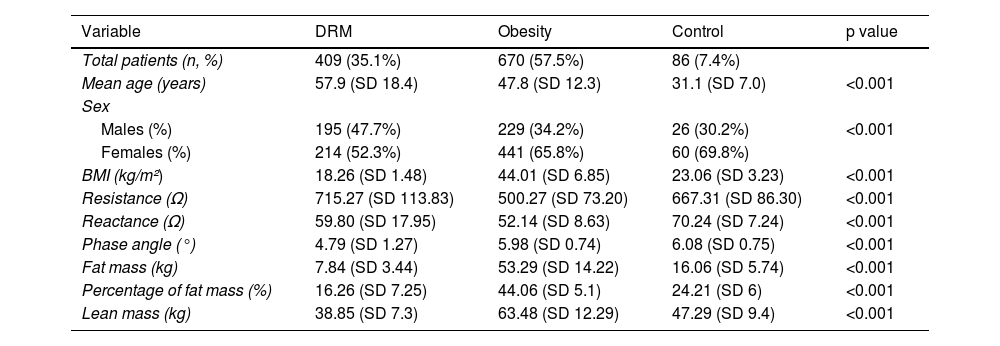
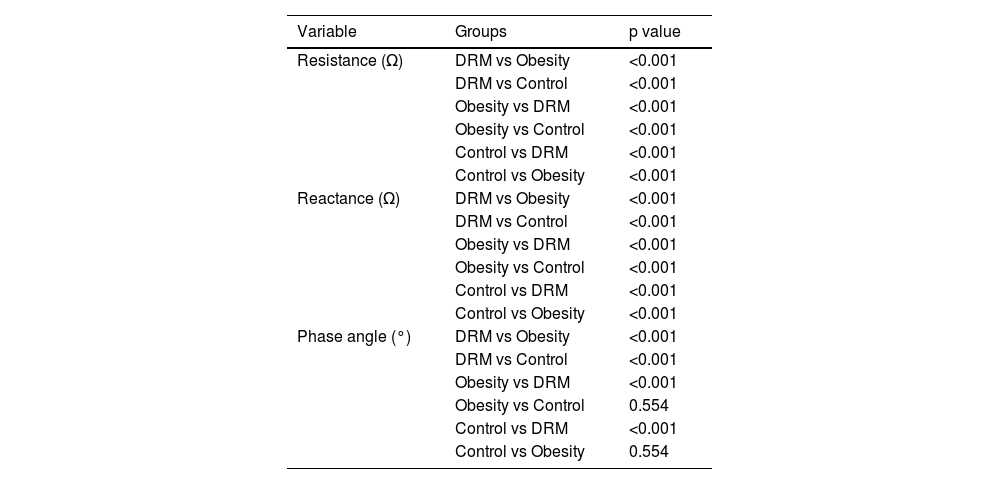
ResultsPA50KHz in obesity group is 5.98º, DRM 4.79º and control group 6.08º. Statistically significant differences in PA between DRM and control groups, as well as DRM and obesity (p < 0.001). Weak positive correlation in total population (r = 0.452, p < 0.001) as well as control group (r = 0.463, p < 0.001) between BMI and PA. Weak negative correlation in the total population (r = −0.408, p < 0.001), DRM (r = −0.268, p < 0.001) and obesity (r = −0.342, p < 0.001) between age and PA.
ConclusionsIn this study, significantly lower PA was observed in the DRM group than in the control and obesity groups. No statistically significant differences between PA in the obesity and control groups and no correlation between BMI and PA in the obesity group. More studies are needed to standardize cut-off points in different contexts and populations.
La bioimpedanciometría es una herramienta utilizada en nutrición clínica y datos eléctricos puros como el ángulo de fase (AF) han demostrado valor pronóstico. Relaciona resistencia y reactancia que indican salud celular.
ObjetivoDeterminar diferencias del AF entre pacientes con obesidad y con desnutrición relacionada con la enfermedad (DRE) respecto a población sana, y establecer asociaciones entre el AF con otros parámetros de composición corporal (CC).
Materiales y métodosEstudio observacional retrospectivo con 1079 pacientes de consultas de Obesidad y Nutrición del Complejo Asistencial Universitario de León entre Abril/2014 y Agosto/2022 así como 86 controles sanos. Se recogen variables demográficas, antropométricas y se realiza CC con bioimpedanciómetro Tanita MC780®. Diagnóstico de desnutrición según criterios GLIM y obesidad con índice de masa corporal (IMC).
ResultadosAF50KHz en grupo obesidad es 5,98º, DRE 4,79º y grupo control 6,08º. Diferencias estadísticamente significativas del AF entre grupos DRE y control, así como DRE y obesidad (p < 0,001). Correlación positiva débil en población total (r = 0,452, p < 0,001) así como grupo control (r = 0,463, p < 0,001) entre IMC y AF. Correlación negativa débil en la población total (r=-0,408, p < 0,001), DRE (r=-0,268, p < 0,001) y obesidad (r=-0,342, p < 0,001) entre edad y AF.
ConclusionesEn este estudio se observa AF significativamente menor en grupo DRE que grupo control y obesidad. No diferencias estadísticamente significativas entre el AF en grupo obesidad y control ni correlación entre IMC y AF en grupo obesidad. Se necesitan más estudios para estandarizar puntos de corte en diferentes contextos y poblaciones.


